![Tools for plottinghold on / off - Normally hold is off. This means that the plot command replaces the current plot with the new one. To add a new plot to an existing graph use hold on. If you want to overwrite the current plot again, use hold off.legend('plot1','plot2',...,'plot N') - The legend command provides an easy way to identify individual plots when there are more than one per figure.axis([xminxmaxyminymax])- Use the axis command to set the axis as you wish.](https://image.slidesharecdn.com/graphplots-091209015016-phpapp01/75/Graph-Plots-in-Matlab-4-2048.jpg)
![2-D plottingTo plot the function:y = x2 for x 2 [-2; 2].x = -2:0.2:2;](https://image.slidesharecdn.com/graphplots-091209015016-phpapp01/75/Graph-Plots-in-Matlab-7-2048.jpg)
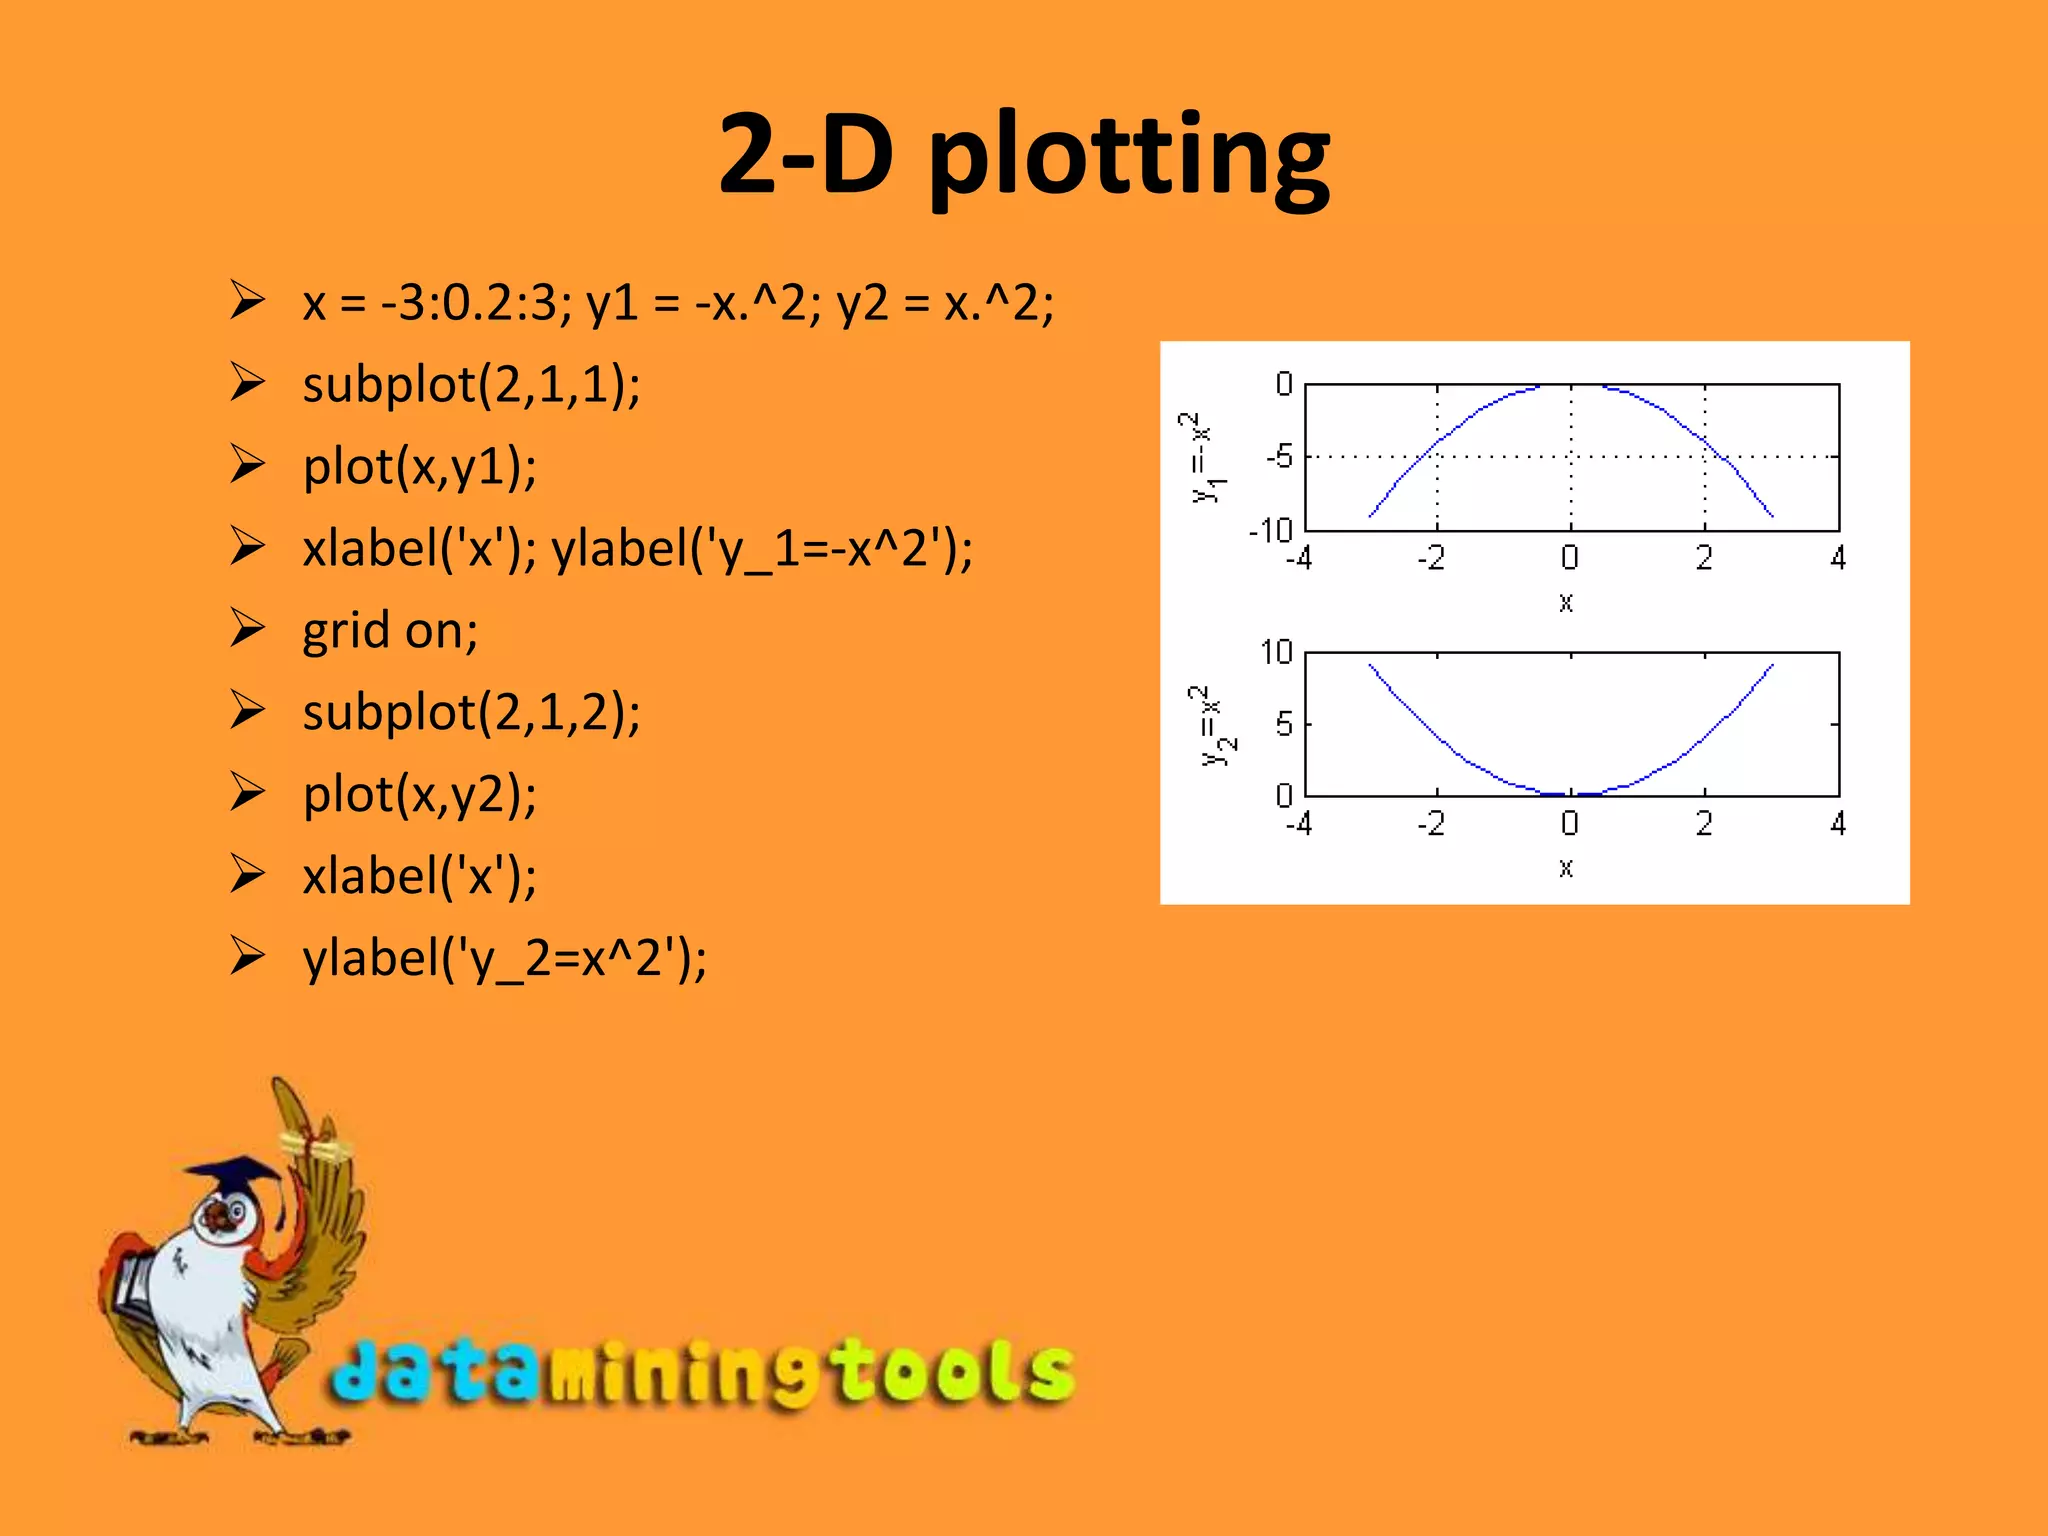
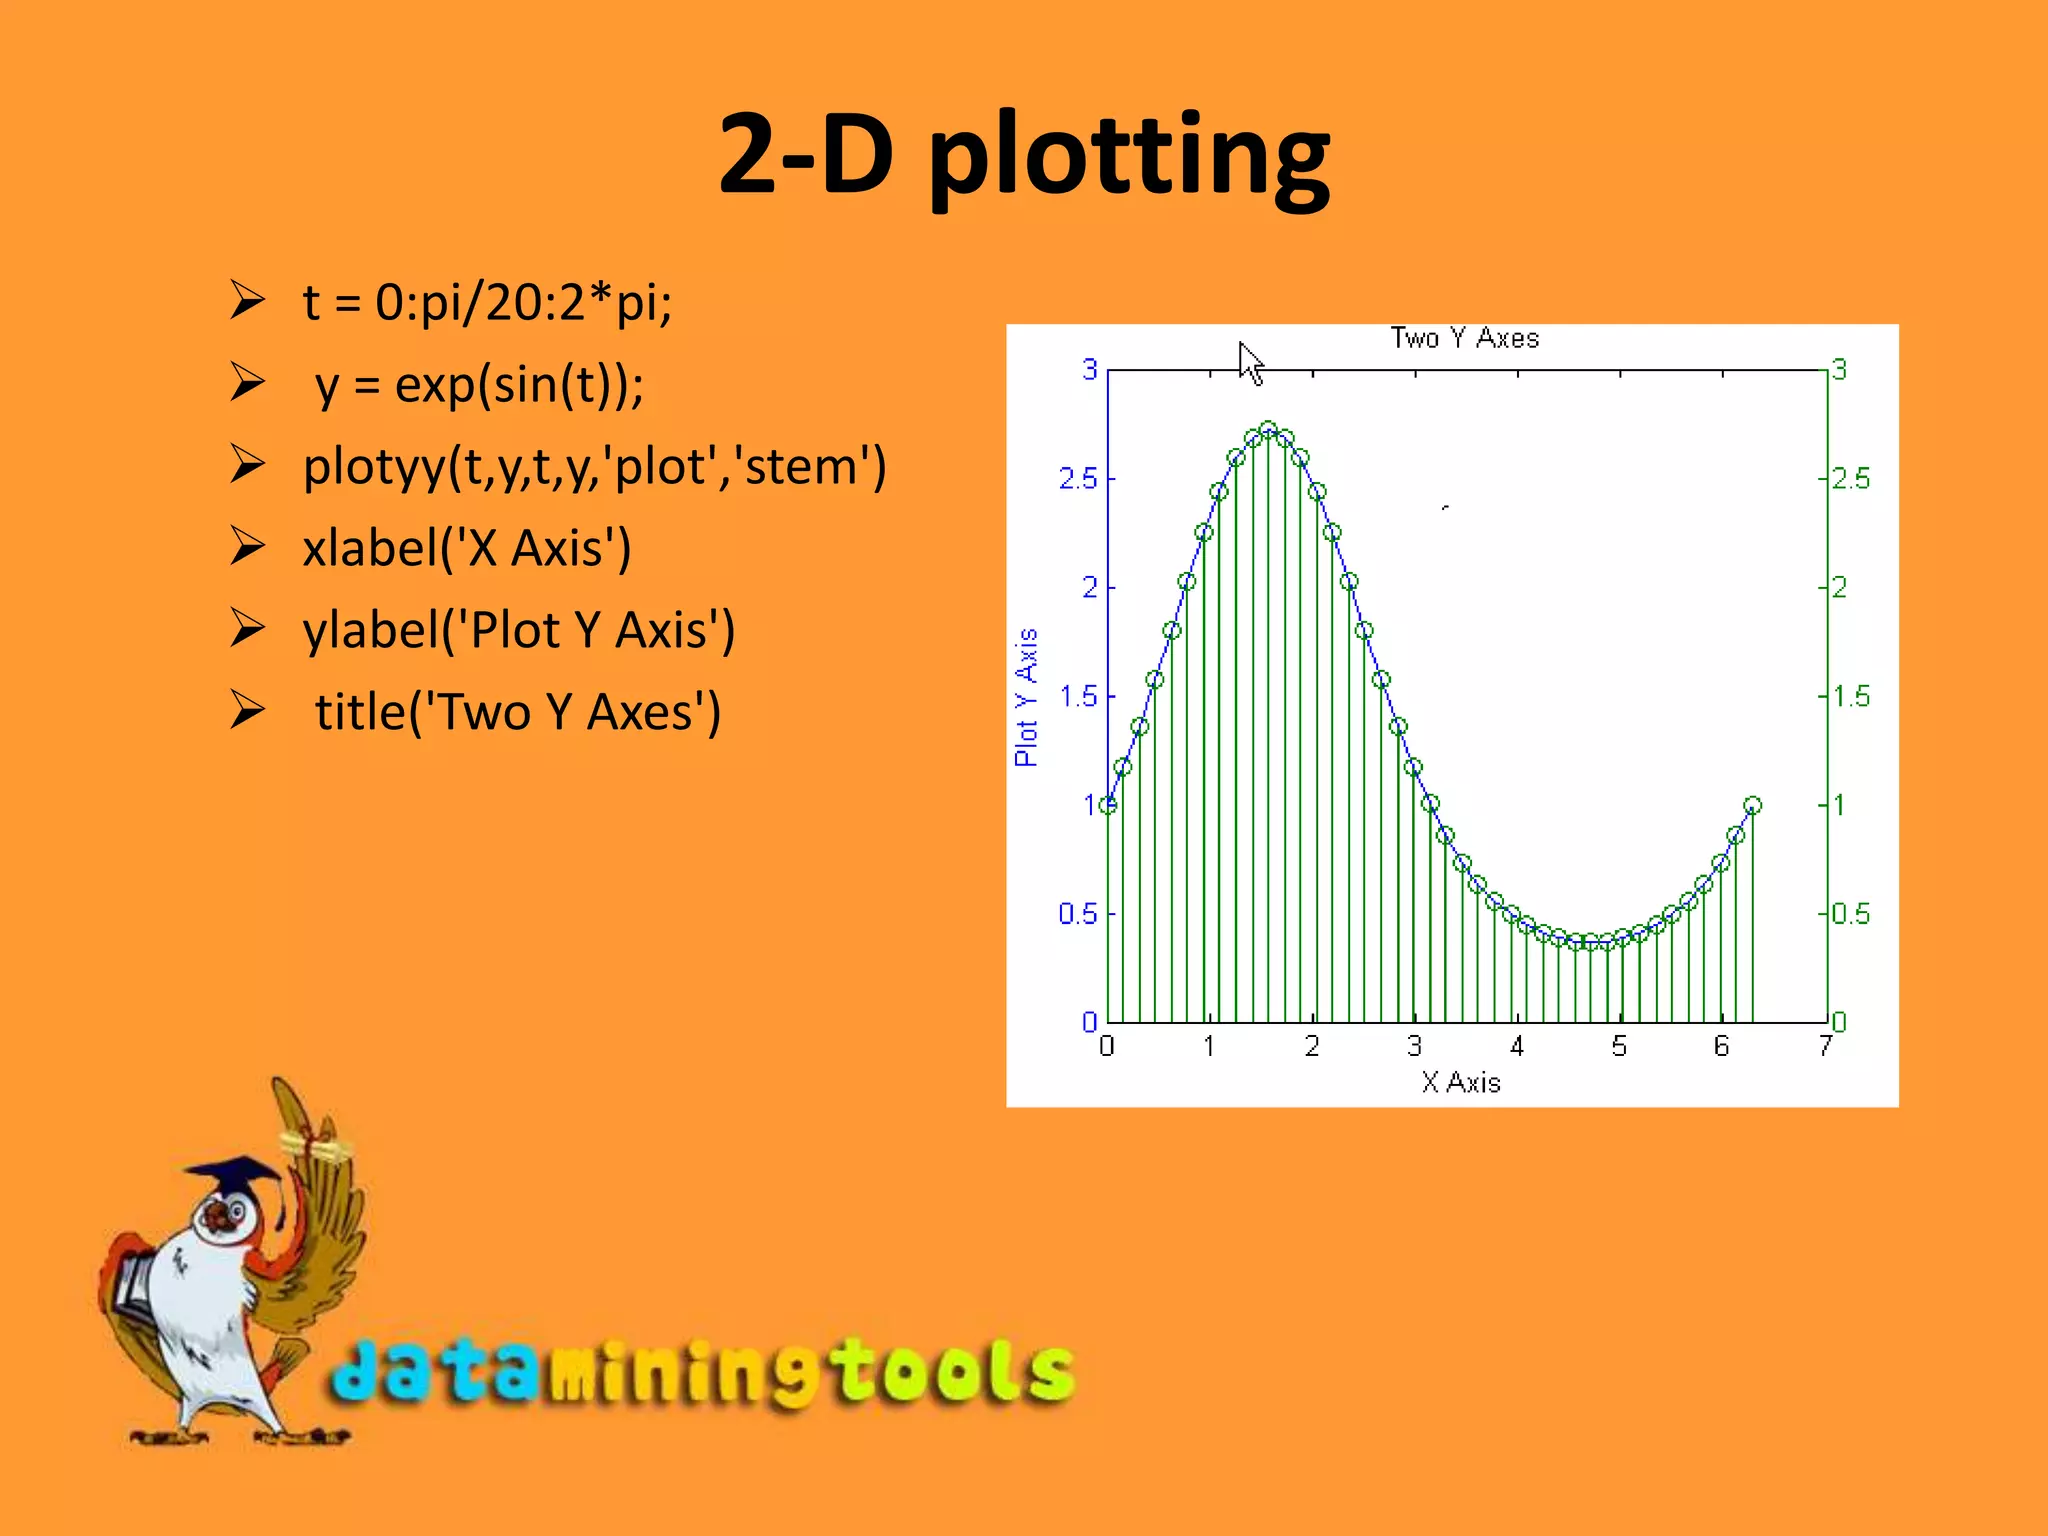
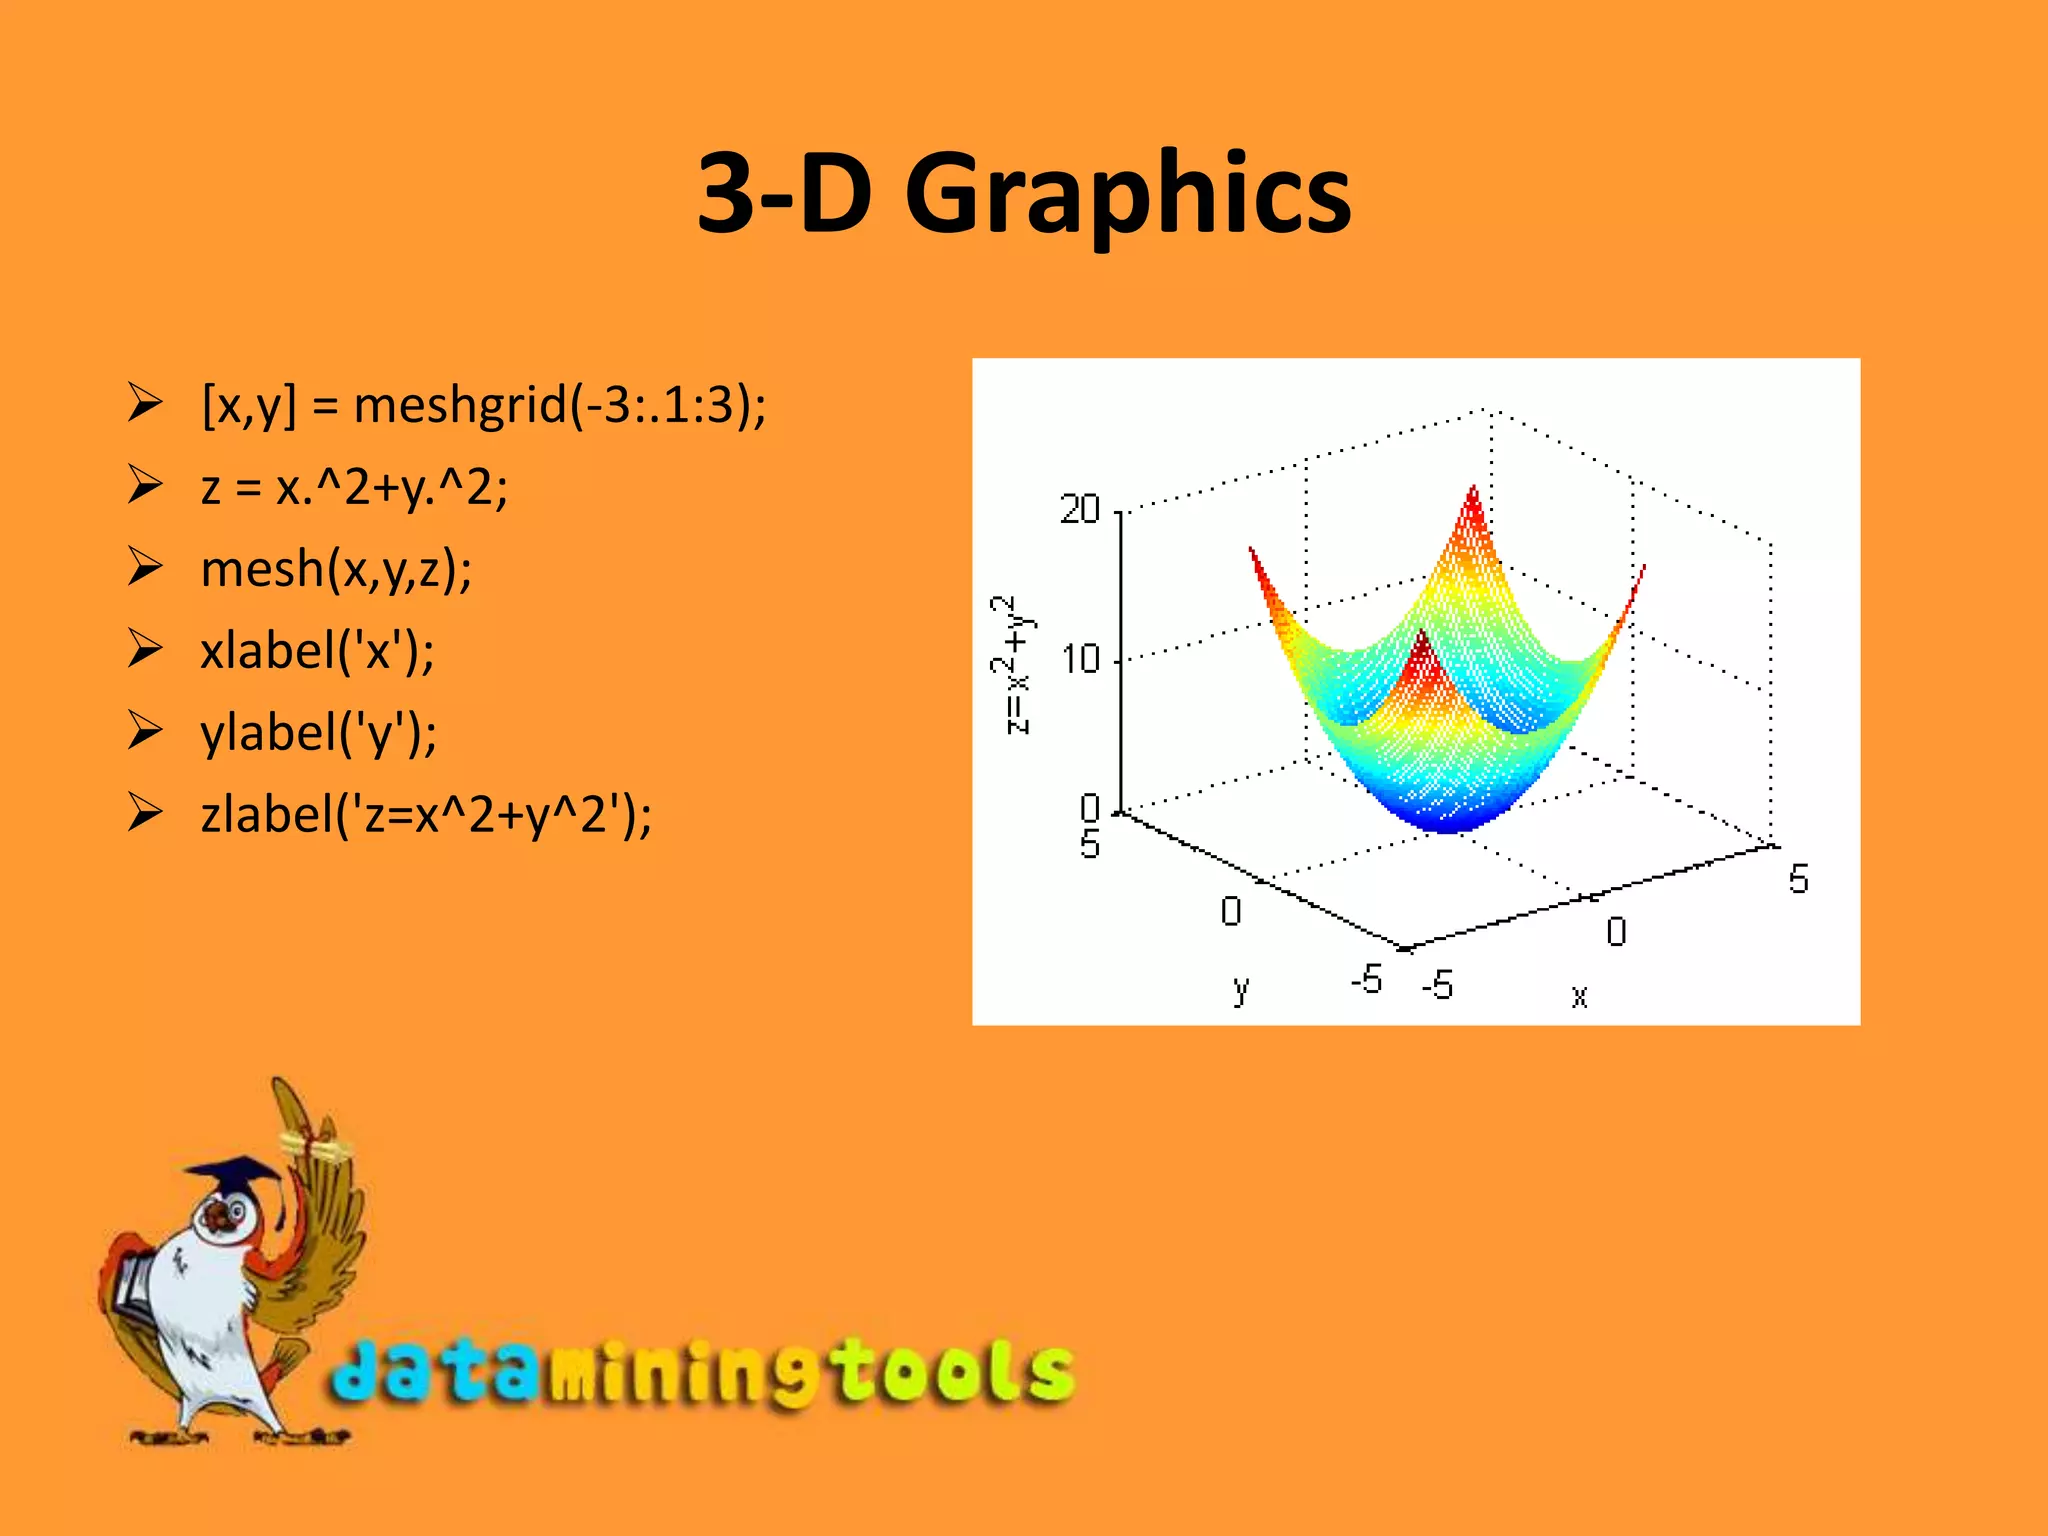


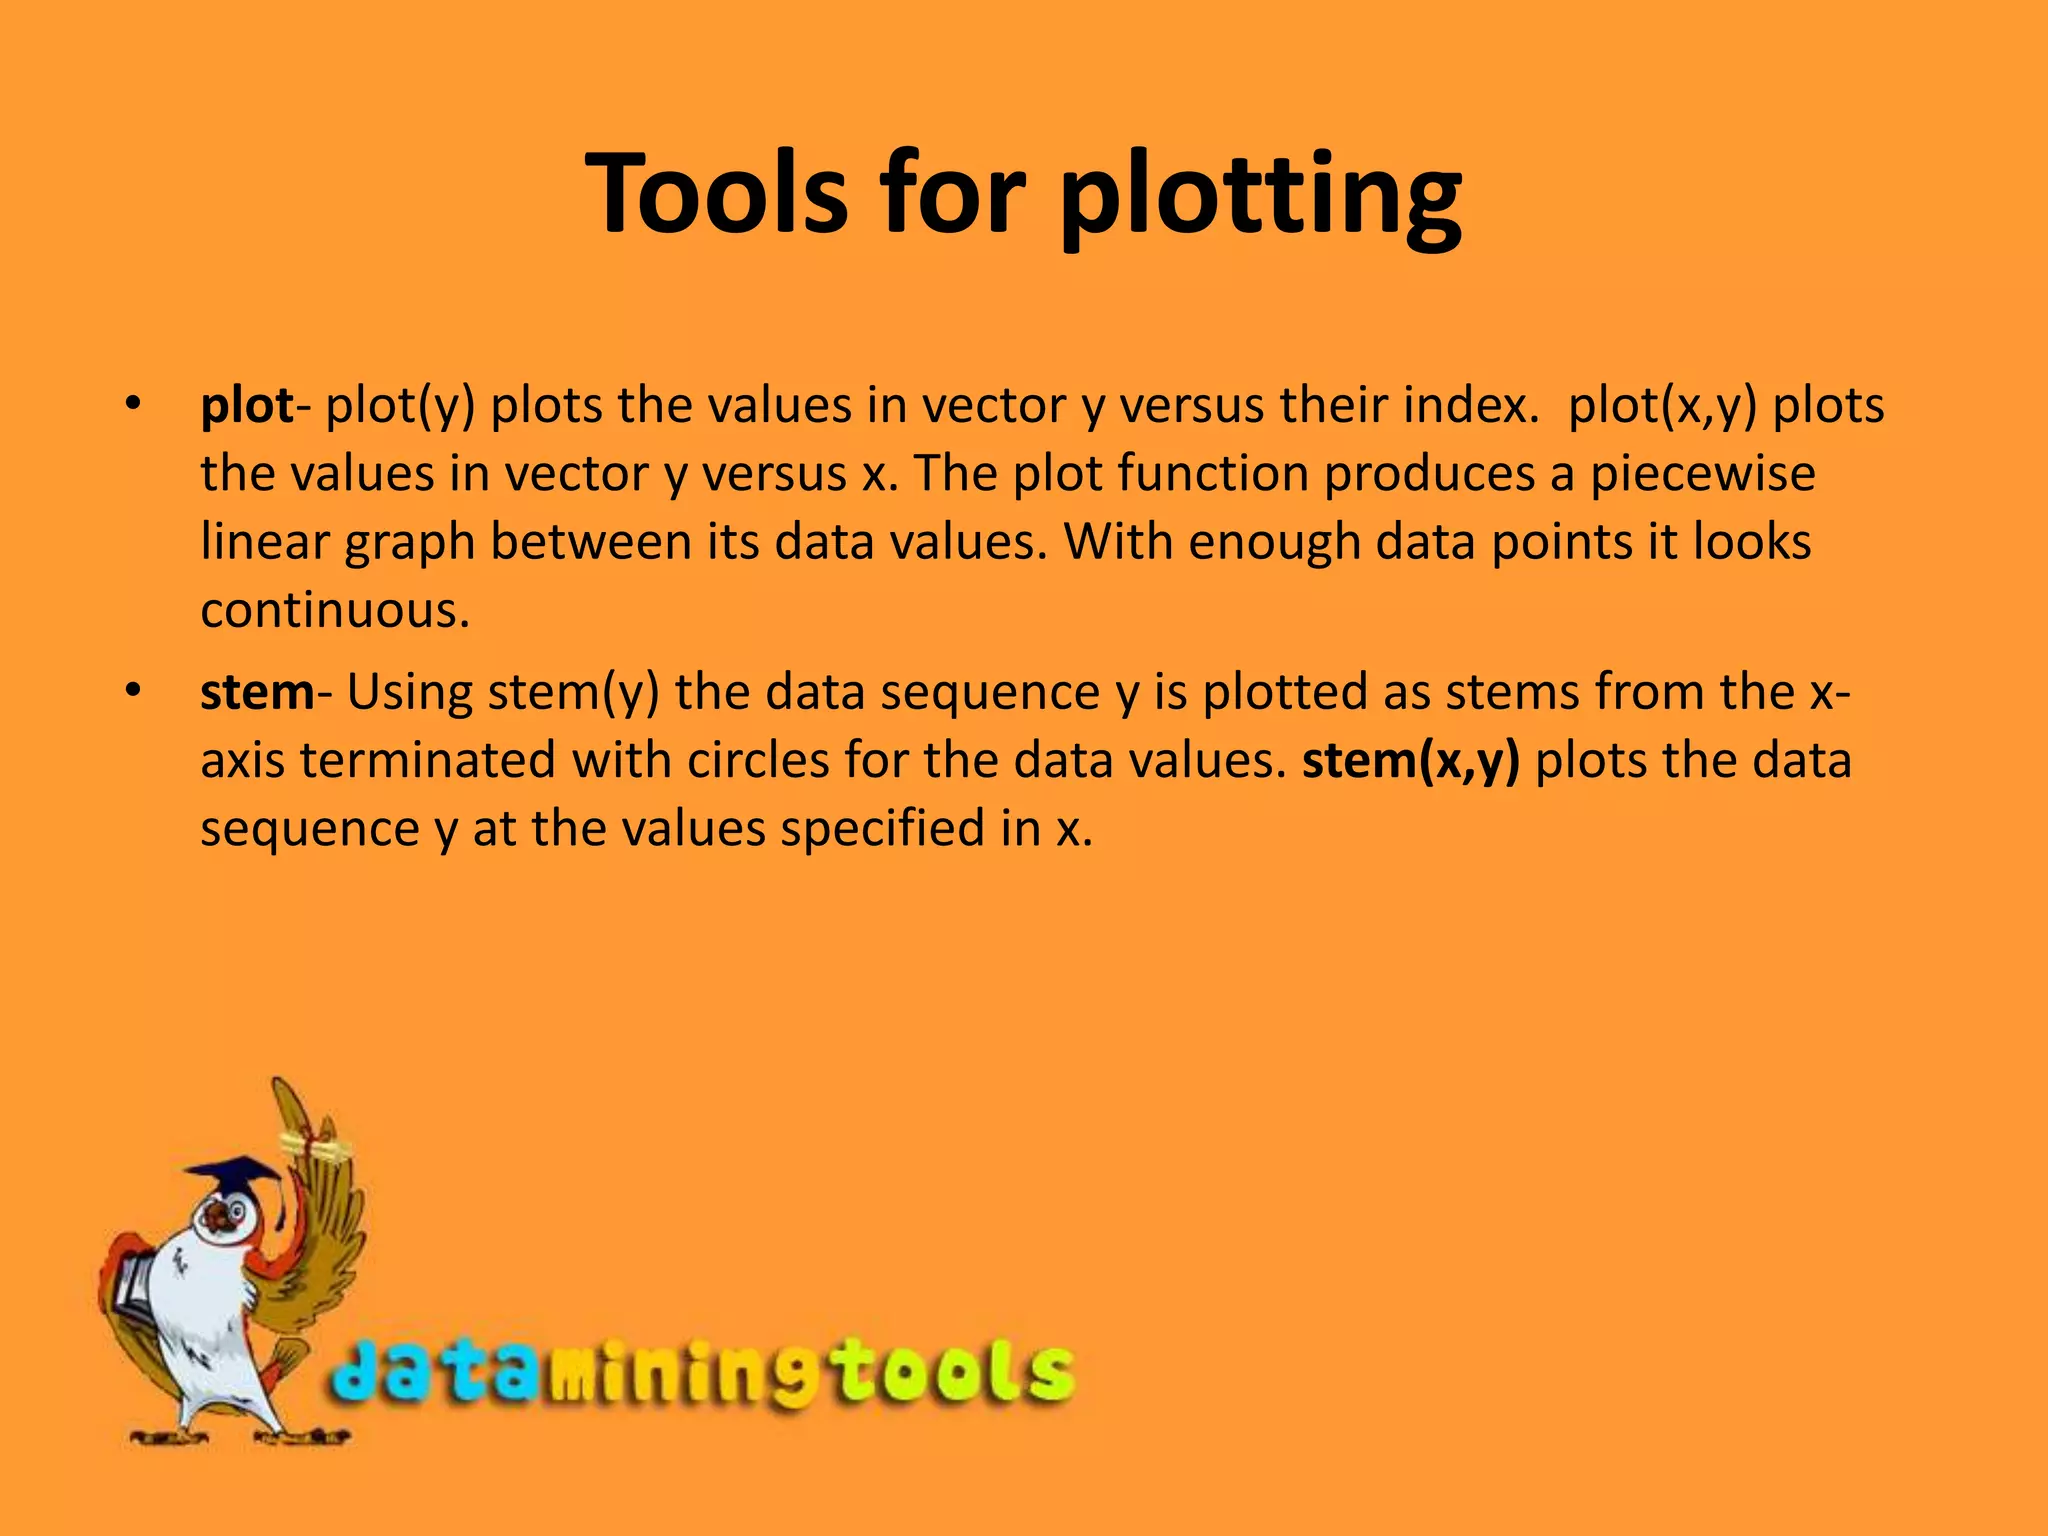
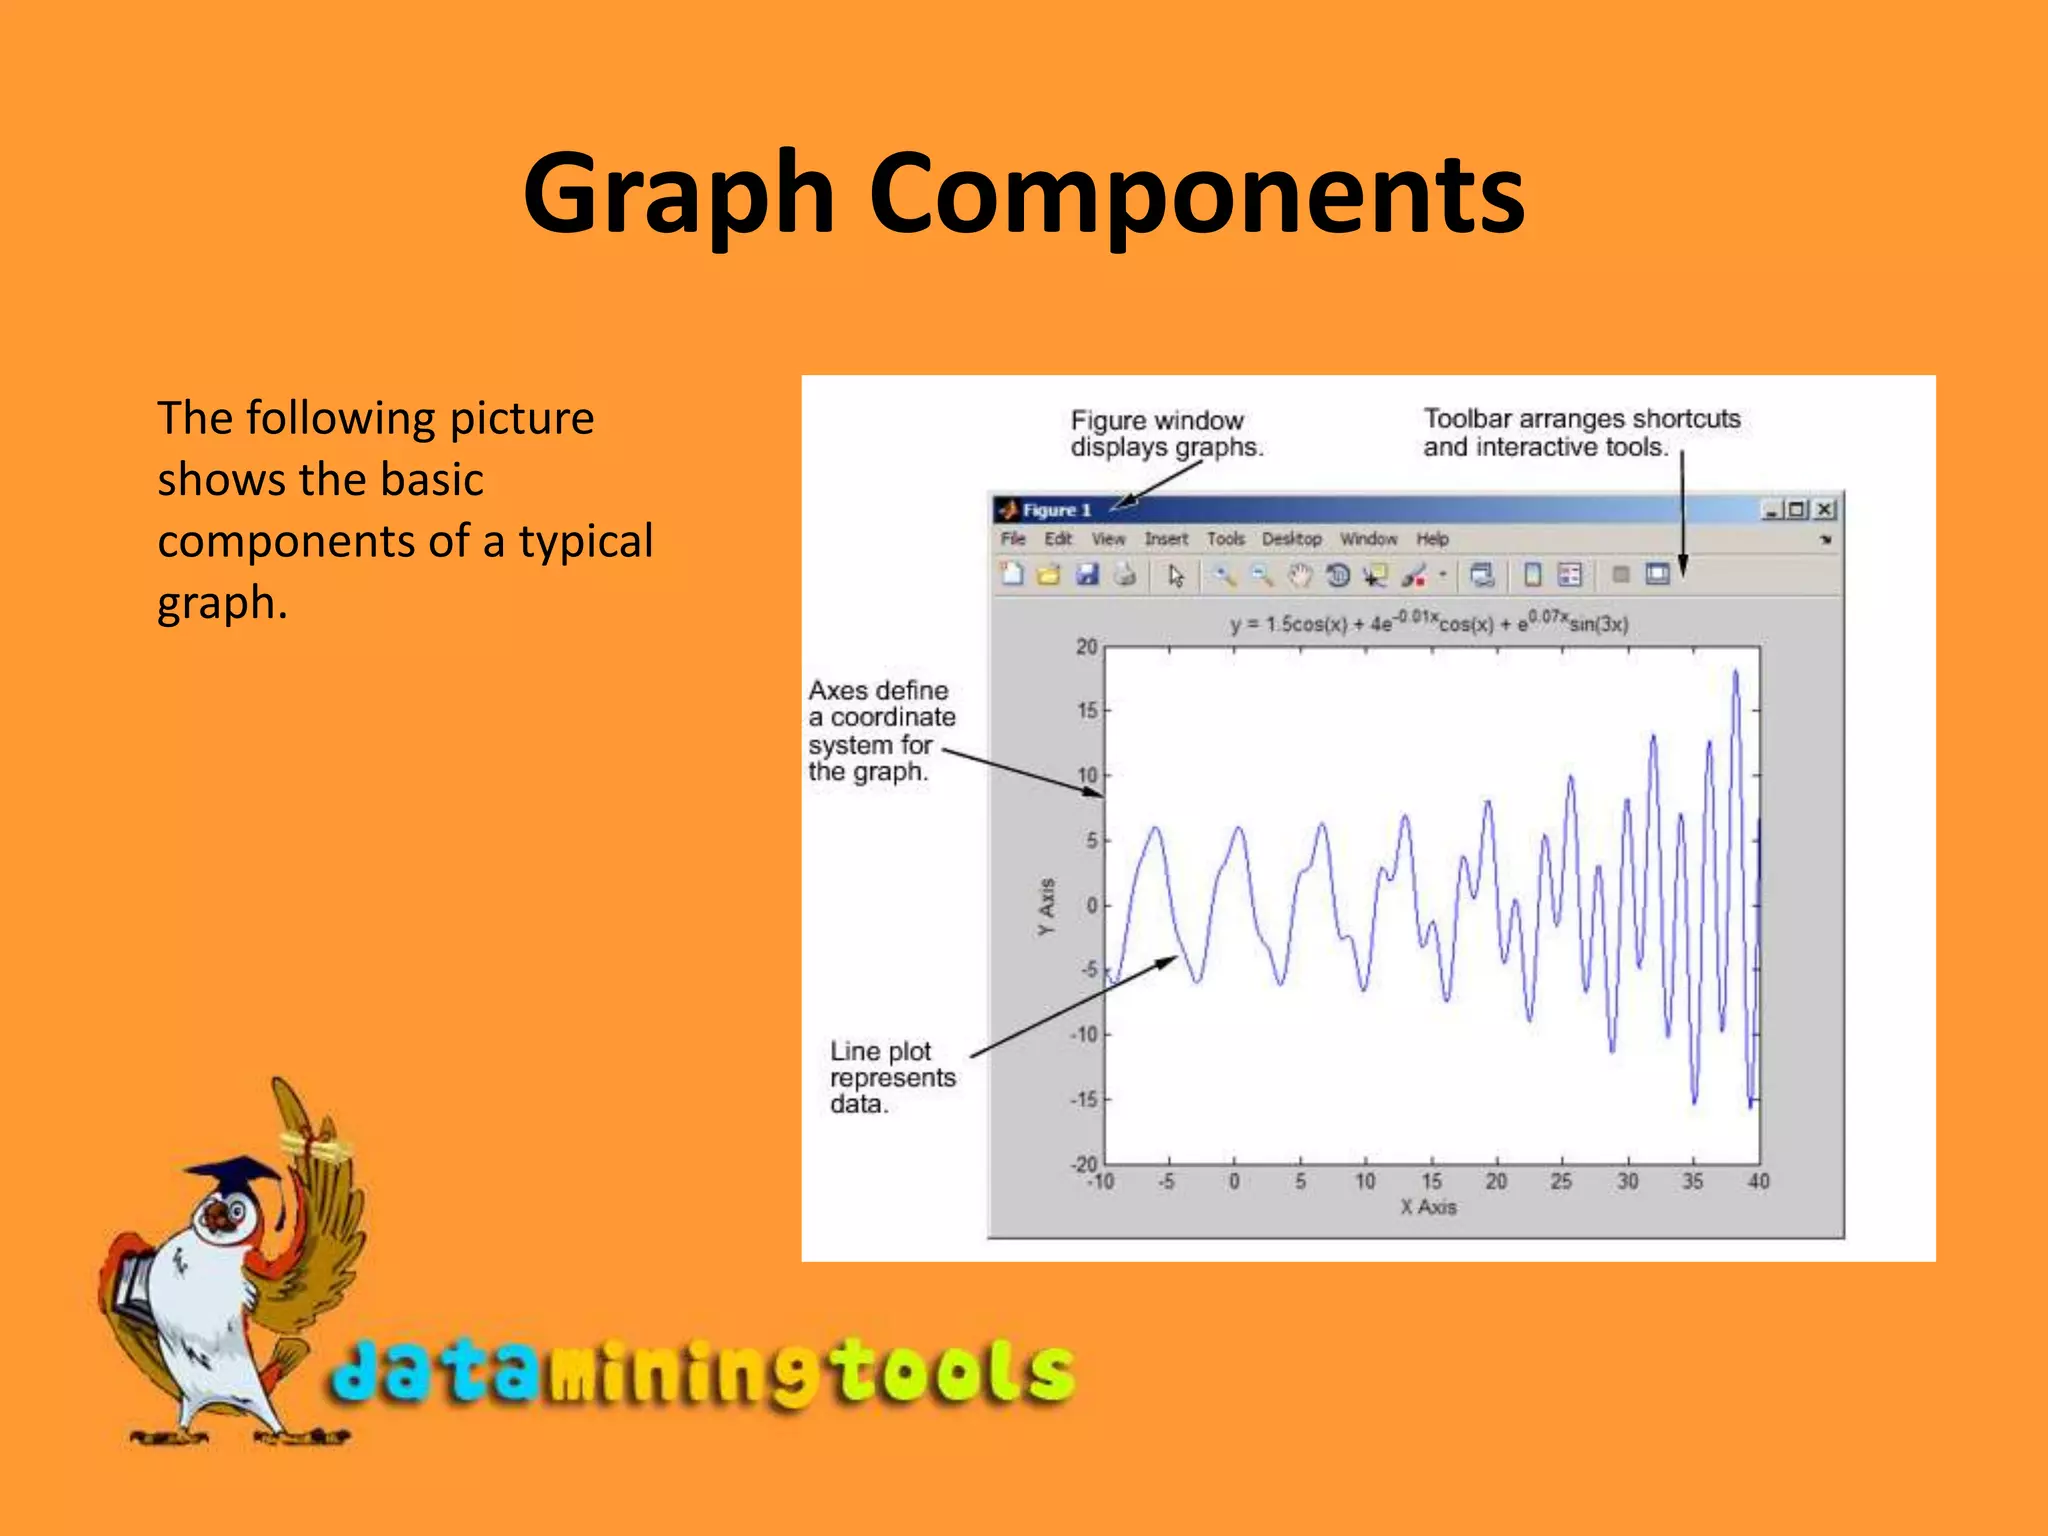
This document discusses various plotting tools in Matlab, including: - The plot and stem functions for plotting data values against their index or specified x-values. - Tools for labeling axes, titles, legends, and setting axis properties. - The subplot function for dividing the figure window into multiple plots. - Functions for turning the grid on/off and holding plots. - Examples of simple 2D and 3D function plots.