SlideShare a Scribd company logo
Probability and Statistics
 Statistical Methods – are the mathematic techniques used
to facilitate the interpretation of numerical data secured
from entities, individuals or observations.
 Statistic – used to denote a particular measure or formula
such as an average, an index number or a coefficient of
correlation.
 Descriptive – methods concerned with the collection,
description, and analysis of a set of data using only the
information gathered from a subset of this larger set.
 Inferential – make use of generalizations, predictions,
estimations, or more generally decisions in the face of
uncertainty.
Basic Statistical Concepts
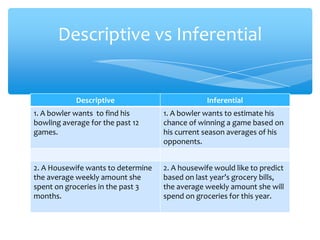
Descriptive Inferential
1. A bowler wants to find his
bowling average for the past 12
games.
1. A bowler wants to estimate his
chance of winning a game based on
his current season averages of his
opponents.
2. A Housewife wants to determine
the average weekly amount she
spent on groceries in the past 3
months.
2. A housewife would like to predict
based on last year’s grocery bills,
the average weekly amount she will
spend on groceries for this year.
Descriptive vs Inferential
 Graphical form
 Samples selected randomly from populations
 Paired Measures
Statistical Techniques
 A Population is a collection of all the elements under
consideration in a statistical study and usually
denoted by a N.
 A Sample is a part or subset of the population from
which the information is collected and is usually
denoted by a n.
Population and Sample
1. We may wish to draw conclusions bout the income
rate of 1000 manufacturing companies by examining
only 200 companies from this population.
2. A manufacturer of kerosene heaters wants to
determine if customers are satisfied with the
performance of their heaters. Toward this goal,
5000 of his 200,000 customers are contacted.
Identify the population and the sample for this
situation.
Example
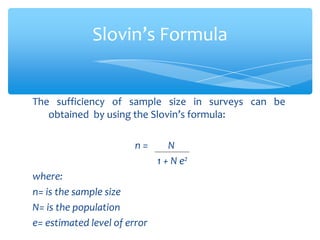
The sufficiency of sample size in surveys can be
obtained by using the Slovin’s formula:
n = N
1 + N e2
where:
n= is the sample size
N= is the population
e= estimated level of error
Slovin’s Formula
1.) A researcher is conducting an investigation regarding
the factors affecting the efficiency of the 185 faculty
members of a certain college. If he wanted to have a
margin of error of 5%, then how many of the faculty
members should be taken as respondents?
Example
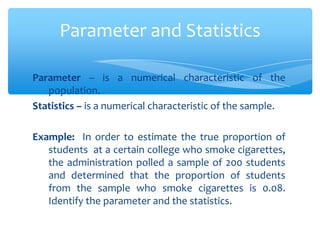
Parameter – is a numerical characteristic of the
population.
Statistics – is a numerical characteristic of the sample.
Example: In order to estimate the true proportion of
students at a certain college who smoke cigarettes,
the administration polled a sample of 200 students
and determined that the proportion of students
from the sample who smoke cigarettes is 0.08.
Identify the parameter and the statistics.
Parameter and Statistics
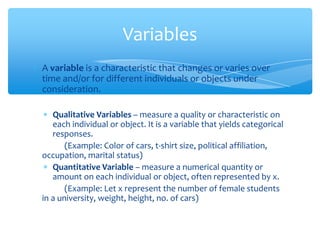
 A variable is a characteristic that changes or varies over
time and/or for different individuals or objects under
consideration.
 Qualitative Variables – measure a quality or characteristic on
each individual or object. It is a variable that yields categorical
responses.
(Example: Color of cars, t-shirt size, political affiliation,
occupation, marital status)
 Quantitative Variable – measure a numerical quantity or
amount on each individual or object, often represented by x.
(Example: Let x represent the number of female students
in a university, weight, height, no. of cars)
Variables
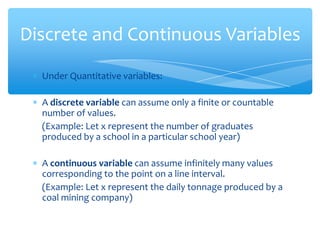
 Under Quantitative variables:
 A discrete variable can assume only a finite or countable
number of values.
(Example: Let x represent the number of graduates
produced by a school in a particular school year)
 A continuous variable can assume infinitely many values
corresponding to the point on a line interval.
(Example: Let x represent the daily tonnage produced by a
coal mining company)
Discrete and Continuous Variables
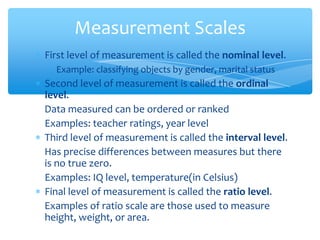
 First level of measurement is called the nominal level.
Example: classifying objects by gender, marital status
 Second level of measurement is called the ordinal
level.
Data measured can be ordered or ranked
Examples: teacher ratings, year level
 Third level of measurement is called the interval level.
Has precise differences between measures but there
is no true zero.
Examples: IQ level, temperature(in Celsius)
 Final level of measurement is called the ratio level.
Examples of ratio scale are those used to measure
height, weight, or area.
Measurement Scales
A. In each of these statements, tell whether
descriptive or inferential statistics have been
used.
1. 6 out of 45 computers in the computer laboratory
are defective.
2. This year, the net income of LEN Company
increased by 20%.
3. In 2010, the sales volume of ABC Company will
increase by 15%
4. Seven out of ten on-the-job injuries are men.
5. The average number of absences of employees in
a company was 14 per year.
Exercise
B. Classify each as nominal level, ordinal level, interval
level, or ratio-level measurement.
1. Pages in your Calculus textbook.
2. Temperatures at Tagaytay.
3. Rankings of basketball teams in the NBA.
4. Times required for a student to finish a quiz.
5. Salaries of the top CEO of SM.
6. Marital status of teachers at Don Bosco.
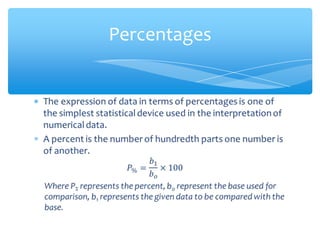
Percentages
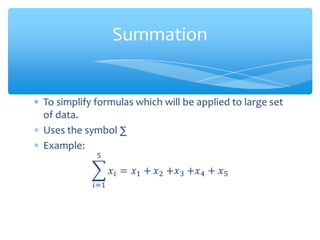
Summation
Properties of Summation
Examples

More Related Content

What's hot

7. the t distribution
7. the t distribution7. the t distribution
7. the t distribution
ONE Virtual Services
 
Kaugnay na pag aaral at literatura
Kaugnay na pag aaral at literaturaKaugnay na pag aaral at literatura
Kaugnay na pag aaral at literatura
Marifer Macalalad Aparato
 
Chapter 1 random variables and probability distributions
Chapter 1   random variables and probability distributionsChapter 1   random variables and probability distributions
Chapter 1 random variables and probability distributions
Antonio F. Balatar Jr.
 
Tekstong Persweysiv o Nanghihikayat
Tekstong Persweysiv  o NanghihikayatTekstong Persweysiv  o Nanghihikayat
Tekstong Persweysiv o Nanghihikayat
maricel panganiban
 
Variance and standard deviation of a discrete random variable
Variance and standard deviation of a discrete random variableVariance and standard deviation of a discrete random variable
Variance and standard deviation of a discrete random variable
ccooking
 
Simbolismo.pptx
Simbolismo.pptxSimbolismo.pptx
Simbolismo.pptx
RioGDavid
 
Ang maka pilipinong pananaliksik
Ang maka pilipinong pananaliksikAng maka pilipinong pananaliksik
Ang maka pilipinong pananaliksik
Edberly Maglangit
 
STATISTICS AND PROBABILITY (TEACHING GUIDE)
STATISTICS AND PROBABILITY (TEACHING GUIDE)STATISTICS AND PROBABILITY (TEACHING GUIDE)
STATISTICS AND PROBABILITY (TEACHING GUIDE)
PRINTDESK by Dan
 
Iba't ibang Teksto sa Pagbasa
Iba't ibang Teksto sa PagbasaIba't ibang Teksto sa Pagbasa
Iba't ibang Teksto sa Pagbasa
Hanna Elise
 
random variable and distribution
random variable and distributionrandom variable and distribution
random variable and distribution
lovemucheca
 
Probability distribution of a random variable module
Probability distribution of a random variable moduleProbability distribution of a random variable module
Probability distribution of a random variable module
Melody01082019
 
Phatic, Emotive at Expressive na Gamit ng Wika
Phatic, Emotive at Expressive na Gamit ng WikaPhatic, Emotive at Expressive na Gamit ng Wika
Phatic, Emotive at Expressive na Gamit ng Wika
Rochelle Nato
 
El Filibusterismo Kabanata 11: Los Banos
El Filibusterismo Kabanata 11: Los BanosEl Filibusterismo Kabanata 11: Los Banos
El Filibusterismo Kabanata 11: Los Banos
Sungwoonie
 
Tekstong deskriptibo - Grade 11
Tekstong deskriptibo - Grade 11Tekstong deskriptibo - Grade 11
Tekstong deskriptibo - Grade 11
Nicole Angelique Pangilinan
 
Statistics and probability lesson 1
Statistics and probability lesson 1Statistics and probability lesson 1
Statistics and probability lesson 1
MARIA CHRISTITA POLINAG
 
Panandang kohesyong gramatikal
Panandang kohesyong gramatikalPanandang kohesyong gramatikal
Panandang kohesyong gramatikalByng Sumague
 
Estimating a Population Proportion
Estimating a Population Proportion  Estimating a Population Proportion
Estimating a Population Proportion
Long Beach City College
 
Point estimate for a population proportion p
Point estimate for a population proportion pPoint estimate for a population proportion p
Point estimate for a population proportion p
Muel Clamor
 

What's hot (20)

7. the t distribution
7. the t distribution7. the t distribution
7. the t distribution
 
Kaugnay na pag aaral at literatura
Kaugnay na pag aaral at literaturaKaugnay na pag aaral at literatura
Kaugnay na pag aaral at literatura
 
Chapter 1 random variables and probability distributions
Chapter 1   random variables and probability distributionsChapter 1   random variables and probability distributions
Chapter 1 random variables and probability distributions
 
Probability and statistics
Probability and statisticsProbability and statistics
Probability and statistics
 
Tekstong Persweysiv o Nanghihikayat
Tekstong Persweysiv  o NanghihikayatTekstong Persweysiv  o Nanghihikayat
Tekstong Persweysiv o Nanghihikayat
 
Variance and standard deviation of a discrete random variable
Variance and standard deviation of a discrete random variableVariance and standard deviation of a discrete random variable
Variance and standard deviation of a discrete random variable
 
Simbolismo.pptx
Simbolismo.pptxSimbolismo.pptx
Simbolismo.pptx
 
Advanced statistics
Advanced statisticsAdvanced statistics
Advanced statistics
 
Ang maka pilipinong pananaliksik
Ang maka pilipinong pananaliksikAng maka pilipinong pananaliksik
Ang maka pilipinong pananaliksik
 
STATISTICS AND PROBABILITY (TEACHING GUIDE)
STATISTICS AND PROBABILITY (TEACHING GUIDE)STATISTICS AND PROBABILITY (TEACHING GUIDE)
STATISTICS AND PROBABILITY (TEACHING GUIDE)
 
Iba't ibang Teksto sa Pagbasa
Iba't ibang Teksto sa PagbasaIba't ibang Teksto sa Pagbasa
Iba't ibang Teksto sa Pagbasa
 
random variable and distribution
random variable and distributionrandom variable and distribution
random variable and distribution
 
Probability distribution of a random variable module
Probability distribution of a random variable moduleProbability distribution of a random variable module
Probability distribution of a random variable module
 
Phatic, Emotive at Expressive na Gamit ng Wika
Phatic, Emotive at Expressive na Gamit ng WikaPhatic, Emotive at Expressive na Gamit ng Wika
Phatic, Emotive at Expressive na Gamit ng Wika
 
El Filibusterismo Kabanata 11: Los Banos
El Filibusterismo Kabanata 11: Los BanosEl Filibusterismo Kabanata 11: Los Banos
El Filibusterismo Kabanata 11: Los Banos
 
Tekstong deskriptibo - Grade 11
Tekstong deskriptibo - Grade 11Tekstong deskriptibo - Grade 11
Tekstong deskriptibo - Grade 11
 
Statistics and probability lesson 1
Statistics and probability lesson 1Statistics and probability lesson 1
Statistics and probability lesson 1
 
Panandang kohesyong gramatikal
Panandang kohesyong gramatikalPanandang kohesyong gramatikal
Panandang kohesyong gramatikal
 
Estimating a Population Proportion
Estimating a Population Proportion  Estimating a Population Proportion
Estimating a Population Proportion
 
Point estimate for a population proportion p
Point estimate for a population proportion pPoint estimate for a population proportion p
Point estimate for a population proportion p
 

Similar to Probability and statistics (basic statistical concepts)

1. week 1
1. week 11. week 1
1. week 1
renz50
 
Introduction-to-Statistics.pptx
Introduction-to-Statistics.pptxIntroduction-to-Statistics.pptx
Introduction-to-Statistics.pptx
AlaaKhazaleh3
 
Statistics for management
Statistics for managementStatistics for management
Statistics for managementVinay Aradhya
 
Statistics final seminar
Statistics final seminarStatistics final seminar
Statistics final seminar
Tejas Jagtap
 
Probability and statistics(assign 7 and 8)
Probability and statistics(assign 7 and 8)Probability and statistics(assign 7 and 8)
Probability and statistics(assign 7 and 8)
Fatima Bianca Gueco
 
Probability and statistics(exercise answers)
Probability and statistics(exercise answers)Probability and statistics(exercise answers)
Probability and statistics(exercise answers)Fatima Bianca Gueco
 
Probability and statistics
Probability and statisticsProbability and statistics
Probability and statisticstrixiacruz
 
Statistics
StatisticsStatistics
Statisticspikuoec
 
Probability in statistics
Probability in statisticsProbability in statistics
Probability in statistics
Sukirti Garg
 
Topic 1 ELEMENTARY STATISTICS.pptx
Topic 1 ELEMENTARY STATISTICS.pptxTopic 1 ELEMENTARY STATISTICS.pptx
Topic 1 ELEMENTARY STATISTICS.pptx
moisespadillacpsu19
 
Session 1 and 2.pptx
Session 1 and 2.pptxSession 1 and 2.pptx
Session 1 and 2.pptx
AkshitMGoel
 
statistics.ppt
statistics.pptstatistics.ppt
statistics.ppt
AthenaYshelleYsit
 
Lecture-1.ppt
Lecture-1.pptLecture-1.ppt
Lecture-1.ppt
AthenaYshelleYsit
 
Lecture 1.ppt
Lecture 1.pptLecture 1.ppt
Lecture 1.ppt
HafizAbdulMannanUnkn
 
Lecture 1.ppt
Lecture 1.pptLecture 1.ppt
Lecture 1.ppt
Vinayak Vishwakarma
 
statistics.pdf
statistics.pdfstatistics.pdf
statistics.pdf
Noname274365
 

Similar to Probability and statistics (basic statistical concepts) (20)

1. week 1
1. week 11. week 1
1. week 1
 
Introduction-to-Statistics.pptx
Introduction-to-Statistics.pptxIntroduction-to-Statistics.pptx
Introduction-to-Statistics.pptx
 
Statistics for management
Statistics for managementStatistics for management
Statistics for management
 
Statistics final seminar
Statistics final seminarStatistics final seminar
Statistics final seminar
 
Probability and statistics(assign 7 and 8)
Probability and statistics(assign 7 and 8)Probability and statistics(assign 7 and 8)
Probability and statistics(assign 7 and 8)
 
New statistics
New statisticsNew statistics
New statistics
 
Probability and statistics(exercise answers)
Probability and statistics(exercise answers)Probability and statistics(exercise answers)
Probability and statistics(exercise answers)
 
Probability and statistics
Probability and statisticsProbability and statistics
Probability and statistics
 
Statistics1(finals)
Statistics1(finals)Statistics1(finals)
Statistics1(finals)
 
Probability and statistics
Probability and statisticsProbability and statistics
Probability and statistics
 
Finals Stat 1
Finals Stat 1Finals Stat 1
Finals Stat 1
 
Statistics
StatisticsStatistics
Statistics
 
Probability in statistics
Probability in statisticsProbability in statistics
Probability in statistics
 
Topic 1 ELEMENTARY STATISTICS.pptx
Topic 1 ELEMENTARY STATISTICS.pptxTopic 1 ELEMENTARY STATISTICS.pptx
Topic 1 ELEMENTARY STATISTICS.pptx
 
Session 1 and 2.pptx
Session 1 and 2.pptxSession 1 and 2.pptx
Session 1 and 2.pptx
 
statistics.ppt
statistics.pptstatistics.ppt
statistics.ppt
 
Lecture-1.ppt
Lecture-1.pptLecture-1.ppt
Lecture-1.ppt
 
Lecture 1.ppt
Lecture 1.pptLecture 1.ppt
Lecture 1.ppt
 
Lecture 1.ppt
Lecture 1.pptLecture 1.ppt
Lecture 1.ppt
 
statistics.pdf
statistics.pdfstatistics.pdf
statistics.pdf
 

More from Don Bosco BSIT

Probability and statistics (frequency distributions)
Probability and statistics (frequency distributions)Probability and statistics (frequency distributions)
Probability and statistics (frequency distributions)Don Bosco BSIT
 
Factors in assembling personal computer
Factors in assembling personal computerFactors in assembling personal computer
Factors in assembling personal computerDon Bosco BSIT
 
Summative Report: 1st Consultative Curriculum Dev Oct. 20-21
Summative Report: 1st Consultative Curriculum Dev Oct. 20-21Summative Report: 1st Consultative Curriculum Dev Oct. 20-21
Summative Report: 1st Consultative Curriculum Dev Oct. 20-21Don Bosco BSIT
 
Data communication basics
Data communication basicsData communication basics
Data communication basicsDon Bosco BSIT
 
Data communication basics
Data communication basicsData communication basics
Data communication basicsDon Bosco BSIT
 
SYSAD323 Virtualization Basics
SYSAD323 Virtualization BasicsSYSAD323 Virtualization Basics
SYSAD323 Virtualization BasicsDon Bosco BSIT
 
Shell Scripting Structured Commands
Shell Scripting Structured CommandsShell Scripting Structured Commands
Shell Scripting Structured CommandsDon Bosco BSIT
 
Jedi Slides Intro2 Chapter12 Advanced Io Streams
Jedi Slides Intro2 Chapter12 Advanced Io StreamsJedi Slides Intro2 Chapter12 Advanced Io Streams
Jedi Slides Intro2 Chapter12 Advanced Io StreamsDon Bosco BSIT
 
V Communication Error Detection And Correction
V  Communication Error Detection And CorrectionV  Communication Error Detection And Correction
V Communication Error Detection And CorrectionDon Bosco BSIT
 
Iv The Telephone And Multiplex Systems
Iv  The Telephone And Multiplex SystemsIv  The Telephone And Multiplex Systems
Iv The Telephone And Multiplex SystemsDon Bosco BSIT
 
Iii Data Transmission Fundamentals
Iii  Data Transmission FundamentalsIii  Data Transmission Fundamentals
Iii Data Transmission FundamentalsDon Bosco BSIT
 
Ii Communications Channel
Ii   Communications ChannelIi   Communications Channel
Ii Communications ChannelDon Bosco BSIT
 
I Introduction To Data Communications
I  Introduction To Data CommunicationsI  Introduction To Data Communications
I Introduction To Data CommunicationsDon Bosco BSIT
 
Secondary Storage Device Magnetic Tapes
Secondary Storage Device  Magnetic TapesSecondary Storage Device  Magnetic Tapes
Secondary Storage Device Magnetic Tapes
Don Bosco BSIT
 
Lecture #1 Introduction
Lecture #1 IntroductionLecture #1 Introduction
Lecture #1 Introduction
Don Bosco BSIT
 
Fundamental File Processing Operations
Fundamental File Processing OperationsFundamental File Processing Operations
Fundamental File Processing Operations
Don Bosco BSIT
 

More from Don Bosco BSIT (20)

Probability and statistics (frequency distributions)
Probability and statistics (frequency distributions)Probability and statistics (frequency distributions)
Probability and statistics (frequency distributions)
 
Factors in assembling personal computer
Factors in assembling personal computerFactors in assembling personal computer
Factors in assembling personal computer
 
Alumni response
Alumni responseAlumni response
Alumni response
 
Summative Report: 1st Consultative Curriculum Dev Oct. 20-21
Summative Report: 1st Consultative Curriculum Dev Oct. 20-21Summative Report: 1st Consultative Curriculum Dev Oct. 20-21
Summative Report: 1st Consultative Curriculum Dev Oct. 20-21
 
8085 op codes
8085 op codes8085 op codes
8085 op codes
 
Data communication basics
Data communication basicsData communication basics
Data communication basics
 
Data communication basics
Data communication basicsData communication basics
Data communication basics
 
Research Primer
Research PrimerResearch Primer
Research Primer
 
Os Virtualization
Os VirtualizationOs Virtualization
Os Virtualization
 
SYSAD323 Virtualization Basics
SYSAD323 Virtualization BasicsSYSAD323 Virtualization Basics
SYSAD323 Virtualization Basics
 
Shell Scripting Structured Commands
Shell Scripting Structured CommandsShell Scripting Structured Commands
Shell Scripting Structured Commands
 
Jedi Slides Intro2 Chapter12 Advanced Io Streams
Jedi Slides Intro2 Chapter12 Advanced Io StreamsJedi Slides Intro2 Chapter12 Advanced Io Streams
Jedi Slides Intro2 Chapter12 Advanced Io Streams
 
V Communication Error Detection And Correction
V  Communication Error Detection And CorrectionV  Communication Error Detection And Correction
V Communication Error Detection And Correction
 
Iv The Telephone And Multiplex Systems
Iv  The Telephone And Multiplex SystemsIv  The Telephone And Multiplex Systems
Iv The Telephone And Multiplex Systems
 
Iii Data Transmission Fundamentals
Iii  Data Transmission FundamentalsIii  Data Transmission Fundamentals
Iii Data Transmission Fundamentals
 
Ii Communications Channel
Ii   Communications ChannelIi   Communications Channel
Ii Communications Channel
 
I Introduction To Data Communications
I  Introduction To Data CommunicationsI  Introduction To Data Communications
I Introduction To Data Communications
 
Secondary Storage Device Magnetic Tapes
Secondary Storage Device  Magnetic TapesSecondary Storage Device  Magnetic Tapes
Secondary Storage Device Magnetic Tapes
 
Lecture #1 Introduction
Lecture #1 IntroductionLecture #1 Introduction
Lecture #1 Introduction
 
Fundamental File Processing Operations
Fundamental File Processing OperationsFundamental File Processing Operations
Fundamental File Processing Operations
 

Probability and statistics (basic statistical concepts)

  • 2.  Statistical Methods – are the mathematic techniques used to facilitate the interpretation of numerical data secured from entities, individuals or observations.  Statistic – used to denote a particular measure or formula such as an average, an index number or a coefficient of correlation.  Descriptive – methods concerned with the collection, description, and analysis of a set of data using only the information gathered from a subset of this larger set.  Inferential – make use of generalizations, predictions, estimations, or more generally decisions in the face of uncertainty. Basic Statistical Concepts
  • 3. Descriptive Inferential 1. A bowler wants to find his bowling average for the past 12 games. 1. A bowler wants to estimate his chance of winning a game based on his current season averages of his opponents. 2. A Housewife wants to determine the average weekly amount she spent on groceries in the past 3 months. 2. A housewife would like to predict based on last year’s grocery bills, the average weekly amount she will spend on groceries for this year. Descriptive vs Inferential
  • 4.  Graphical form  Samples selected randomly from populations  Paired Measures Statistical Techniques
  • 5.  A Population is a collection of all the elements under consideration in a statistical study and usually denoted by a N.  A Sample is a part or subset of the population from which the information is collected and is usually denoted by a n. Population and Sample
  • 6. 1. We may wish to draw conclusions bout the income rate of 1000 manufacturing companies by examining only 200 companies from this population. 2. A manufacturer of kerosene heaters wants to determine if customers are satisfied with the performance of their heaters. Toward this goal, 5000 of his 200,000 customers are contacted. Identify the population and the sample for this situation. Example
  • 7. The sufficiency of sample size in surveys can be obtained by using the Slovin’s formula: n = N 1 + N e2 where: n= is the sample size N= is the population e= estimated level of error Slovin’s Formula
  • 8. 1.) A researcher is conducting an investigation regarding the factors affecting the efficiency of the 185 faculty members of a certain college. If he wanted to have a margin of error of 5%, then how many of the faculty members should be taken as respondents? Example
  • 9. Parameter – is a numerical characteristic of the population. Statistics – is a numerical characteristic of the sample. Example: In order to estimate the true proportion of students at a certain college who smoke cigarettes, the administration polled a sample of 200 students and determined that the proportion of students from the sample who smoke cigarettes is 0.08. Identify the parameter and the statistics. Parameter and Statistics
  • 10.  A variable is a characteristic that changes or varies over time and/or for different individuals or objects under consideration.  Qualitative Variables – measure a quality or characteristic on each individual or object. It is a variable that yields categorical responses. (Example: Color of cars, t-shirt size, political affiliation, occupation, marital status)  Quantitative Variable – measure a numerical quantity or amount on each individual or object, often represented by x. (Example: Let x represent the number of female students in a university, weight, height, no. of cars) Variables
  • 11.  Under Quantitative variables:  A discrete variable can assume only a finite or countable number of values. (Example: Let x represent the number of graduates produced by a school in a particular school year)  A continuous variable can assume infinitely many values corresponding to the point on a line interval. (Example: Let x represent the daily tonnage produced by a coal mining company) Discrete and Continuous Variables
  • 12.  First level of measurement is called the nominal level. Example: classifying objects by gender, marital status  Second level of measurement is called the ordinal level. Data measured can be ordered or ranked Examples: teacher ratings, year level  Third level of measurement is called the interval level. Has precise differences between measures but there is no true zero. Examples: IQ level, temperature(in Celsius)  Final level of measurement is called the ratio level. Examples of ratio scale are those used to measure height, weight, or area. Measurement Scales
  • 13. A. In each of these statements, tell whether descriptive or inferential statistics have been used. 1. 6 out of 45 computers in the computer laboratory are defective. 2. This year, the net income of LEN Company increased by 20%. 3. In 2010, the sales volume of ABC Company will increase by 15% 4. Seven out of ten on-the-job injuries are men. 5. The average number of absences of employees in a company was 14 per year. Exercise
  • 14. B. Classify each as nominal level, ordinal level, interval level, or ratio-level measurement. 1. Pages in your Calculus textbook. 2. Temperatures at Tagaytay. 3. Rankings of basketball teams in the NBA. 4. Times required for a student to finish a quiz. 5. Salaries of the top CEO of SM. 6. Marital status of teachers at Don Bosco.