Downloaded 731 times


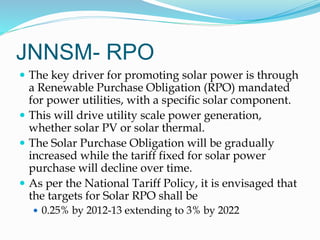
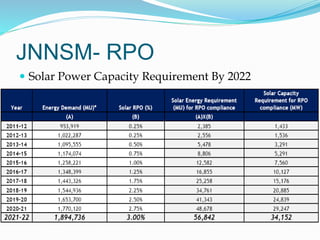


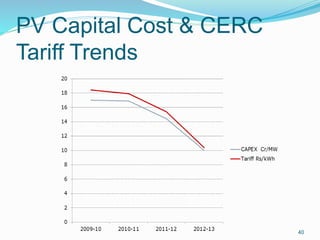
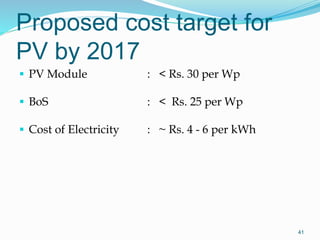
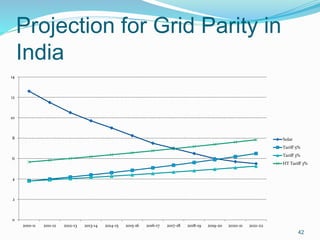


The document provides information about a presentation on solar energy given by M. Nageswar Rao. It discusses various topics related to solar energy including solar radiation resources, solar power technologies, government policies promoting solar power, solar photovoltaics (PV), and solar thermal power. It provides details on NTPC's solar projects in India, insolation levels across India, the working of solar PV cells and factors that affect PV panel performance like tilt, azimuth and tracking systems. It also summarizes the key aspects of India's Jawaharlal Nehru National Solar Mission including targets, policies related to renewable purchase obligation and renewable energy certificates.