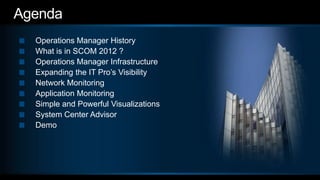
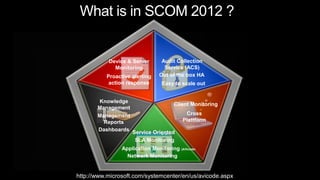
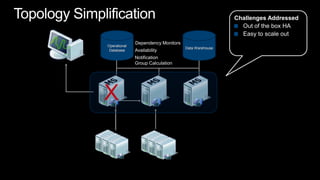
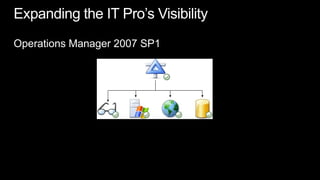
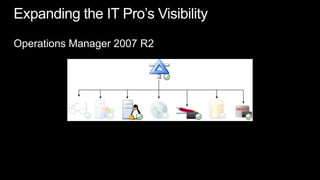
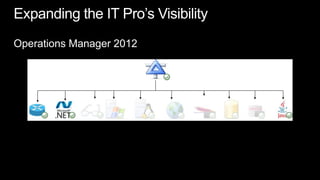
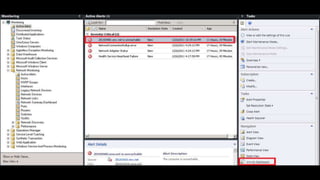
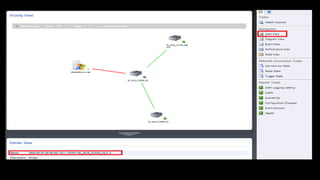
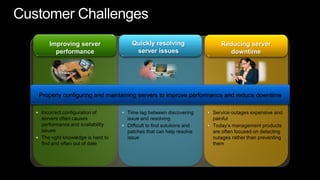
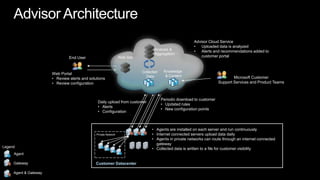
System Center Operations Manager 2012Technical Overview (CTP 2)Amit GatenyoInfrastructure & Security Manager, DarioMicrosoft Regional Director – Windows Server & Security054-2492499Amit.g@dario.co.il2012
AgendaOperations Manager HistoryWhat is in SCOM 2012 ?Operations Manager InfrastructureExpanding the IT Pro’s VisibilityNetwork MonitoringApplication MonitoringSimple and Powerful VisualizationsSystem Center AdvisorDemo
Operations Manager History
Operations Manager20062004200520072009201120102008SCOM 2007R2 – CU1, CU2, CU3, CU4MOM 2005 RTMMOM 2005 SP1SCOM 2007 RTMSCOM 2007 SP1SCOM 2007R2SCOM2012
What is in SCOM 2012 ?
What is in SCOM 2012 ?Audit Collection Service (ACS)Device & ServerMonitoringOut of the box HAProactive alertingaction responseEasy to scale outKnowledge ManagementClient MonitoringCross PlattformManagement ReportsDashboardsService OrientedSLA MonitoringApplication Monitoring (AVIcode)Network Monitoringhttp://www.microsoft.com/systemcenter/en/us/avicode.aspx
 Operations Manager Infrastructure
Disaster Recovery with Operations ManagerOpsMgr 2007 R2Install Operations Manager 2007 from the installation mediaAfter Operations Manager is installed, immediately stop the SDK service to prevent the RMS from sending data to the Operational database. Install any additional hotfixes previously installed with your original installationDelete the Operations Manager database created from your OpsMgr installation in step 1 Restore the latest Operations Manager database created from your SQL backupRestore the RMS encryption keysImport any additional management packs that were loaded to your old management server or changed and backed up after your last Operational database backupInstall the Web consoleStart the SDK service. Operations Manager will now be functionalOpsMgr 2012Install Operations Manager 2012
SCOM 2007 R2 – Deployment TopologyRoot Management ServerProvides the following servicesConsole accessRole based access controlDistribution of configurations to agentsConnectors to other mgmt systemsAlert notificationsHealth aggregationGroup CalculationsAvailabilityDependency MonitorDB GroomingEnables model based mgmtIntroduces the following customer challengesPerformance and scalability bottleneckSingle point of failure (for RMS workloads) High availability requires clustering
What Has Changed in SCOM 2012?SCOM 2012 PlatformR2 PlatformParent child topology with the RMS as the parent and all other mgmt servers as children A simpler peer to peer topology
Server PoolAbility to distribute workloads across multiple Management ServersGroup CalculationAvailabilityDistributed Monitor Health Roll upDB GroomingNotificationAll Management Servers Pool
Management Server Changes
Topology SimplificationChallenges AddressedOut of the box HAEasy to scale outOperational DatabaseData WarehouseDependency MonitorsAvailabilityNotificationGroup CalculationX
Server PoolOperational DatabaseData WarehouseXManaged by PoolManaged by a single HS
Expanding the IT Pro’s Visibility
Simple dashboards enable 360 view in a single toolReliable information enables easy reconciliation of internal monitoring with end user experiencePersonalized views provides relevant informationConsistent views across multiple interfacesIT Pro VisibilityReduced TCO of Management InfraMTTRHolistic view of Application HealthSimple and Powerful Visualizations decreasing time to value
Expanding the IT Pro’s VisibilityOperations Manager 2007 SP1
Expanding the IT Pro’s VisibilityOperations Manager 2007 R2
Expanding the IT Pro’s VisibilityOperations Manager 2012
Network Monitoring
360 is a function of monitoring that gives customers visibility to the underlying application environment(s) or infrastructureConsistent UX(Console, Web, SharePoint) End User Experience(Synthetic Transactions)ImprovedCIOApplication Monitoring(.NET, J2E)NewService OwnerInfrastructure Monitoring(OS, SQL, IIS)Infrastructure Monitoring(Network)NewInfra Owner360 – Holistic View of Health
Network Monitoring FeaturesOut of the box discovery, monitoring, and reportingServer to network dependency discoveryMulti-vendor support > 90 at RTMMulti protocol supportSNMPv1/v2c/v3IPv4 and IPv6Robust platform for partners to build on
Network DiscoveryDiscovery is the process of identifying network devices to be monitored
Network Discovery – What’s DiscoveredConnectivityVLAN membershipHSRP groupsStitching of switch ports to server NICsKey components of a devicePort/InterfaceProcessorMemory
Network Monitoring – What’s MonitoredPort/Interface Up/Down (operational & admin status)Volumes of inbound/outbound traffic% UtilizationDrop & Broadcast ratesProcessor% UtilizationMemoryIn depth memory counters (Cisco Only)Free memory
Network Monitoring – What’s MonitoredConnection HealthBased on looking at both ends of a connectionVLAN Health Based on health state of switches in VLANHSRP GroupBased on health state of individual HSRP end points
Network Monitoring – Additional DetailsSupport Resource Pools for High Availability MonitoringOnly certain ports will be monitored by defaultPorts connecting two network devices to each otherPorts to which managed server is connected User can enable monitoring for other ports if above is not sufficient
Vicinity Dashboard
Holistic View of App Health (Network Infra)Vicinity Dashboard showing contextual Network MapSummary Dashboard of Network DevicesSee Network Device Details and Health
 Application Monitoring
360 is a function of monitoring that gives customers visibility to the underlying application environment(s) or infrastructureConsistent UX(Console, Web, SharePoint) End User Experience(Synthetic Transactions)ImprovedCIOApplication Monitoring(.NET, J2E)NewService OwnerInfrastructure Monitoring(OS, SQL, IIS)Infrastructure Monitoring(Network)NewInfra Owner360 – Holistic View of Health
J2E in SCOM 2012Supported Platforms in SCOM 2012:Operating SystemsWindows only Java EE Application ServersWebSphere 6.1 & 7.0WebLogic 10gRel3 & 11gRel1 JBOSS 4.2 & 5.1 (JVM 1.5+), JBOSS 6 (TBD)Tomcat 5.5 & 6.0 (JVM 1.5+), Tomcat 7 (TBD)
Java EE Monitoring OverviewJEE Application Servers Automatic discoveryAvailability monitoringPerformance MonitoringMemoryGarbage CollectionThreadsClass LoaderJIT CompilerJEE ApplicationsAutomatic discoveryApplication module discoveryAvailability monitoringTemplate based custom monitoring
Holistic View of App Health (App Monitoring)Out of box App Discovery and MonitoringEasy to understand Application failures via Resource ViewUseful Dev information for efficient escalationIncreased time to value without custom MP authoring
Simple and Powerful Visualizations
Simple creation and customization of Dashboards through Templates and WidgetsPersonalized Dashboards enable increased service owner efficiency and troubleshootingConsistent views across all consoles enable users to see and share Dashboards with various owners (Infra, Service, and Managers)IT Pro VisibilityReduced TCO of Management InfraMTTRHolistic view of Application HealthSimple and Powerful Visualizations decreasing time to value
DashboardsScreenshotsdemo
Consistent Experience – Desktop Console
Consistent Experience – Web ConsoleDesktop Console
Consistent Experience – SharePointDesktop ConsoleWeb Console
 System Center Advisor
Customer ChallengesQuickly resolving server issuesImproving server performanceReducing server downtimeProperly configuring and maintaining servers to improve performance and reduce downtimeIncorrect configuration of servers often causes performance and availability issuesThe right knowledge is hard to find and often out of dateTime lag between discovering issue and resolving Difficult to find solutions and patches that can help resolve issueService outages expensive and painfulToday’s management products are often focused on detecting outages rather than preventing them
Advisor ArchitectureAdvisor Cloud ServiceUploaded data is analyzed
Alerts and recommendations added to customer portalAnalysis & AggregationWeb SiteEnd UserKnowledge & ContentCollected DataWeb PortalReview alerts and solutions
Review configurationMicrosoft Customer Support Services and Product TeamsPeriodic download to customerUpdated rules

System Center Operations Manager 2012 Overview

  • 1.
    System Center OperationsManager 2012Technical Overview (CTP 2)Amit GatenyoInfrastructure & Security Manager, DarioMicrosoft Regional Director – Windows Server & Security054-2492499Amit.g@dario.co.il2012
  • 2.
    AgendaOperations Manager HistoryWhatis in SCOM 2012 ?Operations Manager InfrastructureExpanding the IT Pro’s VisibilityNetwork MonitoringApplication MonitoringSimple and Powerful VisualizationsSystem Center AdvisorDemo
  • 3.
  • 4.
    Operations Manager20062004200520072009201120102008SCOM 2007R2– CU1, CU2, CU3, CU4MOM 2005 RTMMOM 2005 SP1SCOM 2007 RTMSCOM 2007 SP1SCOM 2007R2SCOM2012
  • 5.
    What is inSCOM 2012 ?
  • 6.
    What is inSCOM 2012 ?Audit Collection Service (ACS)Device & ServerMonitoringOut of the box HAProactive alertingaction responseEasy to scale outKnowledge ManagementClient MonitoringCross PlattformManagement ReportsDashboardsService OrientedSLA MonitoringApplication Monitoring (AVIcode)Network Monitoringhttp://www.microsoft.com/systemcenter/en/us/avicode.aspx
  • 7.
    Operations ManagerInfrastructure
  • 8.
    Disaster Recovery withOperations ManagerOpsMgr 2007 R2Install Operations Manager 2007 from the installation mediaAfter Operations Manager is installed, immediately stop the SDK service to prevent the RMS from sending data to the Operational database. Install any additional hotfixes previously installed with your original installationDelete the Operations Manager database created from your OpsMgr installation in step 1 Restore the latest Operations Manager database created from your SQL backupRestore the RMS encryption keysImport any additional management packs that were loaded to your old management server or changed and backed up after your last Operational database backupInstall the Web consoleStart the SDK service. Operations Manager will now be functionalOpsMgr 2012Install Operations Manager 2012
  • 9.
    SCOM 2007 R2– Deployment TopologyRoot Management ServerProvides the following servicesConsole accessRole based access controlDistribution of configurations to agentsConnectors to other mgmt systemsAlert notificationsHealth aggregationGroup CalculationsAvailabilityDependency MonitorDB GroomingEnables model based mgmtIntroduces the following customer challengesPerformance and scalability bottleneckSingle point of failure (for RMS workloads) High availability requires clustering
  • 10.
    What Has Changedin SCOM 2012?SCOM 2012 PlatformR2 PlatformParent child topology with the RMS as the parent and all other mgmt servers as children A simpler peer to peer topology
  • 11.
    Server PoolAbility todistribute workloads across multiple Management ServersGroup CalculationAvailabilityDistributed Monitor Health Roll upDB GroomingNotificationAll Management Servers Pool
  • 12.
  • 13.
    Topology SimplificationChallenges AddressedOutof the box HAEasy to scale outOperational DatabaseData WarehouseDependency MonitorsAvailabilityNotificationGroup CalculationX
  • 14.
    Server PoolOperational DatabaseDataWarehouseXManaged by PoolManaged by a single HS
  • 15.
    Expanding the ITPro’s Visibility
  • 16.
    Simple dashboards enable360 view in a single toolReliable information enables easy reconciliation of internal monitoring with end user experiencePersonalized views provides relevant informationConsistent views across multiple interfacesIT Pro VisibilityReduced TCO of Management InfraMTTRHolistic view of Application HealthSimple and Powerful Visualizations decreasing time to value
  • 17.
    Expanding the ITPro’s VisibilityOperations Manager 2007 SP1
  • 18.
    Expanding the ITPro’s VisibilityOperations Manager 2007 R2
  • 19.
    Expanding the ITPro’s VisibilityOperations Manager 2012
  • 20.
  • 21.
    360 is afunction of monitoring that gives customers visibility to the underlying application environment(s) or infrastructureConsistent UX(Console, Web, SharePoint) End User Experience(Synthetic Transactions)ImprovedCIOApplication Monitoring(.NET, J2E)NewService OwnerInfrastructure Monitoring(OS, SQL, IIS)Infrastructure Monitoring(Network)NewInfra Owner360 – Holistic View of Health
  • 22.
    Network Monitoring FeaturesOutof the box discovery, monitoring, and reportingServer to network dependency discoveryMulti-vendor support > 90 at RTMMulti protocol supportSNMPv1/v2c/v3IPv4 and IPv6Robust platform for partners to build on
  • 23.
    Network DiscoveryDiscovery isthe process of identifying network devices to be monitored
  • 24.
    Network Discovery –What’s DiscoveredConnectivityVLAN membershipHSRP groupsStitching of switch ports to server NICsKey components of a devicePort/InterfaceProcessorMemory
  • 25.
    Network Monitoring –What’s MonitoredPort/Interface Up/Down (operational & admin status)Volumes of inbound/outbound traffic% UtilizationDrop & Broadcast ratesProcessor% UtilizationMemoryIn depth memory counters (Cisco Only)Free memory
  • 26.
    Network Monitoring –What’s MonitoredConnection HealthBased on looking at both ends of a connectionVLAN Health Based on health state of switches in VLANHSRP GroupBased on health state of individual HSRP end points
  • 27.
    Network Monitoring –Additional DetailsSupport Resource Pools for High Availability MonitoringOnly certain ports will be monitored by defaultPorts connecting two network devices to each otherPorts to which managed server is connected User can enable monitoring for other ports if above is not sufficient
  • 28.
  • 29.
    Holistic View ofApp Health (Network Infra)Vicinity Dashboard showing contextual Network MapSummary Dashboard of Network DevicesSee Network Device Details and Health
  • 32.
  • 33.
    360 is afunction of monitoring that gives customers visibility to the underlying application environment(s) or infrastructureConsistent UX(Console, Web, SharePoint) End User Experience(Synthetic Transactions)ImprovedCIOApplication Monitoring(.NET, J2E)NewService OwnerInfrastructure Monitoring(OS, SQL, IIS)Infrastructure Monitoring(Network)NewInfra Owner360 – Holistic View of Health
  • 34.
    J2E in SCOM2012Supported Platforms in SCOM 2012:Operating SystemsWindows only Java EE Application ServersWebSphere 6.1 & 7.0WebLogic 10gRel3 & 11gRel1 JBOSS 4.2 & 5.1 (JVM 1.5+), JBOSS 6 (TBD)Tomcat 5.5 & 6.0 (JVM 1.5+), Tomcat 7 (TBD)
  • 35.
    Java EE MonitoringOverviewJEE Application Servers Automatic discoveryAvailability monitoringPerformance MonitoringMemoryGarbage CollectionThreadsClass LoaderJIT CompilerJEE ApplicationsAutomatic discoveryApplication module discoveryAvailability monitoringTemplate based custom monitoring
  • 36.
    Holistic View ofApp Health (App Monitoring)Out of box App Discovery and MonitoringEasy to understand Application failures via Resource ViewUseful Dev information for efficient escalationIncreased time to value without custom MP authoring
  • 37.
    Simple and PowerfulVisualizations
  • 38.
    Simple creation andcustomization of Dashboards through Templates and WidgetsPersonalized Dashboards enable increased service owner efficiency and troubleshootingConsistent views across all consoles enable users to see and share Dashboards with various owners (Infra, Service, and Managers)IT Pro VisibilityReduced TCO of Management InfraMTTRHolistic view of Application HealthSimple and Powerful Visualizations decreasing time to value
  • 39.
  • 40.
  • 41.
    Consistent Experience –Web ConsoleDesktop Console
  • 42.
    Consistent Experience –SharePointDesktop ConsoleWeb Console
  • 44.
  • 45.
    Customer ChallengesQuickly resolvingserver issuesImproving server performanceReducing server downtimeProperly configuring and maintaining servers to improve performance and reduce downtimeIncorrect configuration of servers often causes performance and availability issuesThe right knowledge is hard to find and often out of dateTime lag between discovering issue and resolving Difficult to find solutions and patches that can help resolve issueService outages expensive and painfulToday’s management products are often focused on detecting outages rather than preventing them
  • 46.
    Advisor ArchitectureAdvisor CloudServiceUploaded data is analyzed
  • 47.
    Alerts and recommendationsadded to customer portalAnalysis & AggregationWeb SiteEnd UserKnowledge & ContentCollected DataWeb PortalReview alerts and solutions
  • 48.
    Review configurationMicrosoft CustomerSupport Services and Product TeamsPeriodic download to customerUpdated rules
  • 49.
    New configuration pointsDailyupload from customerAlerts
  • 50.
  • 51.
    Agents are installedon each server and run continuously
  • 52.
  • 53.
    Agents in privatenetworks can route through an internet connected gateway
  • 54.
    Collected data iswritten to a file for customer visibilityPrivate NetworkLegendAgentGatewayCustomer Datacenter Agent & Gateway
  • 55.
    Roadmap and LicensingBetaRelease in Nov 2010SQL Server contentRC release in March 2011http://www.SystemCenterAdvisor.comAvailable to all customers in US*Additional SQL content & Windows Server contentRTW release is TBDTarget: H2 CY11Available as a benefit of Software Assurance for supported server workloads* Additional market support to be announced later in CY11
  • 56.
    System Center OperationsManager 2012Technical Overview (CTP 2)Amit GatenyoInfrastructure & Security Manager, DarioMicrosoft Regional Director – Windows Server & Security054-2492499Amit.g@dario.co.il2012