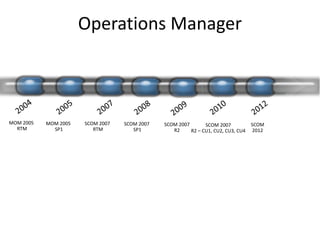
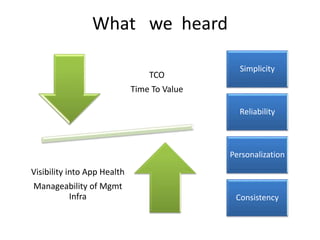
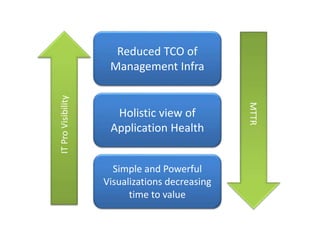
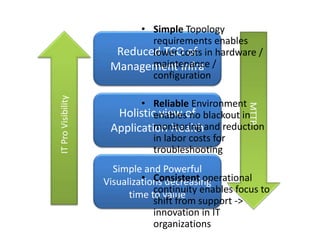
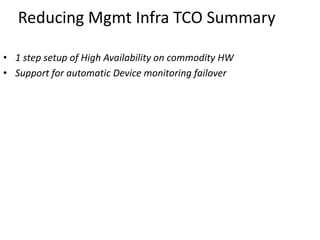
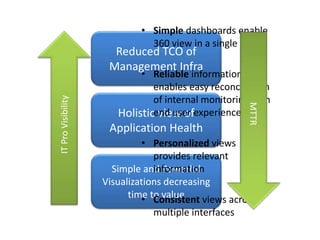
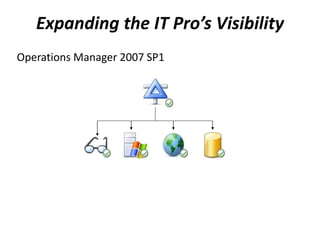
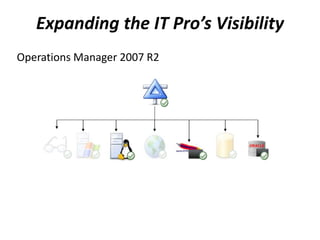
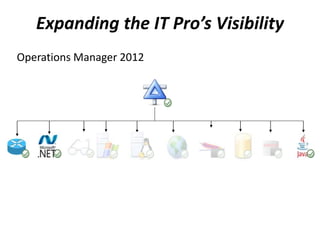
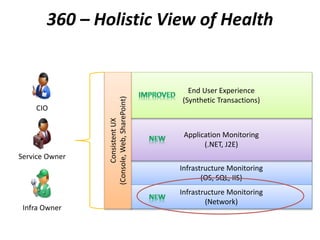
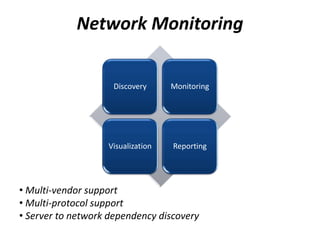
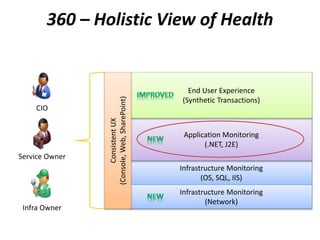
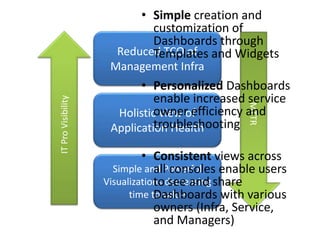
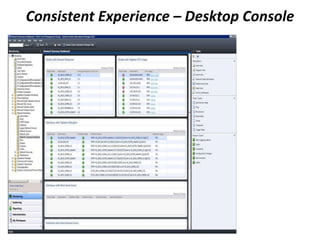
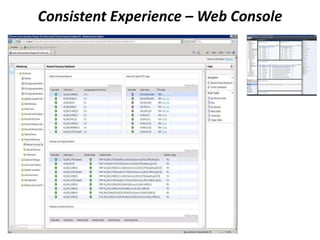
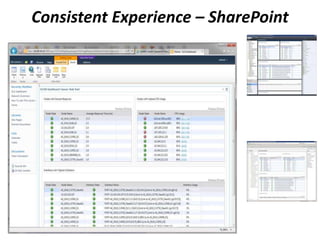
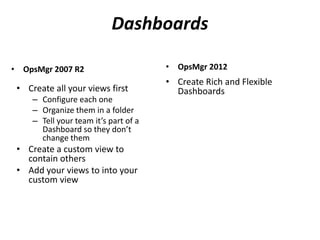
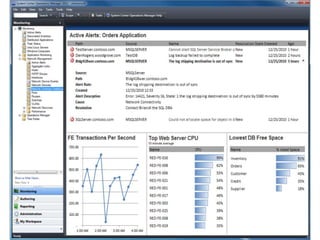
System Center
Operations Manager
An Overview
By - Nitin Ankushkar
Hcl Trainee
Vedicsoft
Operations Manager
MOM 2005
RTM
MOM 2005
SP1
SCOM 2007
RTM
SCOM 2007
SP1
SCOM 2007
R2
SCOM
2012
SCOM 2007
R2 – CU1, CU2, CU3, CU4
What we heard
TCO
Time To Value
Visibility into App Health
Manageability of Mgmt
Infra
Simplicity
Reliability
Personalization
Consistency
Holistic view of
Application Health
Reduced TCO of
Management Infra
Simple and Powerful
Visualizations decreasing
time to value
Holistic view of
Application Health
Reduced TCO of
Management Infra
Simple and Powerful
Visualizations decreasing
time to value
• Simple Topology
requirements enables
lower costs in hardware /
maintenance /
configuration
• Reliable Environment
enables no blackout in
monitoring and reduction
in labor costs for
troubleshooting
• Consistent operational
continuity enables focus to
shift from support ->
innovation in IT
organizations
Disaster Recovery with OpsMgr 2012
• OpsMgr 2007 R2
1. Install Operations Manager 2007 from the
installation media
2. After Operations Manager is installed,
immediately stop the SDK service to prevent the
RMS from sending data to the Operational
database. Install any additional hotfixes
previously installed with your original
installation
3. Delete the Operations Manager database
created from your OpsMgr installation in step 1
4. Restore the latest Operations Manager database
created from your SQL backup
5. Restore the RMS encryption keys
6. Import any additional management packs that
were loaded to your old management server or
changed and backed up after your last
Operational database backup
7. Install the Web console
8. Start the SDK service. Operations Manager will
now be functional
• OpsMgr 2012
1. Install Operations Manager 2012
OpsMgr 2007 R2 – Deployment Topology
Provides the following services:
• Console access
• Alert notifications
• Connectors to other mgmt systems
• Health aggregation
Introduces the following customer
challenges:
• Performance and scalability bottleneck
• High end hardware required
• High availability requires clustering
OpsMgr 2012 – Deployment Topology
X
Challenges Addressed:
• Out of the box HA
• Ability to run on commodity hardware
In OpsMgr 2007 R2:
Managed by a single MS
In OpsMgr 2012:
Managed by Pool
OpsMgr 2012 – Deployment Topology
X
Reducing Mgmt Infra TCO Summary
• 1 step setup of High Availability on commodity HW
• Support for automatic Device monitoring failover
Holistic view of
Application Health
Reduced TCO of
Management Infra
Simple and Powerful
Visualizations decreasing
time to value
• Simple dashboards enable
360 view in a single tool
• Reliable information
enables easy reconciliation
of internal monitoring with
end user experience
• Personalized views
provides relevant
information
• Consistent views across
multiple interfaces
Expanding the IT Pro’s Visibility
Operations Manager 2007 SP1
Expanding the IT Pro’s Visibility
Operations Manager 2007 R2
Expanding the IT Pro’s Visibility
Operations Manager 2012
Infrastructure Monitoring
(OS, SQL, IIS)
Application Monitoring
(.NET, J2E)
End User Experience
(Synthetic Transactions)
Infrastructure Monitoring
(Network)
ConsistentUX
(Console,Web,SharePoint)
Service Owner
Infra Owner
CIO
360 – Holistic View of Health
360 is a function of monitoring that gives customers visibility to the underlying application
environment(s) or infrastructure
Discovery Monitoring
Visualization Reporting
Network Monitoring
• Multi-vendor support
• Multi-protocol support
• Server to network dependency discovery
Network Monitoring
•Demo
Network Summary Dashboard
Vicinity Dashboard
Network Interface Dashboard
Holistic View of App Health (Network Infra)
• Vicinity Dashboard showing contextual Network Map
• Summary Dashboard of Network Devices
• See Network Device Details and Health
Infrastructure Monitoring
(OS, SQL, IIS)
Application Monitoring
(.NET, J2E)
End User Experience
(Synthetic Transactions)
Infrastructure Monitoring
(Network)
ConsistentUX
(Console,Web,SharePoint)
360 is a function of monitoring that gives customers visibility to the underlying application
environment(s) or infrastructure
Service Owner
Infra Owner
CIO
360 – Holistic View of Health
J2E in SCOM
• Supported Platforms in SCOM :
– Operating Systems
• Windows
– Java EE Application Servers
• WebSphere 6.1 & 7.0
• WebLogic 10gRel3 & 11gRel1
• JBOSS 4.2 & 5.1 (JVM 1.5+), JBOSS 6 (TBD)
• Tomcat 5.5 & 6.0 (JVM 1.5+), Tomcat 7 (TBD)
JEE Application Server (JBOSS, Tomcat, WebSphere, WebLogic)JEE Application Server (JBOSS, Tomcat, WebSphere, WebLogic)
Java EE Monitoring
Windows OS
JEE Application Server (JBOSS, Tomcat, WebSphere, WebLogic)
Web Server
Message Queues
Connection Pools
Naming Service
Transaction Service
….….….
Monitor App
Server
Monitor App
using
standard
MBean
Monitor App
using custom
MBean
ApplicationApplicationApplication
Java Management
Extension
MBean
Store
Java EE Monitoring Overview
• JEE Application Servers
– Automatic discovery
– Availability monitoring
– Performance Monitoring
• Memory
• Garbage Collection
• Threads
• Class Loader
• JIT Compiler
• JEE Applications
– Automatic discovery
– Application module discovery
– Availability monitoring
– Template based custom monitoring
The AVIcode Solution
• 24x7 LOB application monitoring (web app and services)
• Detect performance and exception events
• No source code modifications
• End-to-end transaction tracking
• Application availability monitoring
• End-user health monitoring
• Isolate where the events occurred
27
Application Monitoring
•Demo
What’s the end result?
Holistic View of App Health (App Monitoring)
• Out of box App Discovery and Monitoring
• Easy to understand Application failures via Resource View
• Useful Dev information for efficient escalation
• Increased time to value without custom MP authoring
Holistic view of
Application Health
Reduced TCO of
Management Infra
Simple and Powerful
Visualizations decreasing
time to value
• Simple creation and
customization of
Dashboards through
Templates and Widgets
• Personalized Dashboards
enable increased service
owner efficiency and
troubleshooting
• Consistent views across
all consoles enable users
to see and share
Dashboards with various
owners (Infra, Service,
and Managers)
Consistent Experience – Desktop Console
Consistent Experience – Web Console
Consistent Experience – SharePoint
Web Console
Dashboards
• OpsMgr 2007 R2
• Create all your views first
– Configure each one
– Organize them in a folder
– Tell your team it’s part of a
Dashboard so they don’t
change them
• Create a custom view to
contain others
• Add your views to into your
custom view
• OpsMgr 2012
• Create Rich and Flexible
Dashboards
•Demo
Visualizations via Dashboard
Simple and Powerful Visualizations via
Dashboards
• Easy to create Dashboards from Windows and Web Console
• Easy to customize data visualizations via Widgets
• Dashboard and Widgets delivered through MPs
• Show Dashboards in SharePoint
Session Objectives and Takeaways
Session Objectives:
Introduction to System Center Operations Manager.
Understand how System Center Operations Manager :
• Helps reduce the customer’s Mean Time to Resolution
• Expands the IT Pro’s visibility of their environment
40 of 42
Any questions?
Thank you!

scom

  • 1.
    System Center Operations Manager AnOverview By - Nitin Ankushkar Hcl Trainee Vedicsoft
  • 2.
    Operations Manager MOM 2005 RTM MOM2005 SP1 SCOM 2007 RTM SCOM 2007 SP1 SCOM 2007 R2 SCOM 2012 SCOM 2007 R2 – CU1, CU2, CU3, CU4
  • 3.
    What we heard TCO TimeTo Value Visibility into App Health Manageability of Mgmt Infra Simplicity Reliability Personalization Consistency
  • 4.
    Holistic view of ApplicationHealth Reduced TCO of Management Infra Simple and Powerful Visualizations decreasing time to value
  • 5.
    Holistic view of ApplicationHealth Reduced TCO of Management Infra Simple and Powerful Visualizations decreasing time to value • Simple Topology requirements enables lower costs in hardware / maintenance / configuration • Reliable Environment enables no blackout in monitoring and reduction in labor costs for troubleshooting • Consistent operational continuity enables focus to shift from support -> innovation in IT organizations
  • 6.
    Disaster Recovery withOpsMgr 2012 • OpsMgr 2007 R2 1. Install Operations Manager 2007 from the installation media 2. After Operations Manager is installed, immediately stop the SDK service to prevent the RMS from sending data to the Operational database. Install any additional hotfixes previously installed with your original installation 3. Delete the Operations Manager database created from your OpsMgr installation in step 1 4. Restore the latest Operations Manager database created from your SQL backup 5. Restore the RMS encryption keys 6. Import any additional management packs that were loaded to your old management server or changed and backed up after your last Operational database backup 7. Install the Web console 8. Start the SDK service. Operations Manager will now be functional • OpsMgr 2012 1. Install Operations Manager 2012
  • 7.
    OpsMgr 2007 R2– Deployment Topology Provides the following services: • Console access • Alert notifications • Connectors to other mgmt systems • Health aggregation Introduces the following customer challenges: • Performance and scalability bottleneck • High end hardware required • High availability requires clustering
  • 8.
    OpsMgr 2012 –Deployment Topology X Challenges Addressed: • Out of the box HA • Ability to run on commodity hardware
  • 9.
    In OpsMgr 2007R2: Managed by a single MS In OpsMgr 2012: Managed by Pool OpsMgr 2012 – Deployment Topology X
  • 10.
    Reducing Mgmt InfraTCO Summary • 1 step setup of High Availability on commodity HW • Support for automatic Device monitoring failover
  • 11.
    Holistic view of ApplicationHealth Reduced TCO of Management Infra Simple and Powerful Visualizations decreasing time to value • Simple dashboards enable 360 view in a single tool • Reliable information enables easy reconciliation of internal monitoring with end user experience • Personalized views provides relevant information • Consistent views across multiple interfaces
  • 12.
    Expanding the ITPro’s Visibility Operations Manager 2007 SP1
  • 13.
    Expanding the ITPro’s Visibility Operations Manager 2007 R2
  • 14.
    Expanding the ITPro’s Visibility Operations Manager 2012
  • 15.
    Infrastructure Monitoring (OS, SQL,IIS) Application Monitoring (.NET, J2E) End User Experience (Synthetic Transactions) Infrastructure Monitoring (Network) ConsistentUX (Console,Web,SharePoint) Service Owner Infra Owner CIO 360 – Holistic View of Health 360 is a function of monitoring that gives customers visibility to the underlying application environment(s) or infrastructure
  • 16.
    Discovery Monitoring Visualization Reporting NetworkMonitoring • Multi-vendor support • Multi-protocol support • Server to network dependency discovery
  • 17.
  • 19.
  • 20.
  • 21.
  • 22.
    Holistic View ofApp Health (Network Infra) • Vicinity Dashboard showing contextual Network Map • Summary Dashboard of Network Devices • See Network Device Details and Health
  • 23.
    Infrastructure Monitoring (OS, SQL,IIS) Application Monitoring (.NET, J2E) End User Experience (Synthetic Transactions) Infrastructure Monitoring (Network) ConsistentUX (Console,Web,SharePoint) 360 is a function of monitoring that gives customers visibility to the underlying application environment(s) or infrastructure Service Owner Infra Owner CIO 360 – Holistic View of Health
  • 24.
    J2E in SCOM •Supported Platforms in SCOM : – Operating Systems • Windows – Java EE Application Servers • WebSphere 6.1 & 7.0 • WebLogic 10gRel3 & 11gRel1 • JBOSS 4.2 & 5.1 (JVM 1.5+), JBOSS 6 (TBD) • Tomcat 5.5 & 6.0 (JVM 1.5+), Tomcat 7 (TBD)
  • 25.
    JEE Application Server(JBOSS, Tomcat, WebSphere, WebLogic)JEE Application Server (JBOSS, Tomcat, WebSphere, WebLogic) Java EE Monitoring Windows OS JEE Application Server (JBOSS, Tomcat, WebSphere, WebLogic) Web Server Message Queues Connection Pools Naming Service Transaction Service ….….…. Monitor App Server Monitor App using standard MBean Monitor App using custom MBean ApplicationApplicationApplication Java Management Extension MBean Store
  • 26.
    Java EE MonitoringOverview • JEE Application Servers – Automatic discovery – Availability monitoring – Performance Monitoring • Memory • Garbage Collection • Threads • Class Loader • JIT Compiler • JEE Applications – Automatic discovery – Application module discovery – Availability monitoring – Template based custom monitoring
  • 27.
    The AVIcode Solution •24x7 LOB application monitoring (web app and services) • Detect performance and exception events • No source code modifications • End-to-end transaction tracking • Application availability monitoring • End-user health monitoring • Isolate where the events occurred 27
  • 28.
  • 29.
  • 30.
    Holistic View ofApp Health (App Monitoring) • Out of box App Discovery and Monitoring • Easy to understand Application failures via Resource View • Useful Dev information for efficient escalation • Increased time to value without custom MP authoring
  • 31.
    Holistic view of ApplicationHealth Reduced TCO of Management Infra Simple and Powerful Visualizations decreasing time to value • Simple creation and customization of Dashboards through Templates and Widgets • Personalized Dashboards enable increased service owner efficiency and troubleshooting • Consistent views across all consoles enable users to see and share Dashboards with various owners (Infra, Service, and Managers)
  • 32.
  • 33.
  • 34.
    Consistent Experience –SharePoint Web Console
  • 35.
    Dashboards • OpsMgr 2007R2 • Create all your views first – Configure each one – Organize them in a folder – Tell your team it’s part of a Dashboard so they don’t change them • Create a custom view to contain others • Add your views to into your custom view • OpsMgr 2012 • Create Rich and Flexible Dashboards
  • 36.
  • 38.
    Simple and PowerfulVisualizations via Dashboards • Easy to create Dashboards from Windows and Web Console • Easy to customize data visualizations via Widgets • Dashboard and Widgets delivered through MPs • Show Dashboards in SharePoint
  • 39.
    Session Objectives andTakeaways Session Objectives: Introduction to System Center Operations Manager. Understand how System Center Operations Manager : • Helps reduce the customer’s Mean Time to Resolution • Expands the IT Pro’s visibility of their environment
  • 40.
    40 of 42 Anyquestions?
  • 41.