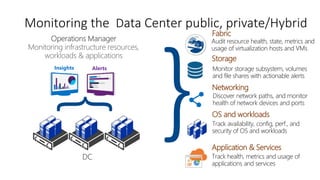
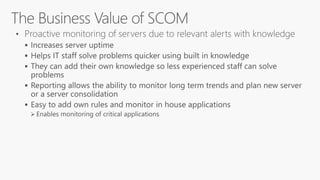
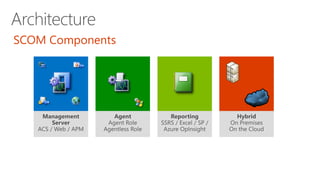
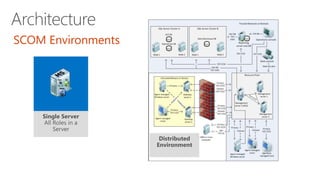
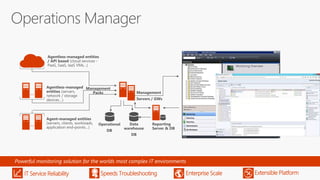
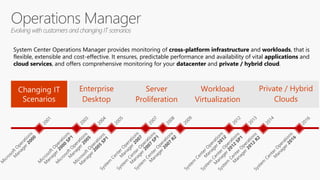
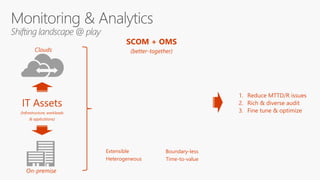
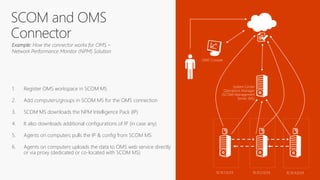
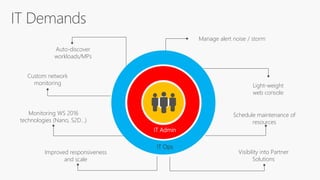
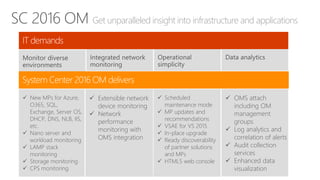
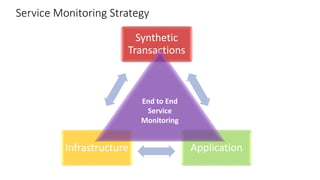
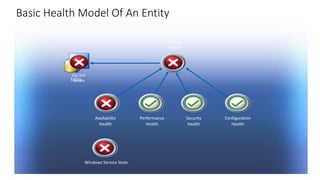
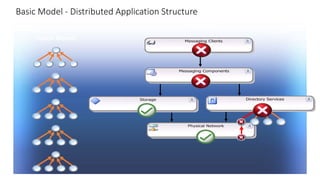
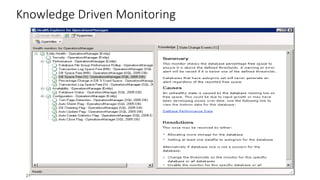
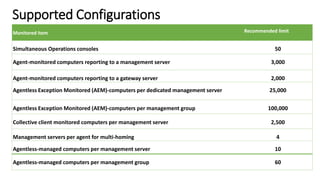
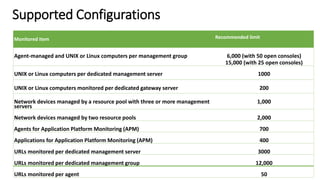
System Center Operations Manager (SCOM) provides flexible, extensible monitoring of infrastructure, workloads and applications across on-premises, cloud and hybrid environments. It ensures predictable performance and availability while reducing MTTD/R through comprehensive monitoring, auditing and optimization. SCOM integrates with Operations Management Suite (OMS) for log analytics, alert correlation and enhanced data visualization at enterprise scale.


![[AWS Techshift] 파트너 사업을 준비하기 위해 기억해야 할 5가지 - 양승호, AWS 파트너 사업 개발 담당 이사](https://cdn.slidesharecdn.com/ss_thumbnails/awstechshiftyangseungho-191022063855-thumbnail.jpg?width=640&height=640&fit=bounds)


