1. 1
MULTIPLE HAZARD MAPPING
BY
PRAMODA G
A. BENEFITS OF MULTIPLE HAZARD MAPPING
The main purpose of MHM is to gather together in one map the different hazard-related information for a study
area to convey a composite picture of the natural hazards of varying magnitude, frequency, and area of effect. A
MHM may also be referred to as a "composite," "synthesized," and "overlay" hazard map. One area may suffer
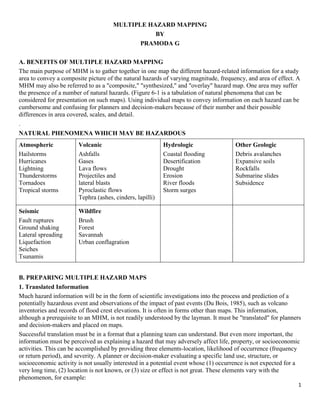
the presence of a number of natural hazards. (Figure 6-1 is a tabulation of natural phenomena that can be
considered for presentation on such maps). Using individual maps to convey information on each hazard can be
cumbersome and confusing for planners and decision-makers because of their number and their possible
differences in area covered, scales, and detail.
.
NATURAL PHENOMENA WHICH MAY BE HAZARDOUS
Atmospheric
Hailstorms
Hurricanes
Lightning
Thunderstorms
Tornadoes
Tropical storms
Volcanic
Ashfalls
Gases
Lava flows
Projectiles and
lateral blasts
Pyroclastic flows
Tephra (ashes, cinders, lapilli)
Hydrologic
Coastal flooding
Desertification
Drought
Erosion
River floods
Storm surges
Other Geologic
Debris avalanches
Expansive soils
Rockfalls
Submarine slides
Subsidence
Seismic
Fault ruptures
Ground shaking
Lateral spreading
Liquefaction
Seiches
Tsunamis
Wildfire
Brush
Forest
Savannah
Urban conflagration
B. PREPARING MULTIPLE HAZARD MAPS
1. Translated Information
Much hazard information will be in the form of scientific investigations into the process and prediction of a
potentially hazardous event and observations of the impact of past events (Du Bois, 1985), such as volcano
inventories and records of flood crest elevations. It is often in forms other than maps. This information,
although a prerequisite to an MHM, is not readily understood by the layman. It must be "translated" for planners
and decision-makers and placed on maps.
Successful translation must be in a format that a planning team can understand. But even more important, the
information must be perceived as explaining a hazard that may adversely affect life, property, or socioeconomic
activities. This can be accomplished by providing three elements-location, likelihood of occurrence (frequency
or return period), and severity. A planner or decision-maker evaluating a specific land use, structure, or
socioeconomic activity is not usually interested in a potential event whose (1) occurrence is not expected for a
very long time, (2) location is not known, or (3) size or effect is not great. These elements vary with the
phenomenon, for example:
2. 2
- Coastal areas annually exposed to winds of specific velocity and storm surges of specific runups.
- Floodplains and floodways which will be impacted by specific velocities and water heights from rainfall
duration and intensity having a fifty-year recurrence interval.
- Fault rupture zones, liquefiable geologic materials, and landslide-susceptible areas having significant vertical
or horizontal displacement by a postulated earthquake of a specific magnitude with a likelihood of occurring
within the next one- or two-hundred-year period.
BENEFITS OF MULTIPLE HAZARD MAPPING
- A more concise focus on the effects and impacts of natural phenomena on a particular area is possible during
early planning stages.
- Many hazards and the trigger mechanism of each can be viewed at the same time. Common reduction or
mitigation techniques can be recommended for the same portion of the study area. Inadequate or missing hazard
information (location, severity, or frequency) can be more easily identified.
- A study area or a sub-area can be expanded, reduced, or deleted. Study areas can be divided into sub-areas
requiring more information, additional assessments, or specific reduction techniques.
- More realistic evaluation of risks to new development are possible.
- Appropriate hazard reduction techniques can be more easily built into the investment project formulation.
- Selection of appropriate land uses can become more rational.
2. Sources and Compiling Information
There is a vast array of sources of hazard information, including various public and private libraries, offices and
reference centers at international, national, regional, and community levels. These entities may be concerned
with infrastructure, community facilities, economic development, resource exploration, land use planning,
emergency preparedness, geotechnical studies, disaster response, and many other activities. Sometimes these
sources coordinate their compiling of hazard information, but it cannot always be expected. Many of the users
of development planning information are also compilers of natural hazard information. Tinsley and Hollander
(1984) have compiled a list of governmental earth-science agencies and selected major international
organizations whose functions are similar to those of the U.S. Geological Survey.
CHARACTERISTICS OF INFORMATION NEEDED TO ASSESS NATURAL PHENOMENA
- Location
- Likelihood of occurrence
- Severity
TYPES OF INFORMATION NEEDED TO ASSESS THE HAZARD POTENTIAL OF NATURAL
PHENOMENA
EARTHQUAKE LANDSLIDE HURRICANES RIVER
FLOODS
LOCATION Epicenters Inventories Landfall Channel
Geologic formations Geologic formations Path Floodway
Slope Floodplain
Elevation
3. 3
SEVERITY Intensity Velocity Wind velocity Volume
Magnitude Displacement Rainfall Velocity
Acceleration Rate of rise
Displacement
LIKELIHOOD OF
OCCURRENCE
Recurrence interval Earthquake recurrence Historical
occurrence
Historical return
periods
Slip rates Flood of record
Historical seismicity Rainfall patterns Design event
Bank cutting rates
3. Timing
The collection of general hazard information began years ago as part of development assistance agency
programs. Within current OAS project procedures, the collection of specific hazard information begins when a
member country makes a formal request for technical assistance and continues through the integrated
development planning process (see Chapter 1). Sending a two-person team to the field for two weeks for a
quick data collection effort represents a relatively low-cost method for initiating collection of specific natural
hazard information (OAS, 1984a).
COMPILING INFORMATION ON MULTIPLE HAZARDS
- Collecting base maps and appropriate hazard information from the various sources identified in this book
- Evaluating the uniformity, accuracy, and completeness of such information-areal coverage, detail, content,
elements (likelihood, location, and severity), format, and symbols.
- Selecting the most appropriate base map and scale to be used, hazards to be shown, and symbols to portray
those hazards.
- Combining the selected individual hazard information onto the MHM in an accurate, clear, and convenient
way.
During the preliminary mission, hazard information collection can be accomplished by:
- Undertaking field travel and "overflights" of the study area.
- Contacting local officials and community leaders.
- Maintaining contact with appropriate national planning officers.
- "Brainstorming" with national counterparts.
- Using experienced staff members or consultants to get an overview.
- Determining the availability of existing data.
During subsequent study stages, the general criteria for data collection should emphasize:
- Striving for the same level of detail.
- Answering specific questions about development problems.
- Using national institutions as sources.
- Drawing on local practice experience.-
- Identifying project ideas (or mitigation techniques).
- Using local research institutions and universities.
- Keeping descriptions to a minimum and emphasizing analysis.
4. 4
C. MAP FORMAT
1. Base Map - Maps are the most effective way to convey actual and relative location. Maps can be simply
defined as flat geographic portrayals of information through the use of symbols. The area covered, scale, detail,
hazards shown, and format of a MHM can range widely:
- World: 1:30,000,000
- Continent: 1:5,000,000, 1:2,000,000
- Region: 1:500,000, 1:200,000, 1:96,000, 1:50,000
- Community or settlement: 1:24,000, 1:12,000
- Building sites: 1:10,000, 1:2,500
2. Scale and Coverage - Map scale is the measure of reduction in size from the actual environment to that
portrayed on the map.
- Number of hazards to be shown.
- Hazard elements to be shown.
- Range of relative severity of hazards to be shown.
- Area to be covered.
- Use of the map in conjunction with other planning documents.
- Function of the map; for example, whether it is to be an index or detail map.
3. Hazards to be Shown
4. Types of Symbols
D. OTHER FORMS OF MULTIPLE HAZARDS INFORMATION
1. Cross section of Effects
2. Photographs of Damage
3. Atlas of Hazards
4. Plan for Reducing Hazards
5. Analyses of Land Capability
6. Single Event with Multiple Hazards
7. Series of Strip Maps
8. Photo Maps
9. Geographic Information Systems
10. Information Processed by Computer
NATURAL HAZARD INFORMATION AND DISPLAY SYMBOLS
SYMBOL Earthquake Hurricane Rood Landslide Volcano
POINT Epicenter site Landfall
measure
Row site Landslide site Volcano
LINE Fault Path Rood elevation Direction of slide Direction of lava flow, ash,
or gas
AREA Seismic
intensity
Storm surge Rood-prone
area
Landslide-prone
area
Coverage of ash, gas or lava
flow
E. LIMITATIONS
1. Credibility
2. Likelihood, Location, and Severity
3. Accuracy versus Precision