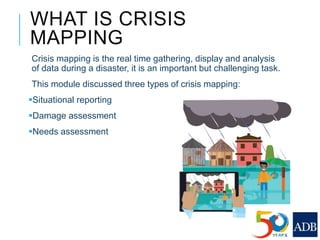
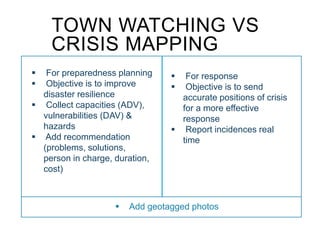
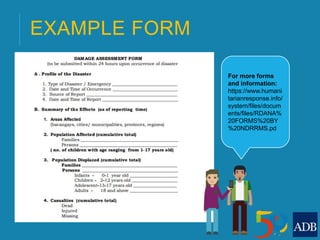
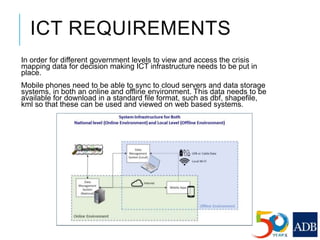
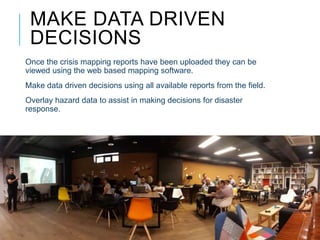
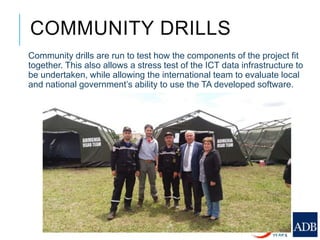
CRISIS
MAPPING AND
COMMUNITY
DRILLS
MODULE 5.0
4.1 Introduction to crisis mapping
4.2 Response time
4.3 Information to be collected
4.4 Crisis mapping reports
4.5 Community drills
4.6 Running a demonstration drill
SESSION OUTLINE
WHAT IS CRISIS
MAPPING
Crisis mapping is the real time gathering, display and analysis
of data during a disaster, it is an important but challenging task.
This module discussed three types of crisis mapping:
Situational reporting
Damage assessment
Needs assessment
 For preparedness planning
 Objective is to improve
disaster resilience
 Collect capacities (ADV),
vulnerabilities (DAV) &
hazards
 Add recommendation
(problems, solutions,
person in charge, duration,
cost)
 For response
 Objective is to send
accurate positions of crisis
for a more effective
response
 Report incidences real
time
 Add geotagged photos
TOWN WATCHING VS
CRISIS MAPPING
WHY IS CRISIS MAPPING
IMPORTANT
Crisis mapping usually is undertaken by community volunteers
and the data validated by national and local governments.
It gives real time information to decision makers to action
needs and rescue in a disaster.
In order for it to be effective for decision makers critical
information needs to be collected. This should comprehend
with the governments DRR framework.
The information taken during a disaster should be adapted
from the standard rapid disaster and needs assessment form
of that country.
IN A DISASTER -
RESPONSE TIME
The ability, speed and accuracy to which community members can report on
disaster varies depending on the severity, extent and type of disaster - For
example, if the disaster is a reoccurring flood and the community does not need to
evacuate then crisis mapping can happen immediately following a disaster.
If it is a large scale disaster where evacuation has taken place, reporting is likely
to be delayed.
Whether a report is a needs assessment, situational report or damage
assessment the method for data collection is the same.
A report consists of taking a geo-tagged picture of the situation, damage or
location of need and adding information that corresponds in the data entry form
NEEDS ASSESSMENT
Needs assessment is basic critical needs, such as: food, water,
shelter, medicine, rescue, education, power, services.
The information collected should:
1. Identify the need
2. Identify the location
3. Take a picture if possible
4. Additional information can include: quantity of needs need, is the
shelter full etc.
SITUATIONAL REPORTS
Situational reports are reports of the
situation occurring on the ground,
such as: flood, landslide, tsunami,
earthquake.
For each hazard type different criteria
information needs to be collected:
Extent of the hazard situation. For
example:
Flood – water level
Landslide – area cover (small,
medium, large)
All reports should be geotagged,
include the exact time and date and
include images of the disaster.
DAMAGE ASSESSMENT
Damage assessments are used to determine economic loss
following a disaster, to assist with rehabilitation. These include
assessments of critical infrastructure such as hospitals,
schools, residential buildings, communication, water facilities,
bridges and roads.
All damaged should be categorized by:
Completely damaged
Partially damaged
Fully damaged
Point data should be taken at these
locations with images if possible.
Remember
to use the
OSM base
map!
MOBILE APPLICATION
Forms for needs assessment,
situational reports and damage
assessments need to be
created to a government
standard and loaded onto a
mobile application.
This is necessary so that
community volunteers and
participants can utilize the
forms out in the field.
The mobile application should
have an online and offline
mode, so if internet isn’t
available data can still be
recorded and uploaded later
on.
WORKSHOP – DEVELOP
FORMS
Objective
Develop forms for needs assessment, situational reports and
damage assessments using the government standard disaster
response forms.
Suggested steps
Gather in 3 small groups (one group for each form).
Using the form pick out the information that the groups wants
to capture using the chosen mobile application.
Present the forms to the group, so that everyone agrees on the
criteria.
Finalize 3 forms and add them to the chosen mobile
application.
EXAMPLE FORM
For more forms
and information:
https://www.humani
tarianresponse.info/
system/files/docum
ents/files/RDANA%
20FORMS%20BY
%20NDRRMS.pd
ICT REQUIREMENTS
In order for different government levels to view and access the crisis
mapping data for decision making ICT infrastructure needs to be put in
place.
Mobile phones need to be able to sync to cloud servers and data storage
systems, in both an online and offline environment. This data needs to be
available for download in a standard file format, such as dbf, shapefile,
kml so that these can be used and viewed on web based systems.
MAKE DATA DRIVEN
DECISIONS
Once the crisis mapping reports have been uploaded they can be
viewed using the web based mapping software.
Make data driven decisions using all available reports from the field.
Overlay hazard data to assist in making decisions for disaster
response.
COMMUNITY DRILLS
Community drills are run to test how the components of the project fit
together. This also allows a stress test of the ICT data infrastructure to
be undertaken, while allowing the international team to evaluate local
and national government’s ability to use the TA developed software.
COMMUNITY DRILLS
The results and evaluation of the demonstration drill will help stakeholders
develop policy guidelines and recommendations that will address gaps within
the disaster risk management approach.
In order to run an effective drill, national consultants and implementing
agencies will need to determine:
1) objectives of the drill, 2) type of drill, 3) approach, and 4) important
considerations.
RUNNING A
DEMONSTRATION DRILL
Best practices for using SBT and ICT in community drills:
1. The drill scenario and activity should be designed based on
the official communication protocols, roles and
responsibilities and the community-based hazard and
evacuation map, use this map to mark locations of the drill
venues
2. Clearly define the drill scenario by identifying: what is
the hazard and extent of damage to life and properties,
locations of the drill and participants;
3. Hold briefing sessions to identify to stakeholders to
explain objective of the event, implementation process and
procedure, required supports from the DMCs and role and
responsibilities of the DMCs in different stages of the
drill, use the community-based hazard and evacuation
map to orientate the stakeholder;
RUNNING A
DEMONSTRATION DRILL
4. Select venues that are integral in a real drill, like local
government offices, shelters and areas of habitation;
include at least three different venues in your drill;
5. Participants should represent the whole of society,
including: local and national governments, police, fire and
rescue services, women, children, people with disabilities,
NGOs and local leaders;
6. Run table top simulations prior to the drill to prepare
participants and ensure they know their roles and
responsibilities
7. Advertise the drill by placing information signs in public
areas, community halls, local government offices and
through community leaders; officiate the drill through an
Official Order if possible;
RUNNING A
DEMONSTRATION DRILL
8. Invite guest to observe the drill, especially regional and
national government officials
9. Place coloured flags to guide crisis mappers on where
to perform needs and damage assessment and situational
reporting
10. Evaluate the drill, note issues, challenges and good
practices; identify actions for improvement
THE DRILL – EXAMPLE MAP
DEMONSTRATION TABLE
Description of Event
Activity: Typhoon Induced Storm Surge Drill Date: May 26, 2017
Purpose:
Aims to enhance the contingency plan of
Barangay Rizal through identification and
assessment of gaps and capacities of
BDRRMC in using the SBT-ICT software and
hardware.
Scope:
High risk puroks of
Barangay Rizal
Software 2 and 3
Objectives:
To be able to check the functionality of BDRRMC and functionality of
SBT-ICT system in the contingency plan of the barangay using software
2 (mobile applications) and 3 (Web GIS).
Specific Objectives:
· To evaluate the capacity of the BDRRMC in using the ICT software
and hardware during disaster response as reflected in the contingency
plan
· To assess coordination mechanism of BDRRMC in information
dissemination before, during and after disaster
· To evaluate the evacuation plan (evacuation route) and
Evacuation Center Management (Health) of the barangay.
Target Participants:
8 Households from Sitio Kabuhayan
8 Households from Sitio Centro
BDRRMC
Location/Site:
Sitio Kabuhayan and Sitio Centro, Barangay Rizal, Padre Burgos,
Quezon
Budget:
50 Katao for Food (Barangay)
100 Katao for Food (Mayor)
Partners:
MLGU, MDRRMO (PB-ERT), DSWD, DepEd, BFP, PNP, RHU,
Kabalikat Civicom, ADB
Over-all Simulation Scenario:
PAGASA released its first severe weather bulletin for Typhoon Emong which was estimated based on all available data at 1, 100 km East of
Legaspi City. It has maximum sustained winds of 65 kph near the center and gusts of up to 80 kph. Typhoon Emong is expected to be at 570
km East of Legaspi one day from now and at 100 km East of Virac, Catanduanes two days from now. The typhoon is expected to affect
Southern Quezon with strong winds and rain showers all over the province. According to PAGASA, the typhoon will cause storm surges, flash
floods, and landslides.
Duration: 3 Hours Time Scale: 30 mins: 1 day
THANK YOU FOR
COMPLETING THE
CRISIS MAPPING
MODULE

Lesson 5. Crisis Mapping and Community Drills

  • 1.
  • 2.
    4.1 Introduction tocrisis mapping 4.2 Response time 4.3 Information to be collected 4.4 Crisis mapping reports 4.5 Community drills 4.6 Running a demonstration drill SESSION OUTLINE
  • 3.
    WHAT IS CRISIS MAPPING Crisismapping is the real time gathering, display and analysis of data during a disaster, it is an important but challenging task. This module discussed three types of crisis mapping: Situational reporting Damage assessment Needs assessment
  • 4.
     For preparednessplanning  Objective is to improve disaster resilience  Collect capacities (ADV), vulnerabilities (DAV) & hazards  Add recommendation (problems, solutions, person in charge, duration, cost)  For response  Objective is to send accurate positions of crisis for a more effective response  Report incidences real time  Add geotagged photos TOWN WATCHING VS CRISIS MAPPING
  • 5.
    WHY IS CRISISMAPPING IMPORTANT Crisis mapping usually is undertaken by community volunteers and the data validated by national and local governments. It gives real time information to decision makers to action needs and rescue in a disaster. In order for it to be effective for decision makers critical information needs to be collected. This should comprehend with the governments DRR framework. The information taken during a disaster should be adapted from the standard rapid disaster and needs assessment form of that country.
  • 6.
    IN A DISASTER- RESPONSE TIME The ability, speed and accuracy to which community members can report on disaster varies depending on the severity, extent and type of disaster - For example, if the disaster is a reoccurring flood and the community does not need to evacuate then crisis mapping can happen immediately following a disaster. If it is a large scale disaster where evacuation has taken place, reporting is likely to be delayed. Whether a report is a needs assessment, situational report or damage assessment the method for data collection is the same. A report consists of taking a geo-tagged picture of the situation, damage or location of need and adding information that corresponds in the data entry form
  • 7.
    NEEDS ASSESSMENT Needs assessmentis basic critical needs, such as: food, water, shelter, medicine, rescue, education, power, services. The information collected should: 1. Identify the need 2. Identify the location 3. Take a picture if possible 4. Additional information can include: quantity of needs need, is the shelter full etc.
  • 8.
    SITUATIONAL REPORTS Situational reportsare reports of the situation occurring on the ground, such as: flood, landslide, tsunami, earthquake. For each hazard type different criteria information needs to be collected: Extent of the hazard situation. For example: Flood – water level Landslide – area cover (small, medium, large) All reports should be geotagged, include the exact time and date and include images of the disaster.
  • 9.
    DAMAGE ASSESSMENT Damage assessmentsare used to determine economic loss following a disaster, to assist with rehabilitation. These include assessments of critical infrastructure such as hospitals, schools, residential buildings, communication, water facilities, bridges and roads. All damaged should be categorized by: Completely damaged Partially damaged Fully damaged Point data should be taken at these locations with images if possible. Remember to use the OSM base map!
  • 10.
    MOBILE APPLICATION Forms forneeds assessment, situational reports and damage assessments need to be created to a government standard and loaded onto a mobile application. This is necessary so that community volunteers and participants can utilize the forms out in the field. The mobile application should have an online and offline mode, so if internet isn’t available data can still be recorded and uploaded later on.
  • 11.
    WORKSHOP – DEVELOP FORMS Objective Developforms for needs assessment, situational reports and damage assessments using the government standard disaster response forms. Suggested steps Gather in 3 small groups (one group for each form). Using the form pick out the information that the groups wants to capture using the chosen mobile application. Present the forms to the group, so that everyone agrees on the criteria. Finalize 3 forms and add them to the chosen mobile application.
  • 12.
    EXAMPLE FORM For moreforms and information: https://www.humani tarianresponse.info/ system/files/docum ents/files/RDANA% 20FORMS%20BY %20NDRRMS.pd
  • 13.
    ICT REQUIREMENTS In orderfor different government levels to view and access the crisis mapping data for decision making ICT infrastructure needs to be put in place. Mobile phones need to be able to sync to cloud servers and data storage systems, in both an online and offline environment. This data needs to be available for download in a standard file format, such as dbf, shapefile, kml so that these can be used and viewed on web based systems.
  • 14.
    MAKE DATA DRIVEN DECISIONS Oncethe crisis mapping reports have been uploaded they can be viewed using the web based mapping software. Make data driven decisions using all available reports from the field. Overlay hazard data to assist in making decisions for disaster response.
  • 15.
    COMMUNITY DRILLS Community drillsare run to test how the components of the project fit together. This also allows a stress test of the ICT data infrastructure to be undertaken, while allowing the international team to evaluate local and national government’s ability to use the TA developed software.
  • 16.
    COMMUNITY DRILLS The resultsand evaluation of the demonstration drill will help stakeholders develop policy guidelines and recommendations that will address gaps within the disaster risk management approach. In order to run an effective drill, national consultants and implementing agencies will need to determine: 1) objectives of the drill, 2) type of drill, 3) approach, and 4) important considerations.
  • 17.
    RUNNING A DEMONSTRATION DRILL Bestpractices for using SBT and ICT in community drills: 1. The drill scenario and activity should be designed based on the official communication protocols, roles and responsibilities and the community-based hazard and evacuation map, use this map to mark locations of the drill venues 2. Clearly define the drill scenario by identifying: what is the hazard and extent of damage to life and properties, locations of the drill and participants; 3. Hold briefing sessions to identify to stakeholders to explain objective of the event, implementation process and procedure, required supports from the DMCs and role and responsibilities of the DMCs in different stages of the drill, use the community-based hazard and evacuation map to orientate the stakeholder;
  • 18.
    RUNNING A DEMONSTRATION DRILL 4.Select venues that are integral in a real drill, like local government offices, shelters and areas of habitation; include at least three different venues in your drill; 5. Participants should represent the whole of society, including: local and national governments, police, fire and rescue services, women, children, people with disabilities, NGOs and local leaders; 6. Run table top simulations prior to the drill to prepare participants and ensure they know their roles and responsibilities 7. Advertise the drill by placing information signs in public areas, community halls, local government offices and through community leaders; officiate the drill through an Official Order if possible;
  • 19.
    RUNNING A DEMONSTRATION DRILL 8.Invite guest to observe the drill, especially regional and national government officials 9. Place coloured flags to guide crisis mappers on where to perform needs and damage assessment and situational reporting 10. Evaluate the drill, note issues, challenges and good practices; identify actions for improvement
  • 20.
    THE DRILL –EXAMPLE MAP
  • 21.
    DEMONSTRATION TABLE Description ofEvent Activity: Typhoon Induced Storm Surge Drill Date: May 26, 2017 Purpose: Aims to enhance the contingency plan of Barangay Rizal through identification and assessment of gaps and capacities of BDRRMC in using the SBT-ICT software and hardware. Scope: High risk puroks of Barangay Rizal Software 2 and 3 Objectives: To be able to check the functionality of BDRRMC and functionality of SBT-ICT system in the contingency plan of the barangay using software 2 (mobile applications) and 3 (Web GIS). Specific Objectives: · To evaluate the capacity of the BDRRMC in using the ICT software and hardware during disaster response as reflected in the contingency plan · To assess coordination mechanism of BDRRMC in information dissemination before, during and after disaster · To evaluate the evacuation plan (evacuation route) and Evacuation Center Management (Health) of the barangay. Target Participants: 8 Households from Sitio Kabuhayan 8 Households from Sitio Centro BDRRMC Location/Site: Sitio Kabuhayan and Sitio Centro, Barangay Rizal, Padre Burgos, Quezon Budget: 50 Katao for Food (Barangay) 100 Katao for Food (Mayor) Partners: MLGU, MDRRMO (PB-ERT), DSWD, DepEd, BFP, PNP, RHU, Kabalikat Civicom, ADB Over-all Simulation Scenario: PAGASA released its first severe weather bulletin for Typhoon Emong which was estimated based on all available data at 1, 100 km East of Legaspi City. It has maximum sustained winds of 65 kph near the center and gusts of up to 80 kph. Typhoon Emong is expected to be at 570 km East of Legaspi one day from now and at 100 km East of Virac, Catanduanes two days from now. The typhoon is expected to affect Southern Quezon with strong winds and rain showers all over the province. According to PAGASA, the typhoon will cause storm surges, flash floods, and landslides. Duration: 3 Hours Time Scale: 30 mins: 1 day
  • 22.
    THANK YOU FOR COMPLETINGTHE CRISIS MAPPING MODULE