3. 3
Abstract:
Disaster are extreme events that occur all around the world that have negative implications in a
countries development. Disaster management approach is to reduce the hazards, prevent disaster and
become more prepared for further events. This paper focus on the disaster management application of
Geoinformatics is examined in regards to the disaster cycle during; mitigation, preparedness, response
and recovery phases. This report focus on the different branches of Geoinformatics, highlighting their
application in relation to disaster management.
6. 6
1.0 Introduction
1.1 Rationale
Disaster management cycle model is the focal point in which disaster management planning is
structured around. The main purpose of this model is to reduce the overall impacts of disaster through
the four stages of the cycle: mitigation, preparedness, response and recovery. The formation of a
hazard-resistant and disaster coping society is major factor that contributes to sustainable economic
development and better quality of life. Thus, the successful application of Geoinformatics in disaster
management is becoming crucial.
Geoinformatics technology is emerging fast and is already be utilized. Global navigation satellites and
earth observations provide data for a range of applications: weather forecast, disaster alerting, flood
monitoring and soil spill detection. Satellite imagery has provided many benefits during the monitoring
and management of recent disasters, such as hurricane Katrina (Smith, 2013), and Indian ocean
tsunami (Voigt et al. 2007). The use and exchange of geospatial information is critical during
disastrous events, and thus is facilitated on a national and international level. The use of sensors and
in-situ data have been integrated for both early warning systems and hazard monitoring. Geospatial
data collected can be stored in Geographical Information Systems (GIS) which has become a
multifunctional tool. Many of these systems are used for early warnings and real-time response.
1.2 Aims and objectives
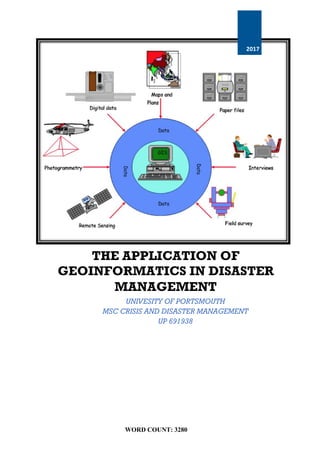
All phases of the disaster management cycle depend on data that is collected from a verity of sources
(Sharma, Joshi & Kumar, 2010). This paper aims to discuss the role of Geoinformatics in relation to
the disaster management processes. To achieve the aim of this report the following objectives have
been given:
List the different stage of the disaster management cycle
Review literature on Geoinformatics, highlighting the different branches of Geo-informatics
Illiterate the uses of Geoinformatics in all four stages of the disaster management cycle
7. 7
2.0 Disaster management cycle
Disasters can occur all around the world and can have profound implications on social and economic
welfare; especially for poorer countries, where a disastrous event could result in a declined economic
growth (van Western, 2000). These events can be either natural, or manmade and have produced heavy
loses to life and property, causing significant disruptions to the functions of a society (Shamshiry et
al, 2011). Thus, these damages can exceed the response and recovery capabilities of an affected area
(Van Oosterom, Zlatanova & Fendel, 2006). There are four stages to the disaster management cycle:
reduction, preparedness, response and recovery, as shown in figure 1. As summary of the disaster
management cycle is found in table 1.
The main objective of disaster management is to identify the hazards, monitor the situation, and
suggest contingency plans, to prepare for the event and reduce the overall impacts of a disaster
(Sharma, Joshi & Kumar, 2010). When a disaster occurs, the focus is to respond to the disaster, and
then return the quality of life back to pre-disaster state. This makes the handling of Geographical
Information paramount when managing a crisis, and is crucial for the decision-making process during
disaster management (Vijayaraghavan et al, 2012).
Figure 1. Disaster Management cycle. Source: About Us - Natural Hazards Partnership, ( n.d.)
9. 9
3.0 Overview of Geoinformatics
Geoinformatics is considered a recent topic, and so various definitions have been developed by authors. For
example, Raju (2003) defines Geoinformatics as the science and technology that deals with the character and
structure of spatial information. Similarly, Ehlers (2008) defines Geoinformatics as the gathering, analyzing,
interpreting and distribution of data using geographic information. There are different aspects to Geoinformatics
Hence, there is no globally accepted definition. Table 2 shows a summary of the different types of tools in
Geoinformatics and how they work.
Table 2. Geoinformatics examples, and how they work.
10. 10
3.1 Photogrammetry
Photogrammetry is the processing of images with the main products being: DTM’s, and DSM’s which
is discussed in further detail by Balsavias (1999). There are two types of photogrammetry as shown in
table 3. Satellite images and aerial photos are used to map variations of geographical properties such
as water geology and vegetation (Nowak & Nowak, 2002). Digital Terrain Models (DTM) are typical
end products, as shown in figure 2. The time in which the images are produced and information is
dispersed is crucial. For disasters earth observation techniques are significant in the monitoring and
warning stages, pre-disaster.
Table 3. Aerial and close-range photogrammetry. Source: (Walford,2007)
Figure 2. DTM of Royat park France, showing the terrain in 3D. Produce on Surfer software.
11. 11
3.2 Remote sensing
Remote sensing is an important tool used in the disaster management cycle as it can provide effective
monitoring and mapping of hazardous and vulnerable features pre, during and post disaster (Teeuw et
al, 2012). Remote sensing has been used to map and monitor tropical and coastal wetlands, tropical
rain forests, coral reef and coastal ecosystems (Phinn et al, 2006). Remote sensing is an important tool
when monitoring and providing warnings of cyclones and droughts. Satellite borne platforms allows
the user to see images of the whole Earth. Thus, it’s evident that satellite borne platforms are the most
important when looking at global phenomena’s, such as the weather.
Remote sensing systems tend to use multispectral optical sensors that detect infrared and visible
wavelengths. These sensors include: Hyperion, MODIS, Aster and Landsat. (Tralli et al, 2005). It is
important to note that optical sensors are unable to detect wavelengths through cloud. Therefore, they
predominantly operate during the day. Radar sensors are useful tools as they can penetrate through
clouds and be used during the night. They are particularly sensitive to soil moisture and are useful
when monitoring and mapping flood events.
3.3 Spatial analysis
According to MacEachren et al. (1999) spatial analysis techniques involves spatiotemporal or
spatial data sets that are used to identify specific features. With regards to disaster management, spatial
analysis can be used to track and record the spread of a particular hazard. This tool is used within the
field of epidemiology, to monitor the spread of an infection, and is discussed in more detail by Jones
et al. (2008).
3.4 GIS software
GIS software has become a topic of many studies, especially for those looking in emergency
management (Tanasescu et al. 2006). GIS were designed to support geographical inquiry and spatial
decision making, as stated by Cova (1999). There are many applications of GIS, as summarized in
figure 3. From a disaster management prospect GIS-based modelling is a critical tool, as it can provide
an insight in the processes causing the disaster. Additionally, information collected can be used in pre-
disaster plans to provide effective disaster preparedness.
QGIS, ArcGIC and Google Earth are all GIS software platforms that can be used to generate hazard
maps. Data collected from GIS software can be both analyzed and manipulated, thus identify specific
features within the data set. Both QGIS and Google Earth are free software that are accessible to low
income counties, which is discussed by Teeuw et al. (2013) in more detail.
13. 13
4.0 Application of Geoinformatics in the disaster management cycle
4.1 Mitigation
Disasters put constraints on society in that they can cause conflict, migration, reliance on limited resources,
economic and political vulnerability etc. These all contributes to a hazardous location, and so the level of
vulnerability increase. This is turn can make another disaster occur again. An understanding of the types of
hazards, their frequency, during, magnitude, location, and range is essential information to known (E.g.
hurricane strength, tephra, heavy rainfall) (Joyce et al. 2009). Smith (2013) suggests that it is primarily social
impacts that causes the hazardous event into a disaster. However, in order to make decisions during the
mitigation phase, there needs to improved knowledge of the hazard and its potential consequences.
Remote sensing technology is an essential during the mitigation phase; it provides data that can assist emergency
managers, and land use planners. This phase aims to reduce/mitigate the risk, hence reducing the probability of
a disaster occurring. Table 4 summarizes how remote sensing can be utilized in disaster risk reducing through
the identification of different hazards. Remote sensing is a tool that can be used for floodplain modelling, slope
stability and landslide susceptibility mapping. Susceptibility maps are also essential during the mitigation phase.
Figure 4 shows how GIS is used to produce a landslide susceptibility map. Susceptibility maps can be used to
investigate areas that need mitigation, in regards to landslides, slopes that need reinforcement.
Table 4. Example of the data and information required during the mitigation phase. Source: (Joyce et
al. 2009)
14. 14
Figure 4. Flow diagram shown the development of a landslide susceptibility map using GIS software.
Source: (NOAH, 2014)
15. 15
4.2 Preparedness
Preparedness is referred to as the identification and development of necessary plans, systems,
resources and skills before a hazardous event has occurred. The main outcome of preparedness needs
to provide a sense of readiness so if a disaster does occur, plans are in place to provide a more
coordinate and efficient response. Thus, reducing the overall response and recover times (Waugh,
1999). Examples of preparedness include the following: public education, training, evacuation plans,
and public alert systems. Thus are put in place at national and international levels. Table _ provides
examples of data that is required during the preparedness phase as suggested by Joyce et al. (2009).
Photogrammetric should play a major role in the Disaster Management Cycle, as it can provide real
time imagery and can be used to make a community more prepared. It also provides a history of past
events, thus highlight the frequency. Table 5 summarizes the data that is required during the
preparedness stage.
Tsunamis are natural disaster that can occur any time, and can have global impacts, as shown with the
Indian ocean tsunami (2004). Automatic warning systems have been put in place to highlight the risk
of tsunami. As a response those that are in the inundation zone, need to evacuate (Blewitt et al. 2006).
Therefore, it is essential that the plans have already been put in place to identify evacuation point, prior
to a disaster occurring (Smith, 2013). Evacuation maps are crucial during the disaster preparedness
stage, as they are there implemented to save lives. Figure 5 is an example of a tsunami evacuation map,
that highlights areas that are within the tsunami inundation zone areas deem safe, outside the
inundation zone.
16. 16
Table 5. Examples of Information and data requirements during the preparedness phase. Source:
(Joyce et al. 2009)
`
17. 17
Figure 5 Tsunami evacuation map for Nehalem Bay. Yellow indicates inundation zone, green is
outside the inundation zone. Source: (Dieken, n.d.)
18. 18
4.3 Reponses
During the disaster, information needs to be accurate, at the right time so the appropriate actions by
emergency services can be determined. Disasters often affect most organizations and government
departments. Emergency responders need information on building layout, electrical distribution, etc.
This GPS is a tool that is critical as it allows the distribution and sharing of data through a database,
on a computer-generated map (Johnson, 2000). This saves emergency responders time, provides a
mechanism in which critical information can be displayed and visualized during a disaster. Table 6
highlights information that is required during the response phase.
Humanitarian emergencies usually occur without warning, thus destroying lives and affecting
livelihoods within a matter of seconds. During the early stages of response, it is essential for
emergency services to response to save lives. Information is vital at this stage. It is important that the
worst affected areas and most vulnerable areas are identified to distribute resources based on needs.
MapAction is a tool developed using GIS, that quickly gathers information, thus displaying
information in the form of maps (MapAction, 2010). This ‘shared operational picture’ helps inform
government and aid organization where to deliver emergency supplies (MapAction, 2010). Figure 6
provides an example of map produced by MapAction that highlights damaged building. Areas where
there are more damaged require more immediate assistance, aiding search and rescue (MapAction,
2010).
Satellite remote sensing can play a role in relief efforts during the disaster; identifying the areas
affected if the area is sufficient large. One main limitation is the temporal resolution and spatial
resolution that is provide by an individual satellite is not sufficient (Nowak & Nowak, 2002). Aircrafts
can be used to take imagery, as they can be used in bad weather, and put in operation quickly. In
addition to this, the aircrafts used can be provided with different data sources such as: digital and
analogue cameras, infra-red, visible, radar or microwave sensors, and laser scanning.
19. 19
Table 6. Information and data that is requires during the response phase. Source: (Joyce et al, 2009)
20. 20
Figure 6. Map showing the total number of houses that were damaged as a result of tropical Strom
Ondoy, across the Philippines, recorded on 5th October 2009. Source: (Map Action, 2009).
21. 21
4.4 Recovery
During the aftermath of a disaster it is essential to assess the damage and continue monitoring behavior
post disaster (Opadeyi et al, 2009). The information required post disaster is shown within table 7. The
aim of the recovery phase is to make a community more resilient.
GIS, remote sensing and ground observations has become useful tools during the monitoring changes
in urban areas after a disaster (Contreras et al. 2016). High-resolution imagery can be used to compare
the damage before and after a disaster to show the damage caused. Figure 7 provides an example of
this. Furthermore, aerial photos can be used during the reconstruction phase when evaluation the
location of new sites for relocation. In addition, this type of imagery can show the different stages of
development during the reconstruction phase.
Table 7. Example of information and data required during the recovery stage of a disaster. Source:
(Joyce et al. 2009)
22. 22
Figure 7. Aerial photos showing the damage caused by the 2004 Tsunami, Ikonos. Source: (Sickels,
2014)
23. 23
5.0 Examples of the use of Geoinformatics
5.1 Volcanism
Volcanic monitoring is critical during the four stages of the disaster management cycle (Cartwright,
2005). Predicting the style, time, and magnitude of a volcanic eruption is essential for volcanic hazard
assessments. Gillespie et al. (2007) and Trilli et al. (2005) reviewed the use of remote sensing for
natural hazards. Gillespie et al. (2007) in particular focuses on the use of satellite imagery.
Sulphur dioxide is a hazardous gas released from a volcan which can be detected by remote sensing
using ASTER bands 10, 11, 12, as suggested by Pugnaghi et al. (2006). Figure 8 shows the Sulphur
plume that is blowing in a southern direction. This type of Geoinformatics can be used forecast the
direction in which this gas will travel and can be used during the preparedness stage.
Laser remote sensing is a tool that can be used during the early detection of volcanic hazards
(Michaelides, 2016). Volcanic gases, in particular CO2 gives information on magmatic processes.
Normally, this CO2 is measured in volcanic plumes, which provides serve risks to those taking the
samples and is very time consuming (Fiorani et al, 2016). For these reasons LIDAR profiling, has
been undertaking. The development of the volcanic LIDAR is undertaken by the ENEA. This tool
allows the user to scan volcanic plumes remotely, in a fast and continuous way, and with high spatial
and temporal resolution (Fiorani et al, 2016).
24. 24
Figure 8 - Mt Etna map showing volcanic activity in the form of Sulphur gas at the crater. Produced
using Aster Bands 10, 11, 12.
25. 25
Figure 9. Monitoring of carbon dioxide with LIDAR data. Described in more detail (Fiorani et al,
2016).
26. 26
5.2 Flooding
Flooding events are amount the most devastating and frequent natural hazards in the world. They are
widely distributed, and can result in significant economic and social impacts (DMSG, 2001). The
relationship between upstream rainfall and vulnerability it easy adapted well to a Geoinformatics-
based risk assessments and management. Maps produced often involve detailed elements of risk,
vulnerabilities, satellite precipitation estimates, river flow, Gauges, sophisticated preparedness and
early warning procedures (CRED, 2008).
Early warning systems during flood events allows for vulnerable inhabitants of flood prone
communities the time to prepare. Preparedness could involve evacuation, or the moving of items that
are susceptible to water damage such as livestock, household electronics, furniture, harvests to safety
(Sanyai & Lu, 2006). Figure 10 is an example of a flood hazard map, highlight areas that could be
damaged.
Figure 10. Example flood hazard map - Slovakia, Danube catchment. Source: (EUROSENSE, n.d.)
27. 27
5.3 Earthquakes.
Earthquakes have the potential to thousands, and have done so in the past, as shown during Haiti (2010)
and Chili (1960). Hazard mapping becomes essential. During both Kobe earthquake (1995)
Christchurch (2011) liquefaction was recorded, and caused significant damages (Hamada et al, 1997;
Cubrinovski et al, 2011). This shows the importance of liquefaction hazard mapping. An example is
shown in figure 11.
LiDAR mapping of active fault locations can be used for hazard mapping and described in more detail
by. Fault mapping was originally carried out using stereo aerial photography interpretation, followed
by field work. However, this method was deemed time consuming (Joyce et al, 2009). Figure 12
displays a LIDAR map, showing the different faults that have been identified using LIDAR.
Figure 11. Map that shows the liquefaction hazards along the Hayward fault zone, if a magnitude 7.1 occurred.
Source: (Liquefaction Hazard Map, 2016)
29. 29
6.0 Conclusion
6.1 Summary
Geoinformatics has a wide array of applications, especially in the disaster management sector, where
advances in technology can help improve planning during each stage of the disaster management cycle.
There are four stages of the disaster management cycle which all require Geoinformatics.
During the mitigation phase, remote sensing coupled with GIS enables the formation of hazard and
vulnerability maps; which can be used for the producing of risk maps. Preparedness phase provides
essential planning, before a disaster occurs. Evacuation routes can be planned with the use of GIS
software and aerial photograph. Photogrammetric data when used in combination with GIS and GPS
is an extremely useful took during search and rescue operations. Especially in areas that have been
devastated by the disaster where orientation is difficult. The recovery stage of the disaster cycle
involves the reconstruction and rehabilitation. Aerial and satellite imager is a useful tool for assessing
damages and identifying areas that need to be fix. The aim of the disaster management cycle when
used correctly is make a community more resilient to a disaster through reducing the risk of hazardous
event’s .
6.2 Recommendations for further study
Remote sensing and GIS are crucial in the disaster management cycle, and its application is expected
to expand significantly over time. Hence, recommendation for further study are:
Explore in more detail the different application of remote sensing
Pandemic flu is the largest hazard in the UK, explore the use of Geoinformatics with regards to
monitoring and forecasting on infections
Research the different types of modelling that are used during the disaster management cycle
Review further the use of LIDAR data to monitor volcanic activity and how it can be used to the
future to forecast model
30. 30
7.0 References
- About Us - Natural Hazards Partnership. Natural Hazards Partnership. Retrieved 2 January 2017, from
http://www.naturalhazardspartnership.org.uk/about-us/
- Baltsavias, E. P. (1999). A comparison between photogrammetry and laser scanning. ISPRS Journal of photogrammetry
and Remote Sensing, 54(2), 83-94.
- Begg, J. G., & Mouslopoulou, V. (2010). Analysis of late Holocene faulting within an active rift using lidar, Taupo Rift,
New Zealand. Journal of Volcanology and Geothermal Research, 190(1), 152-167
- Blewitt, G., Kreemer, C., Hammond, W. C., Plag, H. P., Stein, S., & Okal, E. (2006). Rapid determination of earthquake
magnitude using GPS for tsunami warning systems. Geophysical Research Letters, 33(11).
- Cartwright, S. (2005). National civil defence emergency management plan order 2005. Published under the authority of
the New Zealand Government, Wellington, New Zealand.
- Contreras, D., Blaschke, T., Tiede, D., & Jilge, M. (2016). Monitoring recovery after earthquakes through the integration
of remote sensing, GIS, and ground observations: the case of L’Aquila (Italy). Cartography and Geographic Information
Science, 43(2), 115-133.
- Cova, T. J. (1999). GIS in emergency management. Geographical information systems, 2, 845-858.
- Cubrinovski, Misko, Jonathan D. Bray, Merrick Taylor, Simona Giorgini, Brendon Bradley, Liam Wotherspoon, and
Joshua Zupan. "Soil liquefaction effects in the central business district during the February 2011 Christchurch
earthquake." Seismological Research Letters 82, no. 6 (2011): 893-904.
- Damage Assessment by EUROSENSE. Eurosense.com. Retrieved 1 January 2017, from
http://www.eurosense.com/documents/your-application/risk-and-security/damage-assessment.xml?lang=en-gb
- Delaney, J. (1999). Geographical information systems: an introduction. Oxford University Press, USA.
- Dieken, G. Emergency Preparedness | Wheeler, Oregon. Ci.wheeler.or.us. Retrieved 2 January 2017, from
http://ci.wheeler.or.us/?page_id=731
- DMSG, 2001. The Use of Earth Observing Satellites for Hazard Support: Assessments & Scenarios. Committee on Earth
Observation Satellites Disaster Management Support Group, Final Report, NOAA, Dept. Commerce, USA.
- Ehlers, M. (2008). Geoinformatics and digital earth initiatives: a German perspective. International journal of digital
earth, 1(1), 17-30.
- Fiorani, L., Santoro, S., Parracino, S., Maio, G., Nuvoli, M., & Aiuppa, A. Early detection of volcanic hazard by lidar
measurement of carbon dioxide. Natural Hazards, 1-9.
- Goodchild, M. F., & Longley, P. (1999). The future of GIS and spatial analysis. Geographical information systems, 1, 567-
580.
- Hamada, M., Isoyama, R., & Wakamatsu, K. (1997). The Hyogoken-Nanbu (Kobe) Earthquake: Liquefaction, Ground
Displacement and Soil Condition in Hanshin Area. Association for Development of Earthquake Prediction.
- Jensen, J.R. (1996). Introductory digital image processing: a remote sensing perspective. New Jersey: Prentice-Hall.
- Johnson, R. (2000). GIS technology for disasters and emergency management. An ESRI white paper.
- Jones, K. E., Patel, N. G., Levy, M. A., Storeygard, A., Balk, D., Gittleman, J. L., & Daszak, P. (2008). Global trends in
emerging infectious diseases. Nature, 451(7181), 990-993.
- Joyce, K. E., Wright, K. C., Samsonov, S. V., & Ambrosia, V. G. (2009). Remote sensing and the disaster management
cycle. INTECH Open Access Publisher.
- Konecny, G. (2003). Geoinformation, Remote Sensing, Photogrammetry and Geographic Information Systems.
- Konecny, G. (2014). Geoinformation: remote sensing, photogrammetry and geographic information systems. CRC Press.
- Lechner, W., & Baumann, S. (2000). Global navigation satellite systems. Computers and Electronics in Agriculture, 25(1),
67-85.
31. 31
- Liquefaction Hazard Maps. (2016). Earthquake.usgs.gov. Retrieved 2 January 2017, from
https://earthquake.usgs.gov/regional/nca/alameda/
- Liu, X., & Lim, S. (2015). A spatial analysis approach to evacuation management: shelter assignment and routing.
- MacEachren, A. M., Wachowicz, M., Edsall, R., Haug, D., & Masters, R. (1999). Constructing knowledge from
multivariate spatiotemporal data: integrating geographical visualization with knowledge discovery in database
methods. International Journal of Geographical Information Science, 13(4), 311-334.
- Map Action. (2009)): Philippines: Tropical Storms Ondoy - Housing Damage (Total) from 05-Oct-2009, 16:00, NDCC
Situation Report 20. - MapAction. (2009). Map Action. Retrieved 2 January 2017, from
http://maps.mapaction.org/dataset/187-1763
- MapAction. (2010). Mapaction.org. Retrieved 1 January 2017, from https://mapaction.org/about-us/
- Michaelides, S. (2016). Applications of geoinformatics for the prevention and mitigation of natural hazards.
- NOAH, P. (2014). Landslide hazard mapping of Leyte Province, Philippines using remote sensing, numerical modeling,
and GIS | Project NOAH Blog. Blog.noah.dost.gov.ph. Retrieved 1 January 2017, from
http://blog.noah.dost.gov.ph/2014/10/24/leyte-landslide-assessment/
- Nowak, E., & Nowak, J., (2002). The role of photogrammetry in complex disaster management systems. In: D. Kereković
(ed.). GIS Odyssey 2002. Geographical Information Systems. International Conference & Exhibition. Croatian Information
Technology Association – GIS Forum, University of Silesia, University of Zagreb, University of J. J. Strossmayer in
Osijek, Warsaw University of Technology, Zagreb, 165-170.
- Opadeyi, J., Spence, B., Miller, K., & Griffith-Charles, C. (2008). Incorporating Geoinformatics into Disaster Preparedness
and Management Operations: A Caribbean Regional Approach. West Indian Journal of Engineering, 31.
- Phinn, S., Joyce, K., Scarth, P., & Roelfsema, C. (2006). The role of integrated information acquisition and management
in the analysis of coastal ecosystem c. In Remote sensing of aquatic coastal ecosystem processes (pp. 217-249). Springer
Netherlands.
- Raju, P. L. N. (2003). Fundamentals of geographic information systems. In Workshop: satellite remote sensing and GIS
applications in agricultural meteorology, India.
- Sanyal, J., & Lu, X. X. (2006). GIS‐based flood hazard mapping at different administrative scales: A case study in
Gangetic West Bengal, India. Singapore Journal of Tropical Geography, 27(2), 207-220.
- Shamshiry, E., Nadi, B., Mokhtar, M. B., Komoo, I., & Hashim, H. S. (2011, May). Disaster management base on
geoinformatics. In Communication Software and Networks (ICCSN), 2011 IEEE 3rd International Conference on (pp. 28-
31). IEEE.
- Sharma, A. K., Joshi, V., & Kumar, K. (2010). Use of remote sensing and GIS in disaster management in Gangtok area,
Sikkim. GIS development, 6(16).
- Sickels, E. (2014). 2004 Indian Ocean Tsunami. prezi.com. Retrieved 3 January 2017, from
https://prezi.com/xm6ylpbsonig/2004-indian-ocean-tsunami/
- Smara, Y., AICHOUCHE BELHADJ-AISSA, A., & Belhadj-Aissa, M. (2005). Application of GIS and Remote Sensing
Technologies in Disaster Management in Algeria. Pharaohs to Geoinformatics.
- Smith, K. (2013). Environmental hazards: assessing risk and reducing disaster. Routledge.
- Tanasescu, V., Gugliotta, A., Domingue, J., Davies, R., Gutiérrez-Villarías, L., Rowlatt, M., ... & Stinčić, S. (2006,
November). A semantic web services GIS based emergency management application. In International Semantic Web
Conference (pp. 959-966). Springer Berlin Heidelberg.
- Teeuw, R. M., Leidig, M., Saunders, C., & Morris, N. (2012). Free or low-cost geoinformatics for disaster management:
Uses and availability issues. Environmental Hazards, 12(2), 112-131.
32. 32
- Teillet, P. M., Barker, J. L., Markham, B. L., Irish, R. R., Fedosejevs, G., & Storey, J. C. (2001). Radiometric cross-
calibration of the Landsat-7 ETM+ and Landsat-5 TM sensors based on tandem data sets. Remote sensing of
Environment, 78(1), 39-54.
- Tralli, D. M., Blom, R. G., Zlotnicki, V., Donnellan, A., & Evans, D. L. (2005). Satellite remote sensing of earthquake,
volcano, flood, landslide and coastal inundation hazards. ISPRS Journal of Photogrammetry and Remote Sensing, 59(4),
185-198.
- Van Oosterom, P., Zlatanova, S., & Fendel, E. (Eds.). (2006). Geo-information for disaster management. Springer Science
& Business Media.
- van Westen, C. J. (2000). The modelling of landslide hazards using GIS.Surveys in Geophysics, 21(2- 3), 241-255.
- Vijayaraghavan, C., Thirumalaivasan, D., & Venkatesan, R. (2012). Utilization of remote sensing and GIS in managing
disasters–a review. International Journal of Scientific & Engineering Research, 3(1), 1-8.
- Voigt, S., Kemper, T., Riedlinger, T., Kiefl, R., Scholte, K., & Mehl, H. (2007). Satellite image analysis for disaster and
crisis-management support. IEEE transactions on geoscience and remote sensing, 45(6), 1520-1528.
- Walford, A. (2007). Photogrammetry. Photogrammetry.com. Retrieved 1 January 2017, from
http://www.photogrammetry.com/
- Waugh, W. L. (1999). Living with hazards, dealing with disasters: An introduction to emergency management. ME
Sharpe.
33. 33
6.0 Appendices
Figure 13. Example flow diagram shown the progression of the landslide inventory. Source: (NOAH,
2014)
34. 34
Figure 14. a) Alluvial fans and debris flows simulation. B) Google earth imagery. C) Bing imagery.
Source: (NOAH, 2014)