Download to read offline
![488 B. B¨ chele et al.: Flood-risk mapping:...extreme events and associated risks
u
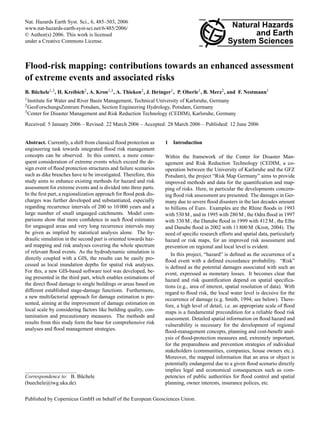
Table 1. Overview of methods and data for high-resolution flood-risk mapping in Germany. The left column (basic approaches) indicates
minimum requirements on data and analysis expenses, the right column stands for more detailed approaches (additional requirements, only
in particular cases needed/possible). Parts in bold letters are addressed in this article.
Basic approach More detailed approach (higher spatial
(minimum requirements) differentiation, inclusion of dynamic
aspects)
Regional estimation of
flood discharges – Extreme value statistics (mainly – Rainfall-runoff simulation for
for gauged basins) extreme flood events
– Regionalization of flood param- – Long-term simulation of flood
eters (for ungauged basins) variability (probabilistic evalu-
ation, e.g. climate trends)
Estimation of local hy-
draulic impacts – Documentation of historical wa- – assessment of flow situation based
ter levels/inundation zones (vary- on 2-D HN models (e.g., spa-
ing availability/quality) tial distribution of flow veloci-
– Calculation of water levels and ties/directions)
inundation zones/depths based – unsteady hydrodynamic simula-
on hydraulic models and digi- tion of extreme flood scenarios
tal terrain models (local scale, (e.g., impact of dike failures)
e.g. 1:5000)
– Simplified approaches (only
large-scale, e.g. 1:50 000)
Damage estimation
– stage-damage curves for aggre- – stage-damage curves for indi-
gated spatial data (e.g., ATKIS- vidual buildings or land-units
data) (e.g., ALK-data)
– consideration of further
damage-determining factors
(e.g., flow velocity, precau-
tionary measures, warning
time)
Beside the gauge-specific flood quantiles, the following These eight parameters, especially hN G and LF , were
eight parameters as spatial data sets for approximately 3400 identified as significant for the peak discharge. LF is an em-
catchment areas are taken into account by the regionalization pirical factor and represents all kind of regional influences,
approach. particularly geological characteristics. Together, they are
AE0 catchment area [km2 ] taken into account in the following multiple linear regres-
S percentage of urban area [%] sion equation, which is used asapproach for flood quantile
W percentage of forest area [%] estimation (i.e. MH Q and H QT ) especially for ungauged
Ig weighted slope [%] sites:
L length of flow path from head of catchment
to mouth [km] ln (Y ) = C0 + C1 × ln AE0 + C2 × ln (S + 1)
LC length of flow path from center of catchment +C3 × ln (W + 1) + C4 × ln Ig + C5 × ln (L) (1)
to mouth [km] +C6 × ln (LC ) + C7 × ln (hNG ) + C8 × ln (LF )
hN G mean annual precipitation depth [mm]
LF landscape factor [–]
Nat. Hazards Earth Syst. Sci., 6, 485–503, 2006 www.nat-hazards-earth-syst-sci.net/6/485/2006/](https://image.slidesharecdn.com/risksreading1-121207042028-phpapp02/85/Risks-reading1-4-320.jpg)
![B. B¨ chele et al.: Flood-risk mapping:...extreme events and associated risks
u 489
with: 0.20 0.5
Y, YT dependant variable:
C8
Y =MH q for regionalization of MH Q 0.15 0.0
C7
YT =HqT /MH q for regionalization of H QT
MH q mean annual peak discharge per unit area 0.10 -0.5
[m3 /(s×km2 )]
C8
C7
H qT annual peak discharge per unit area 0.05 -1.0
[m3 /(s× km2 )] of recurrence interval T
C0 ...C8 regression coefficients 0.00 -1.5
The regression coefficients C0 ...C8 are estimated based
on the gauge-specific flood estimates and the above men- -0.05 -2.0
1 10 100 1000 10000
tioned spatial data sets (available in LfU, 2005b) using recurrence interval T [a]
the method of least squares. The application of this ap-
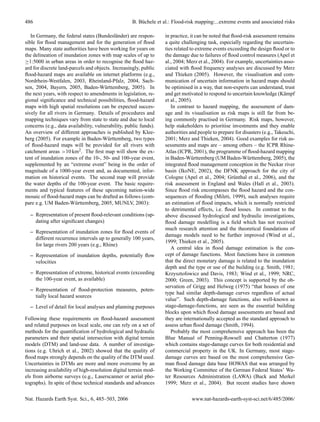
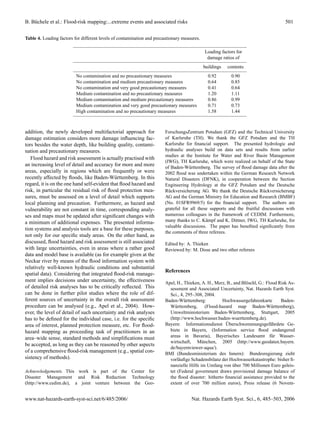
proach requires two steps. First, MH q is estimated using Fig. 1. Progression of regression coefficients C7 and C8 for recur-
Eq. (1). Subsequently, H QT in unit [m3 /s] is determined rence intervals T from 2 to 10 000 years.
using YT =H qT /MH q in Eqs. (1) and (2):
H QT = YT × MH q × AE0 = YT × MH Q (2) for this specific gauge it may be noticed that the regional-
ization approach is able to reproduce the shape of the sta-
Recently, this approach was extended to recurrence intervals
tistical distribution. At the same time, the 95%-confidence
of 200 to 10 000 years using a selection of 249 gauges and
interval for the statistical distribution (dashed lines) is indi-
applied to a more detailed spatial data set (6200 locations
cating substantial uncertainties, especially in the area of ex-
of the river network, LfU 2005b). The selection of gauges
trapolation (for this sample: about 25% for all H QT with
was done considering the record length and the quality of
T≥100 years). Summing up, the deviations between region-
the flow series in order to achieve more reliable model ad-
alization and flood-frequency analysis vary among the men-
justments for low-frequency events. The present regionaliza-
tioned 249 gauges as presented in Fig. 3. The mean devia-
tion approach is thus consisting of 13 regression equations,
tion is <2.5% at approx. 40% of the gauges, <7.5% at ap-
i.e. one equation for MH Q and each H QT for T from 2 to
prox. 75% and <12.5% at approx. 90%. The deviation is
10 000 years. The coefficients (C0 –C8 ) of these equations
>20% at approx. 3% of the gauges where generally human
are fully documented in LfU (2005b), at which the corre-
activities (e.g., urban drainage systems) or karst conditions
sponding coefficients of determination are R 2 >0.99 for all
are present. Figure 4 illustrates a sample map of the region-
single recurrence intervals (logarithmic analysis). As Fig. 1
alization approach for H q1000 in Baden-W¨ rttemberg. Ac-
u
exemplifies for C7 and C8 (compare Eq. 1), the coefficients
cording to this sample, the highest peak discharges per unit
show a homogeneous progression upon the whole spectrum
area occur in the mountainous regions of the Black Forest
of recurrence intervals, although they are estimated sepa-
(Upper Rhine Basin) and the upper Neckar Basin.
rately for each recurrence interval. To enable user-specific
estimates, the complete spatial data sets and a calculation To substantiate the regionalization approach especially for
tool for the regionalization approach are integrated in a ge- small ungauged catchment areas, the results can be compared
ographical information system (LfU, 2005b), which is dis- to outcomes of rainfall-runoff (RR) models which are sup-
tributed as stand-alone software to local authorities and plan- posed to build on a better representation of catchment char-
ning companies. By these means, regionalized MH Q and acteristics. This was done here for the Fils catchment, a
H QT are provided for any user-defined location of the river tributary to the Neckar River (707 km2 , see Fig. 4), where
network in Baden-W¨ rttemberg, completed by analogous in-
u a RR-model (software see Ihringer, 1999) is available from
formation at 375 gauges and longitudinal profiles for 163 ma- a hydrological study on local flood problems. Within the
jor rivers. Furthermore, the extension of the regionalization RR-model, the catchment is represented by 907 subareas
approach to very high recurrence intervals supports the ongo- and 1501 nodes for the drainage network, considering a to-
ing state-wide elaboration of flood hazard maps and regional tal urban area of 92 km2 , 331 stormwater holding tanks of
dam safety analyses. urban drainage systems and 7 flood-retention basins. As
input of the RR-model, rainfall statistics provided by the
2.3 Model results, comparisons and discussion German Weather Service (DWD, 1997) were used; these
rainfall statistics cover recurrence intervals from 1 to 100
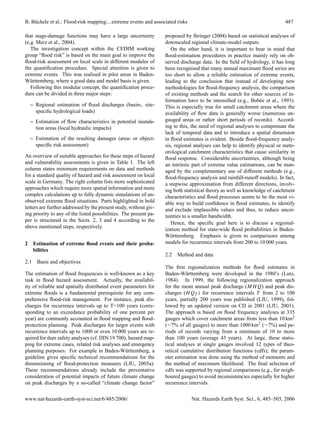
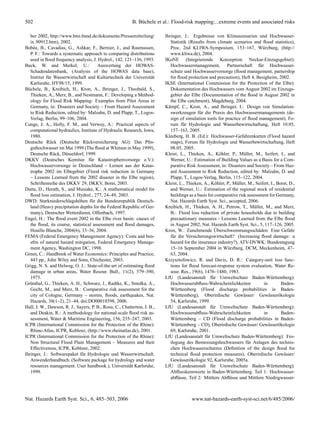
A comparison of at-site and regional flood-frequency anal- years for different duration classes from 0.5 to 72 h. For the
ysis is exemplified in Fig. 2 for the Fils river in Plochin- assessment of higher peak discharges, the mean precipita-
gen showing that the regionalized H QT (squares) are very tion depths for the different duration classes were extrapo-
similar to the statistical distribution for the annual maximum lated. However, different precipitation characteristics (dura-
flood series 1926–2002 (solid line). Beyond the agreement tion classes) cause a set of different flood peaks. Therefore,
www.nat-hazards-earth-syst-sci.net/6/485/2006/ Nat. Hazards Earth Syst. Sci., 6, 485–503, 2006](https://image.slidesharecdn.com/risksreading1-121207042028-phpapp02/85/Risks-reading1-5-320.jpg)
![490 B. B¨ chele et al.: Flood-risk mapping:...extreme events and associated risks
u
0 .0 1 1 0 0 0 0
5 0 0 0
0 .0 5
g a u g e P lo c h in g e n / F ils 2 0 0 0
N o v 1 9 2 6 - O c t 2 0 0 2 ; 7 6 v a lu e s
[% ]
0 .1 0 1 0 0 0
[a ]
5 0 0
e x c e e d a n c e p r o b a b ility
0 .5 0 2 0 0
r e c u r r e n c e in te r v a l T
1 .0 0 1 0 0
2 .0 0 5 0
5 .0 0 2 0
1 0 .0 0 1 0
2 0 .0 0 5
5 0 .0 0 c o n fid e n c e in te r v a l 2
= 9 5 %
L O G - N O R M A L -2
9 5 .0 0 P L O T T IN G P O S
H Q R e g io n a l.
1 2 3 4
1 0 1 0 1 0 1 0
a n n u a l p e a k d is c h a r g e H Q [m ³/s ]
Fig. 2. Comparison of H QT from regionalization (as squares) with flood-frequency analysis at Plochingen/Fils (location see Fig. 4, annual
peak discharges 1926–2002 as plotting positions, Log-Normal distribution as solid line, 95%-confidence interval as dashed lines).
70
MHQ
percentage of gauges (n = 249) [%]
60 HQ2
HQ5
50 HQ10
HQ20
40 HQ50
HQ100
30 HQ200
HQ500
20 HQ1000
HQ2000
10
HQ5000
HQ10000
0
-5 ± 2,5
< -30
0 ± 2,5
5 ± 2,5
-25 ± 2,5
-20 ± 2,5
-15 ± 2,5
-10 ± 2,5
10 ± 2,5
15 ± 2,5
20 ± 2,5
25 ± 2,5
> 30
classified deviation [%]
(regionalized HQT vs. HQT from statistical analysis at gauges)
Fig. 3. Comparison between regionalization and flood-frequency analysis at 249 gauges in Baden-W¨ rttemberg: classified deviations [%]
u
for MH Q and H QT for T =2, ..., 10 000 a (bars from left to right).
the maximum peak of a set representing the relevant spec- eas (especially for H Q1000 <10 m3 /s). The variation around
trum of precipitation characteristics was chosen to estimate the bisecting line, standing for a perfect agreement of both
the 1000-year quantile according of this approach. This value models, can be understood as residual uncertainty of the mu-
is compared to the quantile estimated from the regionaliza- tual application of both models for these specific catchment
tion approach based on observed flood peaks. Figure 5 shows areas. The deviations may be further discussed taking more
a comparison of 1000-year peak discharges of both mod- knowledge on local characteristics into account, that was not
els (H Q1000 from regionalization and RR). According to the yet used in one or both models (e.g., outlets of urban drainage
spatial discretization of the regionalization approach, 265 lo- systems). Mathematically, the deviations between both mod-
cations of the drainage network are plotted. The axes are log- els amount to <7.5% for 66% of all 265 plotted locations,
arithmic in order to visualise the small values better. It can be <12.5% for 82% and >30% for 3% of these locations. The
concluded that the results match fairly well with tendencies latter belong to smaller areas respectively peak discharges
to higher deviations between both approaches in smaller ar- (e.g., 6.96 m3 /s from regionalization versus 11.02 m3 /s from
Nat. Hazards Earth Syst. Sci., 6, 485–503, 2006 www.nat-hazards-earth-syst-sci.net/6/485/2006/](https://image.slidesharecdn.com/risksreading1-121207042028-phpapp02/85/Risks-reading1-6-320.jpg)
![B. B¨ chele et al.: Flood-risk mapping:...extreme events and associated risks
u 491
Fig. 4. Regionalized H q1000 in Baden-W¨ rttemberg; location of sample gauge in Plochingen (Fils catchment, 704 km2 ).
u
RR, Fig. 5) where the RR-model – in general – may recog- 1000
nise local influences better. Therefore, more confidence may
be given to the regionalized H QT as implied by statistical
HQ1000 from RR-model [m³/s]
analysis alone (Fig. 2). 100
In view of the needs of practitioners, a coherent and ro-
bust approach for regional flood estimates is thus available
and broadly established in a state-wide sense. Uncertainties 10
of this approach concerning local distinctions call for hydro-
logical justifications of the plausibility of flood estimates on
local scale. The model comparison strategy seems to be the 1
1 10 100 1000
logical way for model validation and practically the unique HQ 1000 from regionalization [m³/s]
chance to reduce uncertainties effectively in areas where the
availability of flow records is scarce. This is valid not only Fig. 5. Comparison of peak discharges calculated by regionalization
in spatial sense (ungauged areas) but also for the extrapola- and RR-model: H Q1000 at 265 locations of the drainage network
tion to very long recurrence intervals. Apart from its practical in the Fils catchment.
use for regional flood estimates, the regionalization approach
leads from at-site flood frequency analysis to distributed hy-
drologic modelling of flood events, enabling a vice-versa re-
view and mutual enhancement of these methods. the flow patterns in a given river section are characterised
by compact and coherent streamlines, 1-dimensional (1-D)
HN-models are considered as adequate for the estimation
3 Hydrodynamic modelling for extreme floods of flood-water levels and delineation of inundation zones
(e.g., Baden-W¨ rttemberg, 2005). In cases with more com-
u
3.1 Basis and objectives plex river geometries and flow patterns (e.g., at river con-
fluences or other complex flow conditions), 2-dimensional
To quantify flood hazard and risk in urban areas or at (2-D) models are used for a spatially differentiated hydraulic
individual locations, flood discharges (e.g., H Q100 ) have analysis, especially when local parameters like flow direc-
to be transformed into hydraulic parameters like water tion, flow velocity, shear stress, etc. are requested. Depend-
levels, inundation depths or flow velocities by means of ing on the intended purposes, both types of models (1-D, 2-
hydrodynamic-numerical (HN) models. In many cases when D) may be applied for stationary flow conditions (e.g., hazard
www.nat-hazards-earth-syst-sci.net/6/485/2006/ Nat. Hazards Earth Syst. Sci., 6, 485–503, 2006](https://image.slidesharecdn.com/risksreading1-121207042028-phpapp02/85/Risks-reading1-7-320.jpg)
![B. B¨ chele et al.: Flood-risk mapping:...extreme events and associated risks
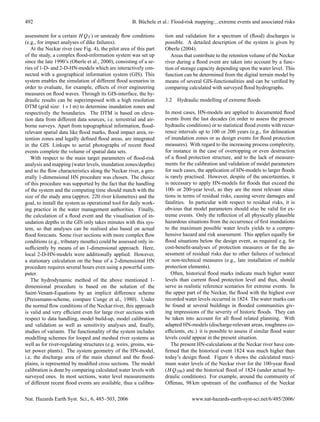
u 493
River with the Rhine River, the historical water level of 1824 155.0
Flood marks 1824
was approximately 2.5 m higher than the dikes that have been 154.0 HW 1824
HQ200
built for a 100-year flood. 153.0
HQ100
It has to be emphasised that the consideration of extreme 152.0 HQ50
water level [m asl]
HQ20
historical events can not only support flood awareness as re- 151.0
HQ10
alised scenarios (under historical conditions), but also used 150.0
as reference for the analysis of potential extreme cases un- 149.0
der present conditions. In this regard, the intention here was 148.0
not to reconstruct historical hydraulic conditions or to ver- 147.0
ify historical information in terms of peak discharges. The 146.0
results shown can help, for example, to assess the proba- 145.0
106.0 104.0 102.0 100.0 98.0 96.0 94.0
bility of flood events that cause comparable water levels in Neckar-km
the actual situation. In terms of a reconstruction of histori-
cal discharges, a further investigation on historical hydraulic Fig. 6. Maximum water levels along the Neckar river for statistical
boundary conditions is required (Oberle, 2004). However, flood events H QT with T =10, 20, ..., 200 years) and the historical
due to the limited historical data availability and quality, ma- event 1824 (HW1824), the latter as reconstructed from water-level
jor uncertainties are expected. marks. Note location of the community Offenau at the river Neckar
(98 km upstream of the confluence with the river Rhine).
3.3 Hazard mapping
The above presented hydrological and hydraulic models, and Green, 2000), the largest part of the literature on flood
i.e. the regionalization approach for the estimation of ex- damage concerns direct tangible damage (Merz and Thieken,
treme events (H QT ) as well as the GIS-based flood informa- 2004). The present study is limited to direct monetary flood
tion system for the Neckar river served as basis for the gen- damage to buildings and contents of private households.
eration of hazard maps with prototype character in a state- As outlined above, stage-damage-functions for differ-
wide sense. For example, hazard maps for the lower Neckar ent building types or building uses are an internationally
river (Figs. 4 and 6) are published on the -internet platform accepted standard approach for flood damage estimation.
(Baden-W¨ rttemberg, 2005).
u While the outcome of most stage-damage functions is the
absolute monetary loss to a building, some approaches pro-
vide relative depth-damage functions, determining the dam-
4 Flood-damage estimation
age e.g. in percentage of the building value (e.g. Dutta et al.,
4.1 Basis and objectives 2003). If these functions are used to estimate the loss due
to a given flood scenario property values have to be prede-
Based on the knowledge of accumulated values in the areas at termined (Kleist et al., 2004, 2006). However, using these
risk and relationships between event parameters and resulting functions, one has to be aware that the damage estimation is
damage, flood risks can be identified and quantified, i.e. ex- generally associated with large uncertainties as recent stud-
pected damages for a given flood scenario can be calculated. ies asserted (Merz et al., 2004). One approach to reduce the
This information about flood risk for individual buildings, uncertainty connected with stage-damage functions is their
settlement areas and river basins is indispensable to inform specific adjustment to the area of interest (Buck and Merkel,
the population and stakeholders about the local flood risk, 1999). This strategy was followed here, supported by inten-
for planning of flood control measures and for benefit-cost sive on-site investigations of the building structure in some
analyses of these measures. pilot areas along the Neckar river.
The comprehensive determination of flood damage in- Recent flood events have shown that during slowly rising
volves both, direct and indirect damage. Direct damage is river floods the maximum water level during the flood event
a damage which occurs due to the physical contact of flood is responsible for the resulting damage. In these cases, the
water with human beings, properties or any objects. Indirect gradient of the flood wave is small and for this reason there
damage is a damage which is induced by the direct impact, are no damaging effects due to flow velocity impacts. Ma-
but occurs – in space or time – outside the flood event. Ex- jor damages are caused by wetting of contents and building
amples are disruption of traffic, trade and public services. structure in the cellar and the ground floor. This does not
Usually, both types are further classified into tangible and in- apply for flash floods e.g. in mountainous areas where, due
tangible damage, depending on whether or not these losses to high flow velocity, buildings may collapse partly or to-
can be assessed in monetary values (Smith and Ward, 1998). tally. Therefore, it is obvious that flood damage depends,
Although it is acknowledged that direct intangible damage or in addition to building type and water depth, on many factors
indirect damage play an important or even dominating role which are not considered using stage-damage functions. One
in evaluating flood impacts (FEMA, 1998; Penning-Rowsell factor is the flow velocity, but there are also others like the
www.nat-hazards-earth-syst-sci.net/6/485/2006/ Nat. Hazards Earth Syst. Sci., 6, 485–503, 2006](https://image.slidesharecdn.com/risksreading1-121207042028-phpapp02/85/Risks-reading1-9-320.jpg)
![B. B¨ chele et al.: Flood-risk mapping:...extreme events and associated risks
u 495
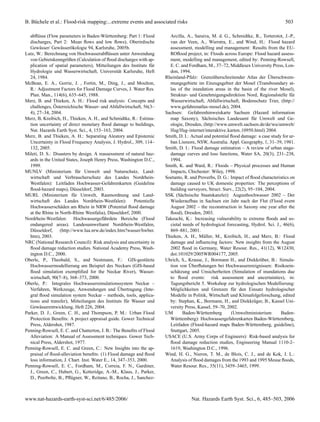
the ground floor elevation and the height of the flood-sill for 1.0
each single object. Thus, local object features and protection 0.9
measures can be considered. 0.8
0.7
The damage estimation is based on the general assump-
damage ratio [-]
0.6
tion that the monetary damage depends on the type and use
0.5
of the building. One of the basic studies was performed by
Linear Polygon Function
0.4
Penning-Rowsell and Chatterton (1977). In the Blue man- Square-root Function, b=0.5
0.3
ual, stage-damage functions for residential buildings in the Square-root Function, b=0.4
0.2 Point-based Power Function C=0.8
UK were derived for age and type of the buildings, the du- Point-based Power Function C=3.0
0.1
ration of the flood event and the social class of the inhabi- User-defined points
0.0
tants. The damages are differentiated for building fabric and 0.0 0.5 1.0 1.5 2.0 2.5
contents. Other similar international studies were done by water depth [m]
Wind et al. (1999); Smith (1994); Parker et al. (1987). In
Germany, in the HOWAS database, some 3600 single dam- Fig. 7. Examples of function types used in the GIS-based damage
age cases for different objects are included. The damage data analysis tool.
were collected after different flood events in Germany. Anal-
yses by Buck and Merkel (1999) showed that for practical
the damage estimation tool as second function type, where
uses, damage estimation with a root function provides rea-
the parameter b is user-defined:
sonable results. √
Due to the fact that the absolute damage depends on a S =b× h (4)
variety of factors being specific for every single building
or land parcel, a meaningful damage estimation can be ex- with S=estimated damage, h=water depth, b=user-defined
pected from the application of such stage-damage functions parameter.
and their adaptation for individual objects or – in terms of The parameter b characterises the damage for h=1 m.
exposure and vulnerability – uniform spatial units. For that Hence, using Eq. (4), the damage progression can be de-
reason, the possibility to apply different functions was imple- scribed with only one parameter. For the sample damage es-
mented in this software module, where the user can choose timation in this paper (see below), the damage functions for
at least one of the three following function types: 1. Lin- different building types in the project area were chosen based
ear Polygon Function, 2. Square-Root Function, or 3. Point- on the flood-damage database HOWAS (Buck and Merkel,
based Power Function. 1999).
– Point-based Power Function
– Linear Polygon Function
In some cases, damage does not occur until the stage rises to
The user interface allows to enter 5 pairs of variates (hi/Si) a threshold height in the building. For example in rooms or
of water-depth and damage, which are interpolated sectional storeys, where floors and walls are tiled, damage can be neg-
with linear functions. Between the minimum (i=1) and max- ligible until the water level affects the electrical installation
imum (i=5) pair, the function can be noted: (power sockets). On the other hand, the maximum damage
is often obtained, when the contents are submerged; a fur-
Si+1 − Si ther rise of the water level does not increase the damage in
S = Si + × (h − hi ) , hi ≤ h < hi+1 (3)
hi+1 − hi a relevant manner. For these cases, a power function can be
chosen in the tool, where the points of first and maximum
where S = estimated damage, Si , hi = user-defined nodes of
damage as well as the exponent C determining the gradient
the function, h=water depth.
of the function can be individually defined.
The first pair of variates (h1 /S1 ) defines the minimum wa-
1
ter depth below which the damage is zero. The last point S0 S0 h − h0 C
(h5 /S5 ) sets the possible maximum damage; for water depths S = Smax × + 1− × (5)
Smax Smax hmax − h0
above the damage stays constant. The Polygon function (3)
allows a simple adaptation to individual damage symptoms with S=estimated damage, h=water depth, (h0 /S0 )=point
of different types of objects. of first damage, (Smax / hmax )=point of maximum damage,
C=user-defined exponent.
– Square-Root Function The three function types (Eqs. 3–5) are exemplified in
Fig. 7.
In practical view, square-root stage-damage functions pro- The creation, editing, and choice of these three functions
vide good results for damage estimation (Buck and Merkel, are realised by different masks that allow the user to con-
1999). Therefore, a square-root function is implemented in veniently handle the input. For the Polygon and the Power
www.nat-hazards-earth-syst-sci.net/6/485/2006/ Nat. Hazards Earth Syst. Sci., 6, 485–503, 2006](https://image.slidesharecdn.com/risksreading1-121207042028-phpapp02/85/Risks-reading1-11-320.jpg)
![496 B. B¨ chele et al.: Flood-risk mapping:...extreme events and associated risks
u
Table 2. Standardized damage to buildings and inundated areas for the test community.
Exceedance Affected buildings [–] Inundated area [m 2 ] Standardized
probability [%] residential total residential settlement damages [%]
10 4 8 4000 6000 0.002
5 14 40 15 000 29 000 0.01
2 71 126 41 000 71 000 53
1 127 242 81 000 129 000 100
0.50 223 378 143 000 220 000 194
0.20 237 403 156 000 237 000 215
0.10 266 447 174 000 267 000 255
0.05 296 496 192 000 298 000 304
0.02 328 540 203 000 326 000 364
0.01 342 571 207 000 341 000 400
Fig. 8. GIS-based damage analysis tool (screenshot of graphical user interface). The damage or the general involvement can be calculated
by selecting the area of interest, land-use and event information and damage-relevant factors.
function types, the damage can be calculated in absolute a range of events, beginning from the flood causing the first
monetary units (EUR) or percentages of damage. damage up to the 1000-year event. The damage values in
Fig. 9 are standardized to the 100-year event. That means for
Before starting the calculation, a flood event must be se-
example, that the damage caused by the 1000-year flood is
lected. According to the coupling of the damage estimation
approximately 2.6 times higher than the one caused by the
tool to the flood information system for the Neckar river,
100-year event.
the outcomes of the hydraulic calculations, i.e. water sur-
faces, can be directly used as input of the damage estimation.
Furthermore, the tool includes functionalities to cope with
The implementation of the damage estimation tool in a GIS-
cases where detailed land-use data (e.g. ALK) are not avail-
software environment is realised in four dialogue modules
able or where the assessment could be simplified. As
shown in Fig. 8.
revealed in Table 2, it is possible to make assumptions
Hence, the GIS-based damage estimation tool enables the e.g. about the number of affected houses in flood-prone ar-
user to assess the flood damage to single buildings in flood- eas, in order to give an overview on flood risk without ex-
prone areas and the spatial aggregation of the event-specific plicitly calculating monetary damage. For damage calcula-
damage for a defined group of buildings or areas. Figure 9 tions on a more aggregated spatial level, the values at risk can
shows the calculated damage values for a test community for be derived from statistical data for administrative districts
Nat. Hazards Earth Syst. Sci., 6, 485–503, 2006 www.nat-hazards-earth-syst-sci.net/6/485/2006/](https://image.slidesharecdn.com/risksreading1-121207042028-phpapp02/85/Risks-reading1-12-320.jpg)
![B. B¨ chele et al.: Flood-risk mapping:...extreme events and associated risks
u 497
and related to their spatial unit (EUR/m2 ). In this case, the 10.00
damage estimation can be delivered by spatial intersection
of flood-hazard information (inundation zone) with land-use
exceedence probability [%]
data (e.g. ATKIS) in order to calculate the extension of the 1.00
inundated settlement area (see columns 4 and 5 in Table 2).
Usually, the flood-damage calculation is provided for cost-
benefit analyses of flood protection measures. For this pur- 0.10
pose, the costs of a flood-protection measure can be com-
pared to its benefit, i.e. the avoided damage up to the design
event respectively the residual risk after the implementation
0.01
of the measure, normally expressed as mean annual damage 0.0 1.0 2.0 3.0 4.0 5.0
(MAD). For the above mentioned sample community, a dike standardized damage [-]
designed for a 100-year event provides a significant reduction
of MAD, but the residual risk due to a larger flood event still Fig. 9. Standardized damage to residential buildings in a test
community for annual exceedance probabilities from 0.1 to 0.0001
accounts for approximately 40 percent of the original value.
(i.e. damage to a 100-year flood=1, situation without flood protec-
The main advantage of the presented damage estimation tion measure).
on a local scale is that the damage-determining factors are
given both on the hazard side (being in general the water
depth) as well as on the side of vulnerability (stage-damage a building-specific random sample of households was gener-
functions for individual objects). For estimations on an ag- ated, and always the person with the best knowledge about
gregated spatial level, where areas of the same building type the flood damage in a household was interviewed. An in-
may be defined (e.g. ATKIS-data) but no information on in- terview comprised around 180 questions and lasted about
dividual objects is available, one has to make assumptions on 30 min. The computer-aided telephone interviews were un-
the spatial distribution of buildings and building types. Fur- dertaken by the SOKO-Institute, Bielefeld. Detailed descrip-
thermore, as the water depth in an inundated area varies in tions of the survey were published by Kreibich et al. (2005)
space, the definition of the damage-determining water level and Thieken et al. (2005).
gets more uncertain with increasing spatial units. Thus, us- Statistical analysis was undertaken with the software SPSS
ing stage-damage functions, one has to define the damage- for Windows, version 11.5.1. and Matlab, version 7.0.1.
relevant depth or use a statistical approach to estimate the Since a big share of the resulting data show skewed distribu-
spatial distribution. tions, the mean and the median are given. Significant differ-
ences between two independent groups of data were tested
4.3 Development of a multifactorial approach for damage by the Mann-Whitney-U-Test, for three or more groups of
estimation data the Kruskal-Wallis-H-Test was applied. For all tests a
significance level of p<0.05 was taken.
4.3.1 Damage data of the extreme flood in August 2002
4.3.2 Factors influencing the flood damage
Since flood damage is also influenced by other factors be-
sides the water depth, more knowledge about the connections Flood damage influencing factors can be divided into im-
between actual flood losses and damage-determining factors pact factors like water depth, contamination, flood duration,
is needed for the improvement of damage estimation. There- flow velocity and resistance factors like type of building, pre-
fore, during April and May 2003 in a total of 1697 private ventive measures, preparedness, and warning (Thieken et al.,
households along the Elbe River, the Danube River and their 2005).
tributaries, people were interviewed about the flood damage During the extreme flood in August 2002, for exam-
to their buildings and household contents caused by the Au- ple, contamination led to significantly higher damage ratios
gust 2002 flood as well as about flood characteristics, precau- (fraction of the flood damage in relation to the total value)
tionary measures, warning time, socio-economic variables, to buildings and contents (Fig. 10). The damage ratio of
regional and use-specific factors. The 2002 flood was an ex- contents was increased by 93% for high contamination in
treme event, e.g., with a discharge return period of 150–200 comparison with no contamination. For building damage it
years at the river Elbe in Dresden and with a return period was increased by more than 200%. During the 1999 flood
of 200–300 years at the river Mulde in Erlln (IKSE, 2004). in Bavaria oil contamination on average led to a three times
Detailed descriptions were published by e.g. DKKV (2003), higher damage to buildings, in particular cases even to total
Engel (2004), IKSE (2004). The total damage in Germany is loss (Deutsche R¨ ck, 1999).
u
estimated to be 11.6 billion . The most affected federal state On the resistance side, private precautionary measures sig-
was Saxony where the total flood damage is estimated to be nificantly reduce the flood loss even during an extreme flood
8.6 billion (BMI, 2002; SSK, 2003). In the affected areas, like the one in 2002 (Fig. 11). The damage ratio of contents
www.nat-hazards-earth-syst-sci.net/6/485/2006/ Nat. Hazards Earth Syst. Sci., 6, 485–503, 2006](https://image.slidesharecdn.com/risksreading1-121207042028-phpapp02/85/Risks-reading1-13-320.jpg)
![498 B. B¨ chele et al.: Flood-risk mapping:...extreme events and associated risks
u
60 3550 25
30
damage ratio contents [%]
damage ratio building [%]
damage ratio contents [%]
50
damage ratio building [%]
40 20
25
40
30 15
20 n=119
n=151
30
n=528 1520 n=408 10
20
n=459 10
10 5
10 n=410
5
n=927 129 101
0 0 0
0
no medium high no medium very good
no medium high
contamination precautionary measures
contamination
50
35 25
damage ratio contents [%]
damage ratio building [%]
30
40 20
damage ratio building [%]
25
30 15
20 n=119
n=151
20
15 10
n=408
10
10 5
n=410
5 n=927 129 101 723 122 101
0 0
0 no medium very good no medium very good
igh no medium high
precautionary measures precautionary measures
contamination
Fig. 11. Damage ratios of residential buildings and contents in-
Fig. 10. Damage ratios of residential buildings and contents in- fluenced by different levels of precautionary measures. The pre-
fluenced by different levels of contamination. The contamination caution classes “medium” and “very good” take into account the
classes “medium” and “high” take into account the type of contam- type of precaution (e.g. informational precaution, adapted use, wa-
ination (e.g. chemicals, sewage, oil) and if single, double or triple ter barriers) and how many precautionary measures have been ap-
contaminations occurred (bars=means; dots=medians and 25–75% plied (bars=means; dots=medians and 25–75% percentiles).
percentiles).
was reduced by 55% for very good precautionary measures
in comparison with no measures. For building damage it was Interestingly, flow velocity was not identified as one of the
decreased by 63%. This positive effect of precautionary mea- main damage influencing factors. As well, a comprehensive
sures is noteworthy since it is believed that these measures study about the main factors influencing flood damage to pri-
are mainly effective in areas with frequent flood events and vate households after the 2002 flood revealed, that flood im-
low flood water levels (ICPR, 2002). An investigation of sin- pact variables (e.g., water level, contamination) were the fac-
gle precautionary measures revealed flood adapted use and tors mostly influencing building as well as content damage
furnishing as the most effective measures during the extreme (Thieken et al., 2005). Flow velocity, however, influenced the
flood in August 2002 (Kreibich et al., 2005). They reduced damage to a small fraction. Also during a survey about the
the damage ratio for buildings by 46% and 53%, respec- impact of six flood characteristics on flood damage, build-
tively. The damage ratio for contents was reduced by 48% ing surveyors in the United Kingdom assessed flow veloc-
due to flood adapted use and by 53% due to flood adapted ity to be the least important factor (Soetanto and Proverbs,
furnishing. The International Commission for the Protec- 2004). Since it is known that flow velocity plays a crucial
tion of the Rhine gives a good overview on the effects of role in mountainous regions, it should be further investigated
private precautionary measures in their report “Non Struc- whether it will be identified as a main influencing factors, if
tural Flood Plain Management – Measures and their Effec- the damage cases are divided in accordance to the dominat-
tiveness” (ICPR, 2002). ing flood type (i.e. flash flood and slowly rising river flood).
Nat. Hazards Earth Syst. Sci., 6, 485–503, 2006 www.nat-hazards-earth-syst-sci.net/6/485/2006/](https://image.slidesharecdn.com/risksreading1-121207042028-phpapp02/85/Risks-reading1-14-320.jpg)
![B. B¨ chele et al.: Flood-risk mapping:...extreme events and associated risks
u 499
Table 3. Statistical characterisation of damage ratios of buildings (upper value) and contents (lower value in brackets) of the sub-samples
“medium quality of buildings”.
Building type Water depth Damage ratio building (contents)
classified [cm] Mean CV* median 25%-perc 75%-perc n
one-family <21 0.04 1.56 0.02 0.01 0.04 133
house (0.10) (1.23) (0.05) (0.02) (0.13) (102)
21–60 0.07 1.07 0.04 0.02 0.09 42
(0.19) (0.97) (0.13) (0.06) (0.23) (47)
61–100 0.10 0.95 0.08 0.04 0.13 44
(0.35) (0.87) (0.24) (0.10) (0.52) (49)
101–150 0.22 0.71 0.19 0.10 0.32 54
(0.50) (0.59) (0.46) (0.25) (0.76) (63)
>150 0.24 0.70 0.22 0.13 0.33 84
(0.54) (0.56) (0.56) (0.34) (0.75) (104)
terraced and <21 0.03 1.44 0.02 0.00 0.05 55
semi-detached (0.08) (0.94) (0.06) (0.02) (0.12) (44)
houses 21–60 0.08 0.88 0.06 0.03 0.11 19
(0.26) (0.98) (0.16) (0.08) (0.43) (23)
61–100 0.11 0.77 0.09 0.04 0.13 16
(0.27) (0.87) (0.16) (0.11) (0.35) (21)
101–150 0.18 0.68 0.12 0.08 0.25 17
(0.45) (0.65) (0.37( (0.22) (0.54) (21)
>150 0.22 0.73 0.17 0.10 0.32 49
(0.54) (0.56) (0.49) (0.31) (0.86) (58)
apartment <21 0.03 1.70 0.01 0.00 0.03 70
building (0.10) (1.72) (0.03) (0.01) (0.10) (55)
21–60 0.10 1.24 0.05 0.03 0.11 33
(0.18) (1.23) (0.11) (0.06) (0.21) (36)
61–100 0.11 1.04 0.05 0.02 0.16 20
(0.29) (0.92) (0.22) (0.08) (0.48) (57)
101–150 0.13 1.01 0.10 0.04 0.15 34
(0.29) (0.92) (0.22) (0.08) (0.48) (57)
>150 0.18 1.04 0.12 0.06 0.25 45
(0.34) (0.94) (0.19) (0.08) (0.57) (62)
* CV: coefficient of variance
4.3.3 An approach for an improved damage estimation flood affected building it has to be decided to which sub-
class it belongs to so that its probable damage can be cal-
culated using the mean damage ratio of the respective sub-
Based on the above mentioned studies about damage-
class (Fig. 12). Data variability within the sub-samples (co-
influencing factors and the finding that the more factors are
efficients of variation (CV)), and therefore the uncertainty
specified, the lower the coefficient of variation within the
when applying the mean damage ratio as an estimate, were
data is (B¨ chele et al., 2004), the following multifactorial
u
highest for shallow water levels and apartment buildings (Ta-
approach for damage estimation was developed. The damage
ble 3). This might be due to large differences between build-
data of the 1697 interviewed households after the 2002 flood
ings concerning the quality of cellar contents and the water
was first divided into sub-samples according to the dam-
level above which damage occurs. This threshold depends
age influencing factors water level, building type (one-family
strongly on the location and shielding of cellar windows,
house (ofh), terraced and semi-detached houses (tsh), apart-
the level of the ground floor, interior accessories etc. Gen-
ment building (ab)) and quality of building (Table 3). Since
erally, apartment buildings might be more heterogeneous in
not all sub-classes for “very good quality of building (vg)”
size and value than one-family houses. This tendency in data
were filled, the statistics for “medium quality (m)” were cal-
variability was the same for damage ratios of building and
culated and a mean loading factor for all water levels was
contents whereas the data variability was generally slightly
estimated for the “very good quality”. Accordingly, for each
www.nat-hazards-earth-syst-sci.net/6/485/2006/ Nat. Hazards Earth Syst. Sci., 6, 485–503, 2006](https://image.slidesharecdn.com/risksreading1-121207042028-phpapp02/85/Risks-reading1-15-320.jpg)
![500 B. B¨ chele et al.: Flood-risk mapping:...extreme events and associated risks
u
ofh-m ofh-vg tsh-m tsh-vg ab-m ab-vg
80 ofh-m ofh-vg tsh-m tsh-vg ab-m ab-vg The difference in damage ratios between the building
80 types and qualities was smallest for lowest water levels
70 (Fig. 12). This is probably explained by relatively homoge-
mean damage ratio contents [%][%]
70
neous interior fittings and objects stored in the cellars of all
mean damage ratio contents
60
60 building types. A similar trend was also observed by McBean
50 et al. (1988) who differentiated the three water levels -1.8 m,
50
40
0.6 m, 2.4 m. Damage ratios of contents are very similar to
40 the ones used in a study in the Rhine catchment and also
30 the trend of higher contents damage in one-family houses
30
in comparison to apartment buildings is the same (MURL,
20
20 2000). In contrast, estimates of building damage are lower
10 in the “Rhine study”, which uses linearly increasing damage
10 ratios of buildings from 1% at a water level of 50 cm to 10%
0
0 < 21 cm 21-60 cm 61-100 cm 101-150 cm > 150 cm at a water level of 5 m (MURL, 2000).
< 21 cm 21-60 cm
water level cm 101-150 cm
61-100 classes > 150 cm Similarly, via the comparison of the sub-samples of dif-
water level classes ferent levels of contamination and precautionary measures,
ofh-m ofh-vg tsh-m tsh-vg ab-m ab-vg loading factors for these cases were calculated (Table 4).
ofh-m ofh-vg tsh-m tsh-vg ab-m ab-vg
35 The concept of loading or adjustment factors for flood dam-
35
age curves was already developed by McBean et al. (1988)
30
who calculated adjustment factors for flood warning, long-
mean damage ratio building [%]
30
mean damage ratio building [%]
25 duration floods and floods with high velocities or ice. Unfor-
25 tunately a differentiation between the building types was not
20 possible here, due to a lack of data. Since only a very limited
20
number of households which had undertaken precautionary
15 measures experienced high contamination (n=21), it is sus-
15 loading
loading1.57
factor: pected that precautionary measures are largely able to avoid
10 factor: 1.57
10 contamination and these cases can be neglected.
5 This approach seems promising to significantly reduce the
5
uncertainty in damage estimation where no individual on-site
0 investigations are possible. However, it needs further inves-
0 < 21 cm 21-60 cm 61-100 cm 101-150 cm > 150 cm
< 21 cm 21-60 cm 61-100 cm 101-150 cm > 150 cm tigation and validation.
water level classes
water level classes
Fig. 12. Mean damage ratios of buildings and contents of all sub- 5 Conclusions
samples (ofh-m: medium quality one-family houses, ofh-vg: very
good quality one-family houses, tsh-m: medium quality terraced Flood management and consequently flood mapping is a key
and semi-detached houses, tsh-vg: very good quality terraced and task and ongoing development in the sphere of competency
semi-detached houses, ab-m: medium quality apartment buildings, of state authorities in Germany. To support this demanding
ab-vg: very good quality apartment buildings). The values for the target from the scientific side, especially aiming at a more
“very good quality houses (vg)” were calculated with separate load- reliable flood-risk assessment, these studies were focussed
ing factors for building (ofh: 1.29, tsh: 1.11, ab: 1.57) and contents on the improvement of the following methods: 1.‘The esti-
damage (ofh: 1.12, tsh: 1.27, ab: 1.72). mation of extreme events which exceed the design flood of
flood protection measures, 2. The assessment of flood haz-
ard and risk over the whole spectrum of possible damage-
smaller for contents damage (Table 3). The CVs were in the
relevant flood events, 3. The damage estimation via the con-
same range as the ones of the HOWAS data base, the most
sideration of various building- and event-specific influences
comprehensive flood damage data base in Germany, which
on the resulting damage. In detail, a regionalization approach
has CVs of 155% and 149% for total flood damage of pri-
for flood peak discharges was further developed and sub-
vate households with flooded cellars only and with flooded
stantiated, especially regarding recurrence intervals of 200
storeys, respectively (Merz et al., 2004).
to 10 000 years and a large number of small ungauged catch-
ments. The hydraulic simulation presented provides haz-
ard mapping covering the whole spectrum of relevant flood
events, with special reference to extreme historical floods,
and is directly coupled with a GIS-tool for flood damage as-
sessment based on established stage-damage functions. In
Nat. Hazards Earth Syst. Sci., 6, 485–503, 2006 www.nat-hazards-earth-syst-sci.net/6/485/2006/](https://image.slidesharecdn.com/risksreading1-121207042028-phpapp02/85/Risks-reading1-16-320.jpg)

This document summarizes a study that aims to enhance methods for assessing flood hazards and risks, especially for extreme events. It is divided into three parts that estimate: 1) regional flood discharges, especially for rare events up to 10,000 year recurrence intervals, 2) local hydraulic impacts through hydrodynamic simulation, and 3) resulting flood damages through a new GIS-based damage estimation tool. The study seeks to improve flood risk assessment at local scales in Germany by considering extreme events and developing multi-factorial approaches to damage estimation.


