Downloaded 138 times
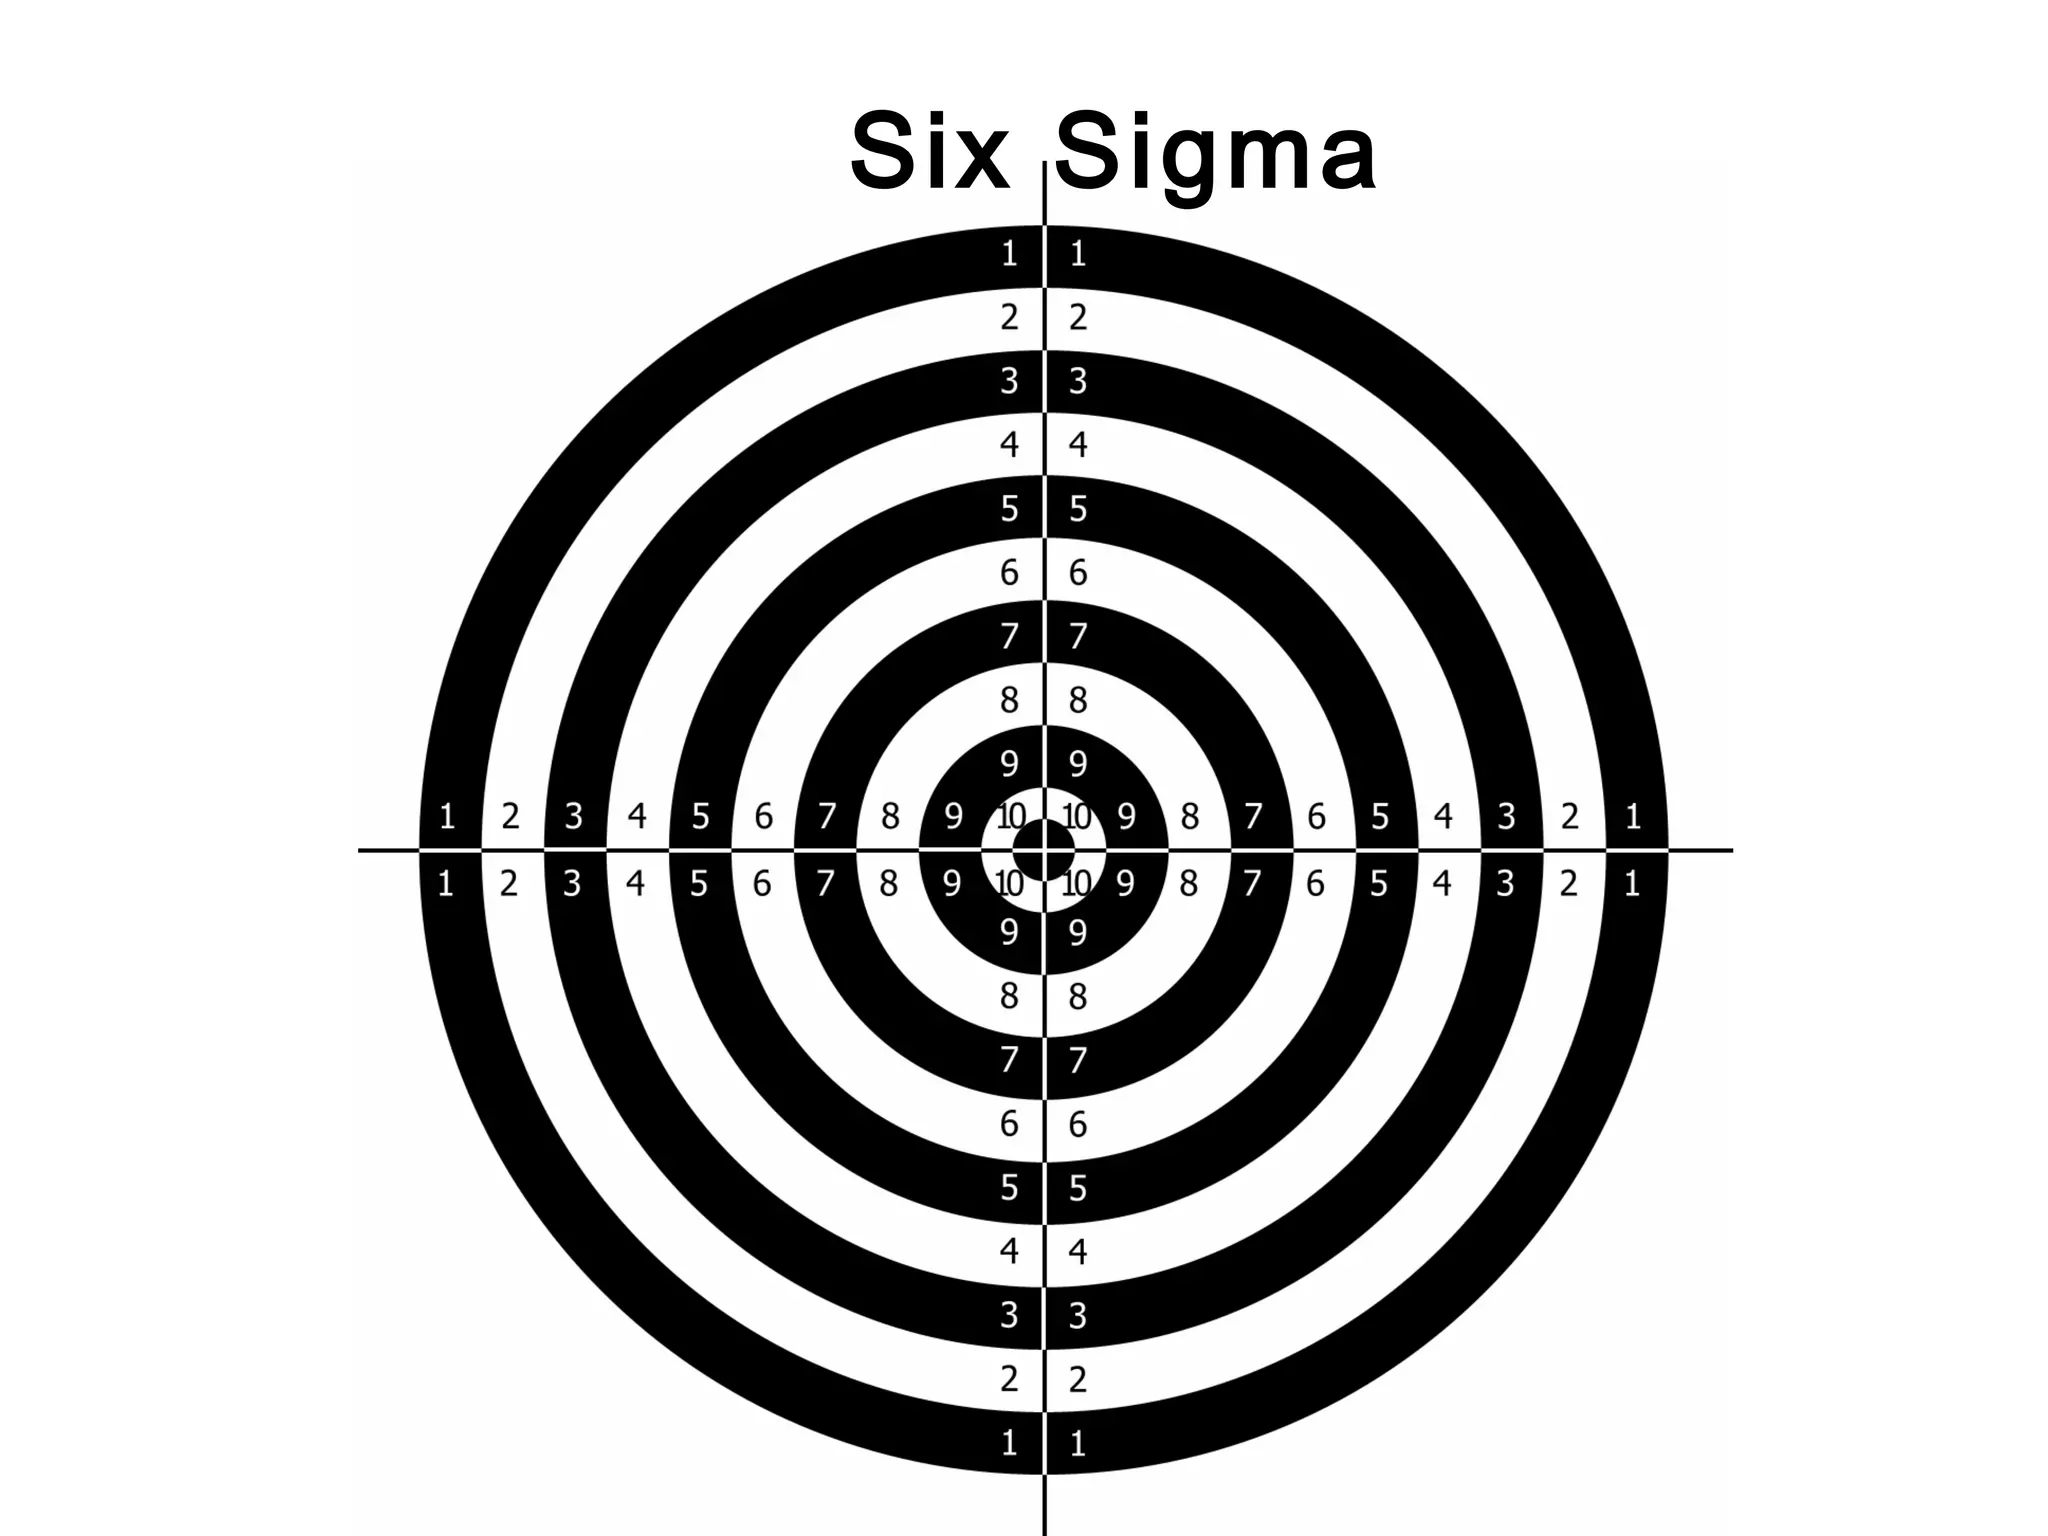


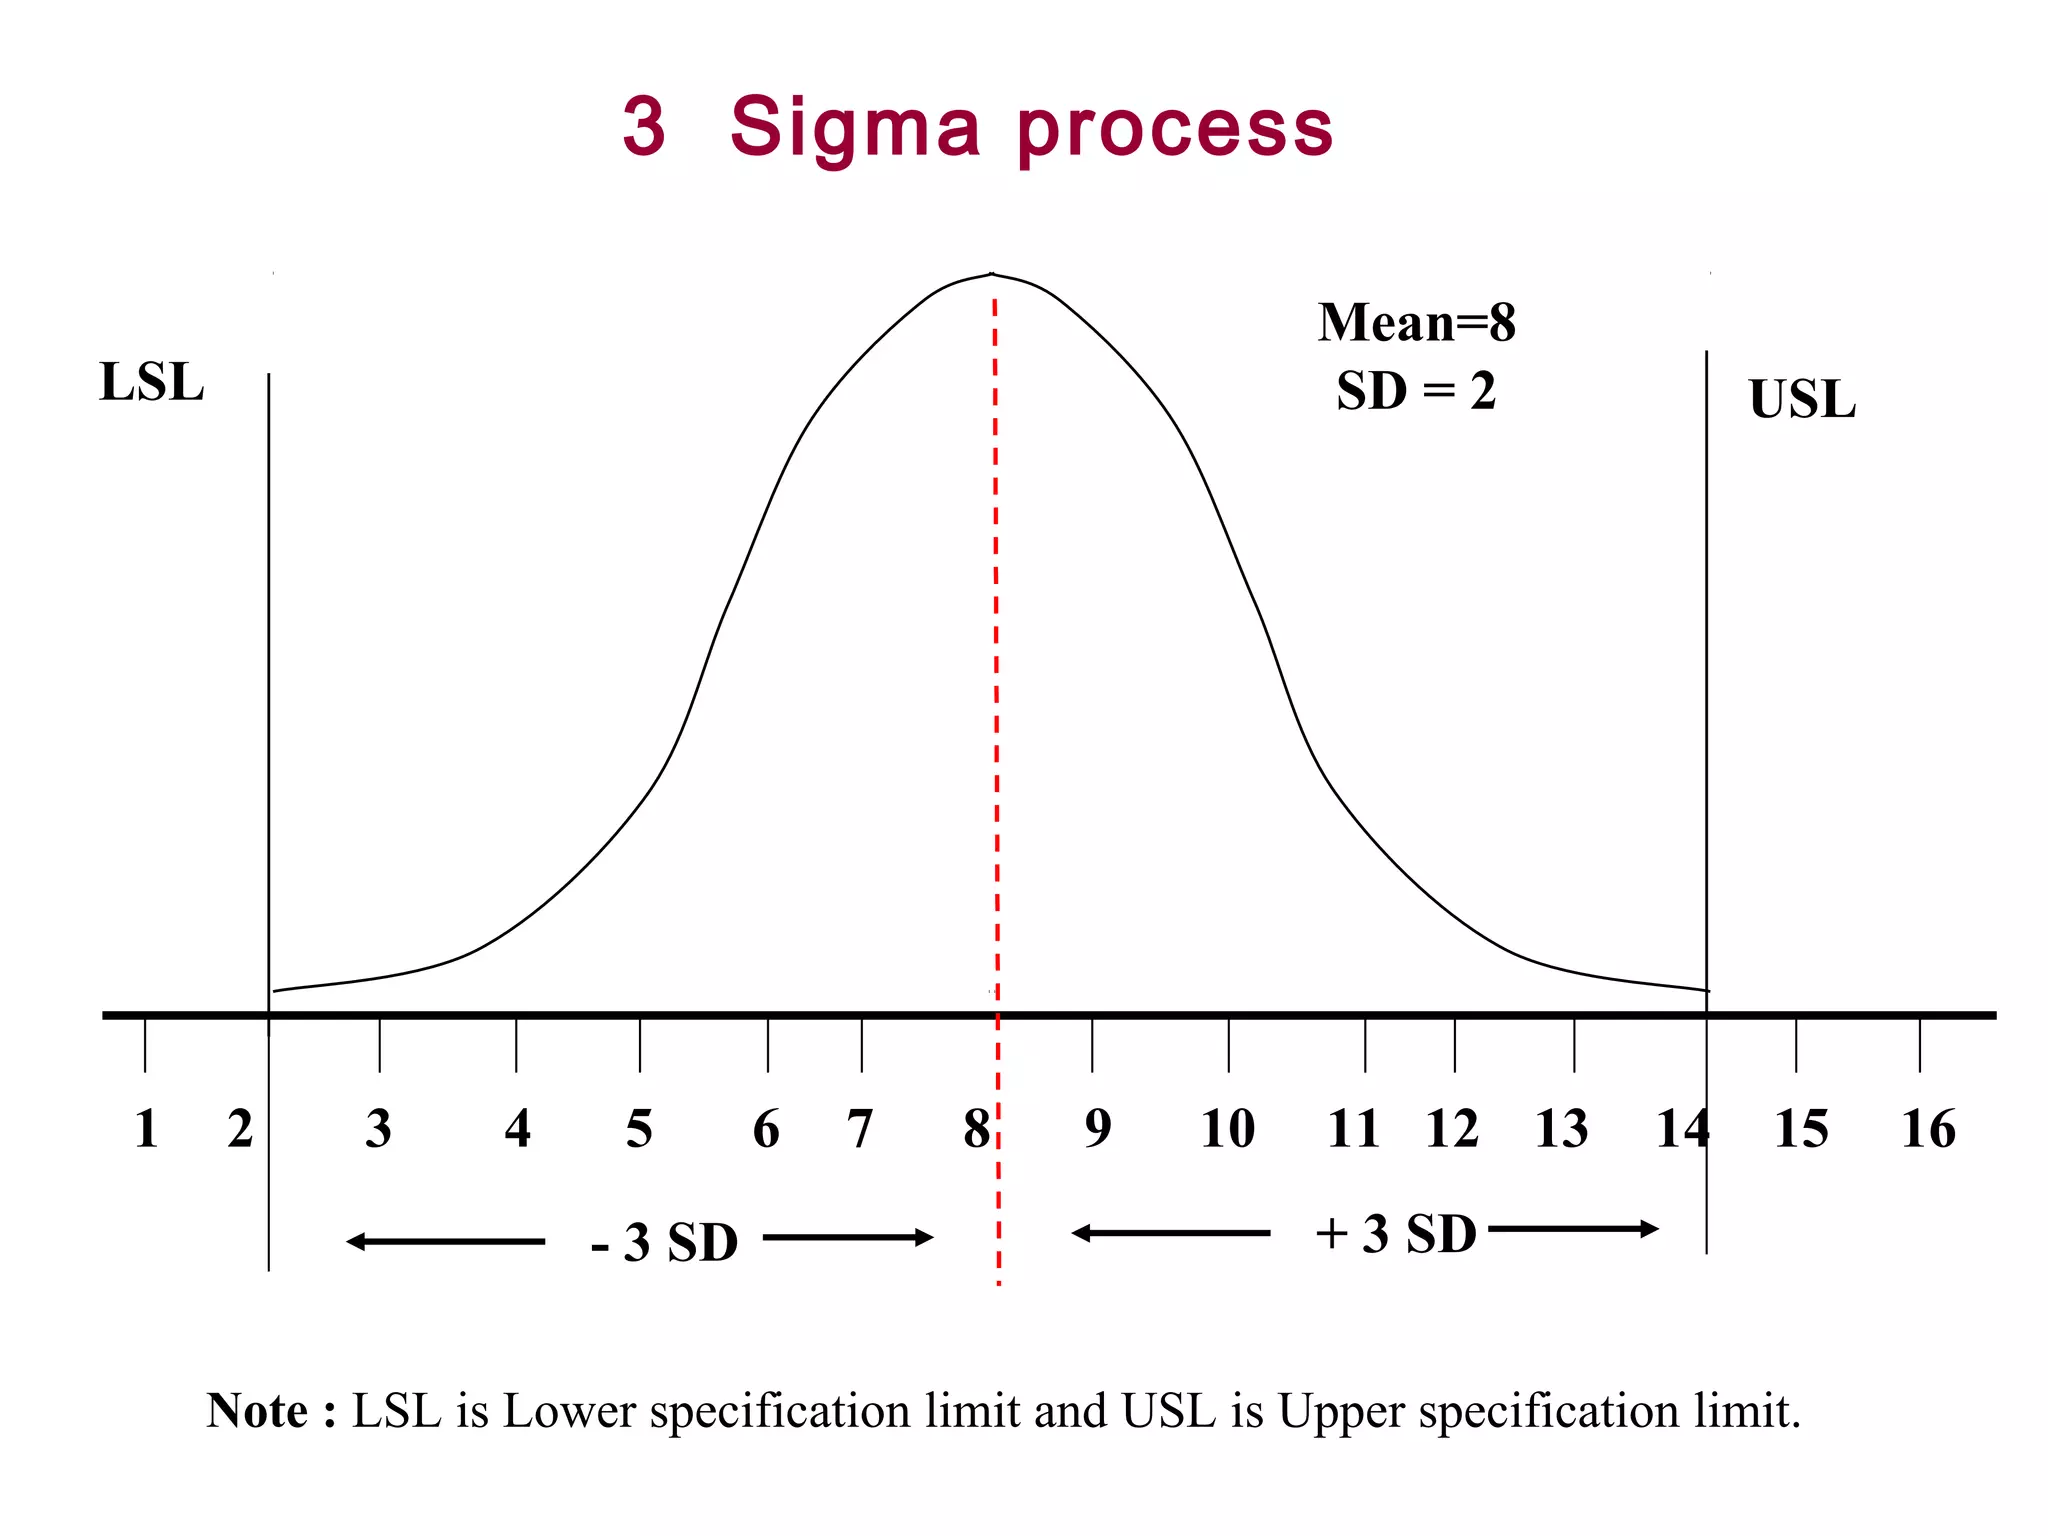
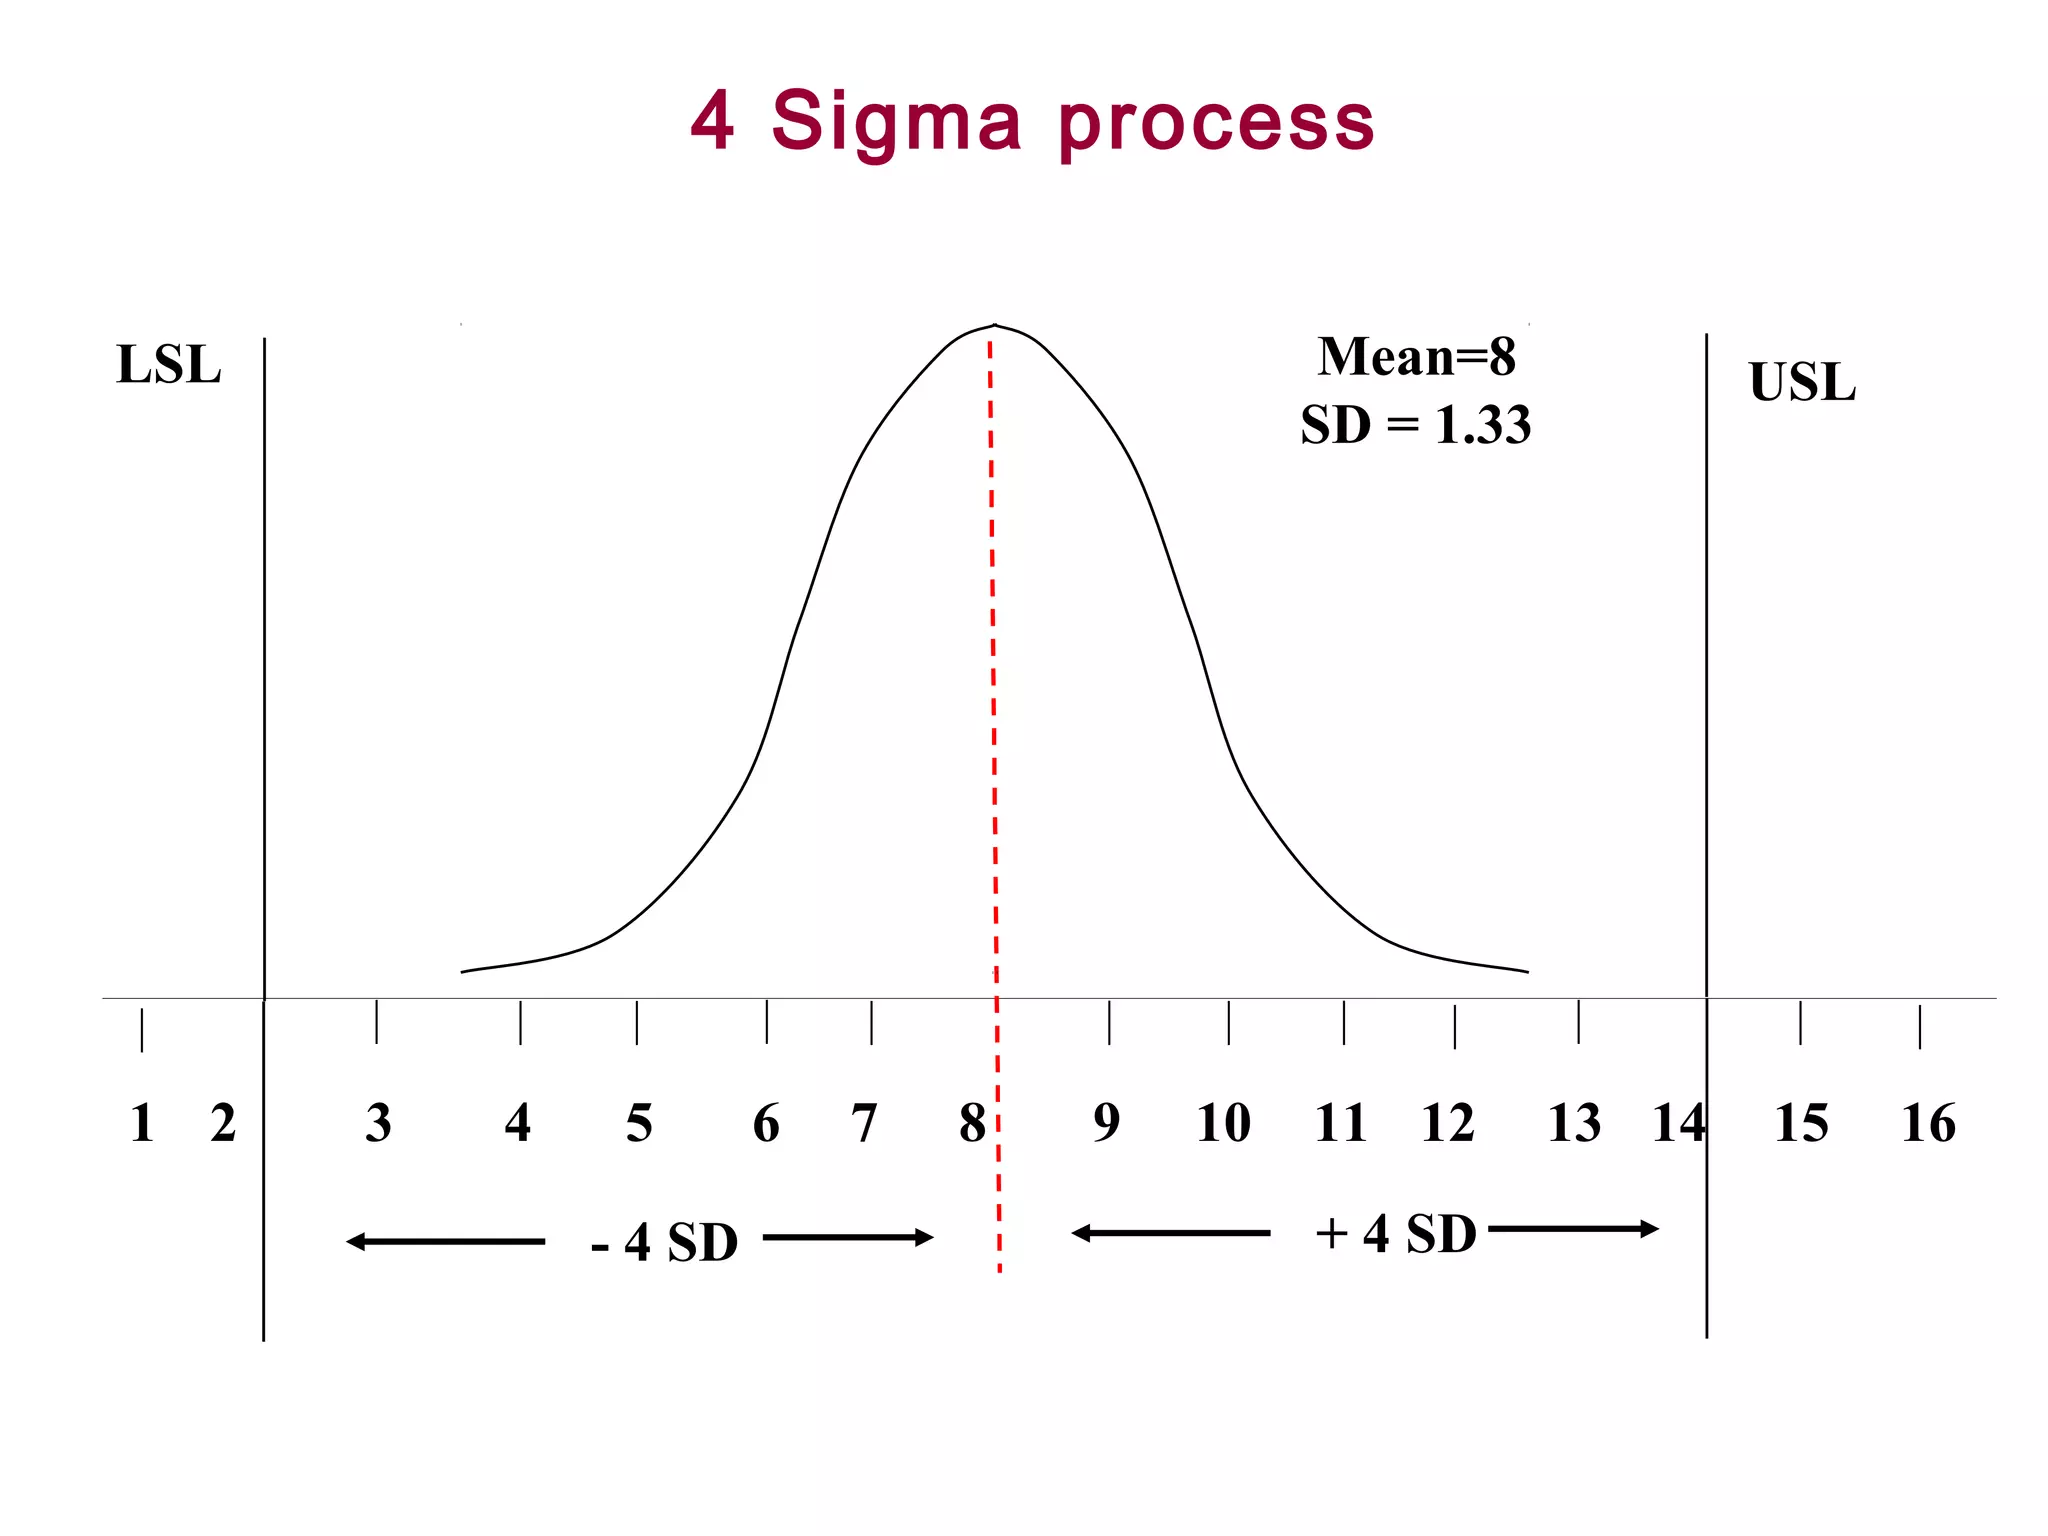
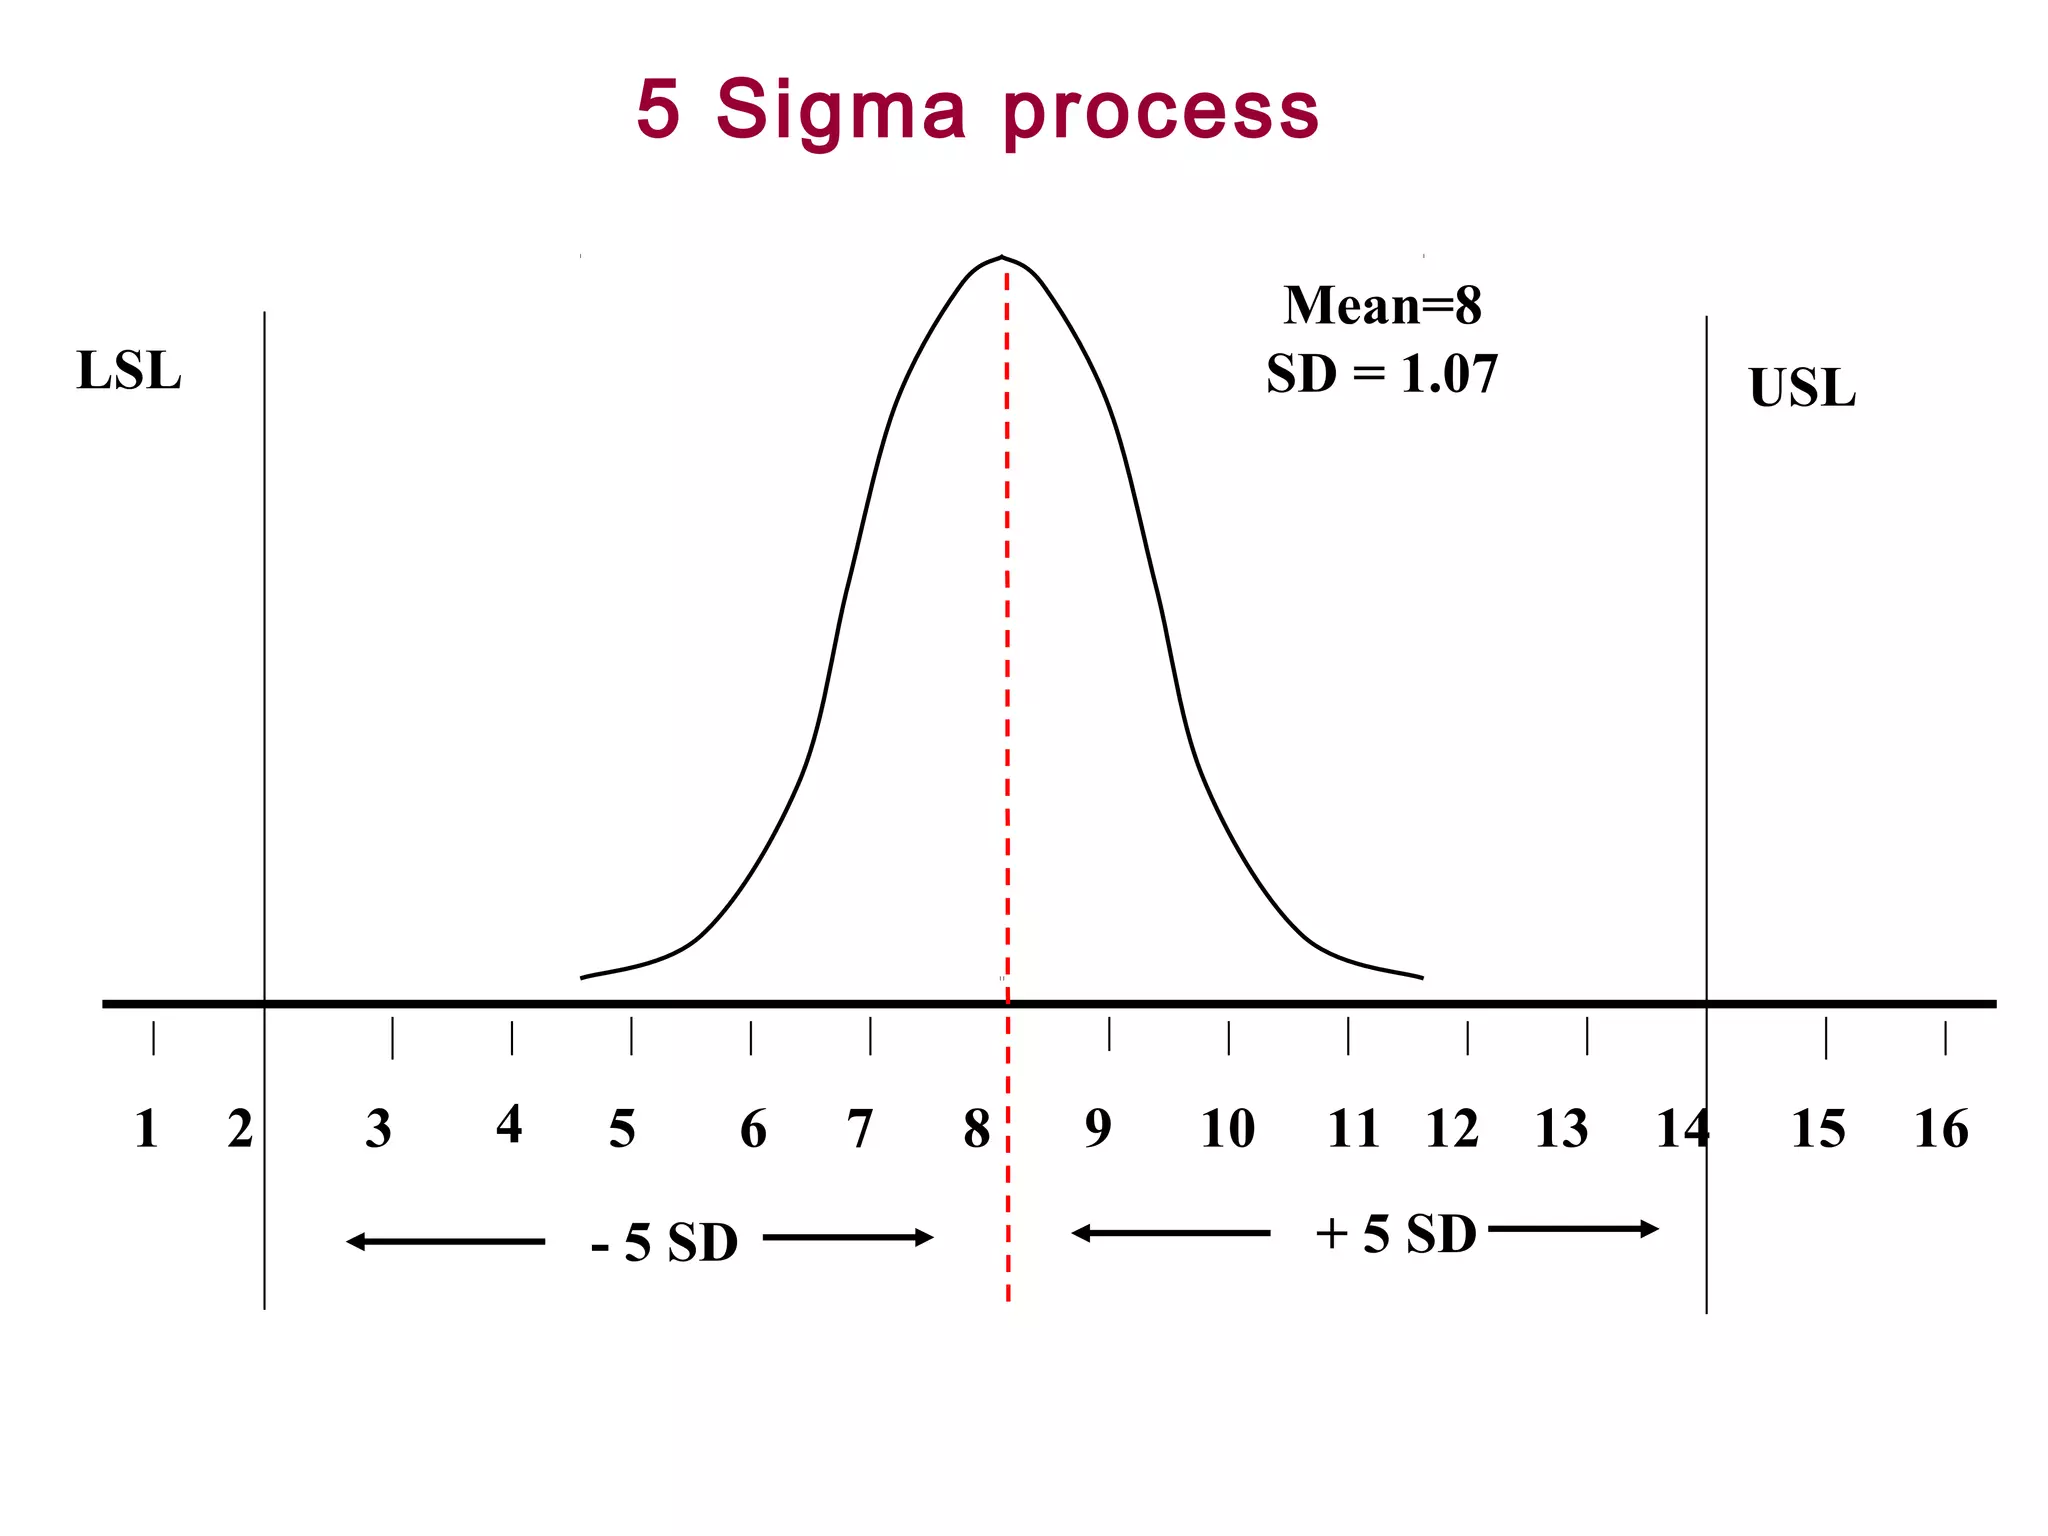
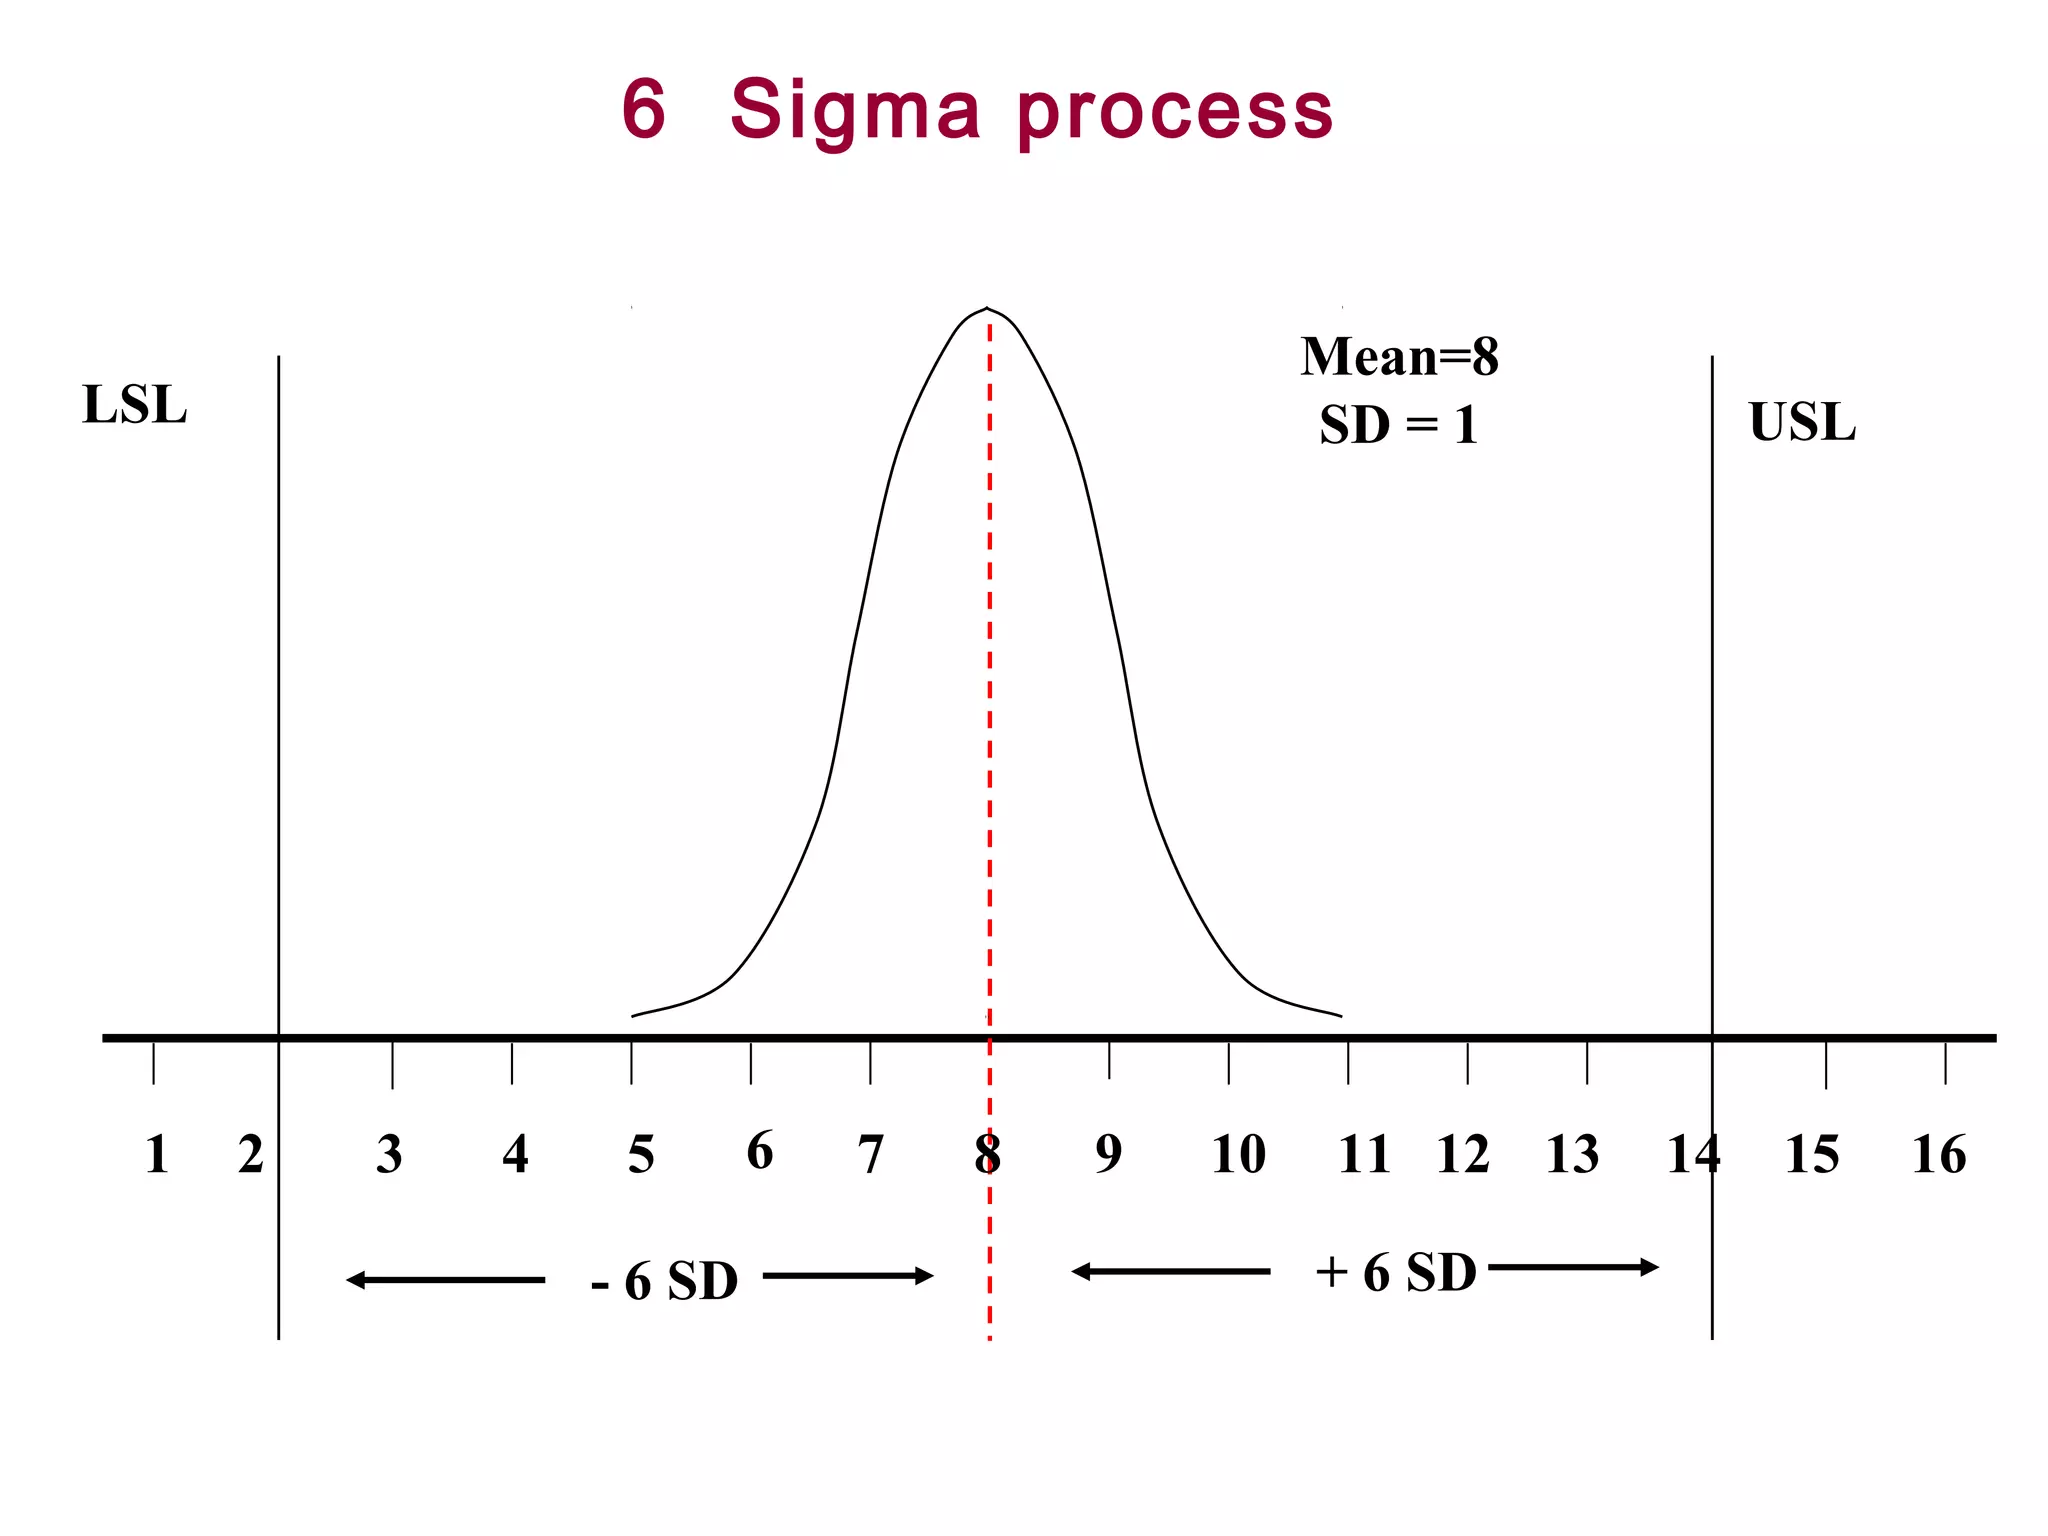
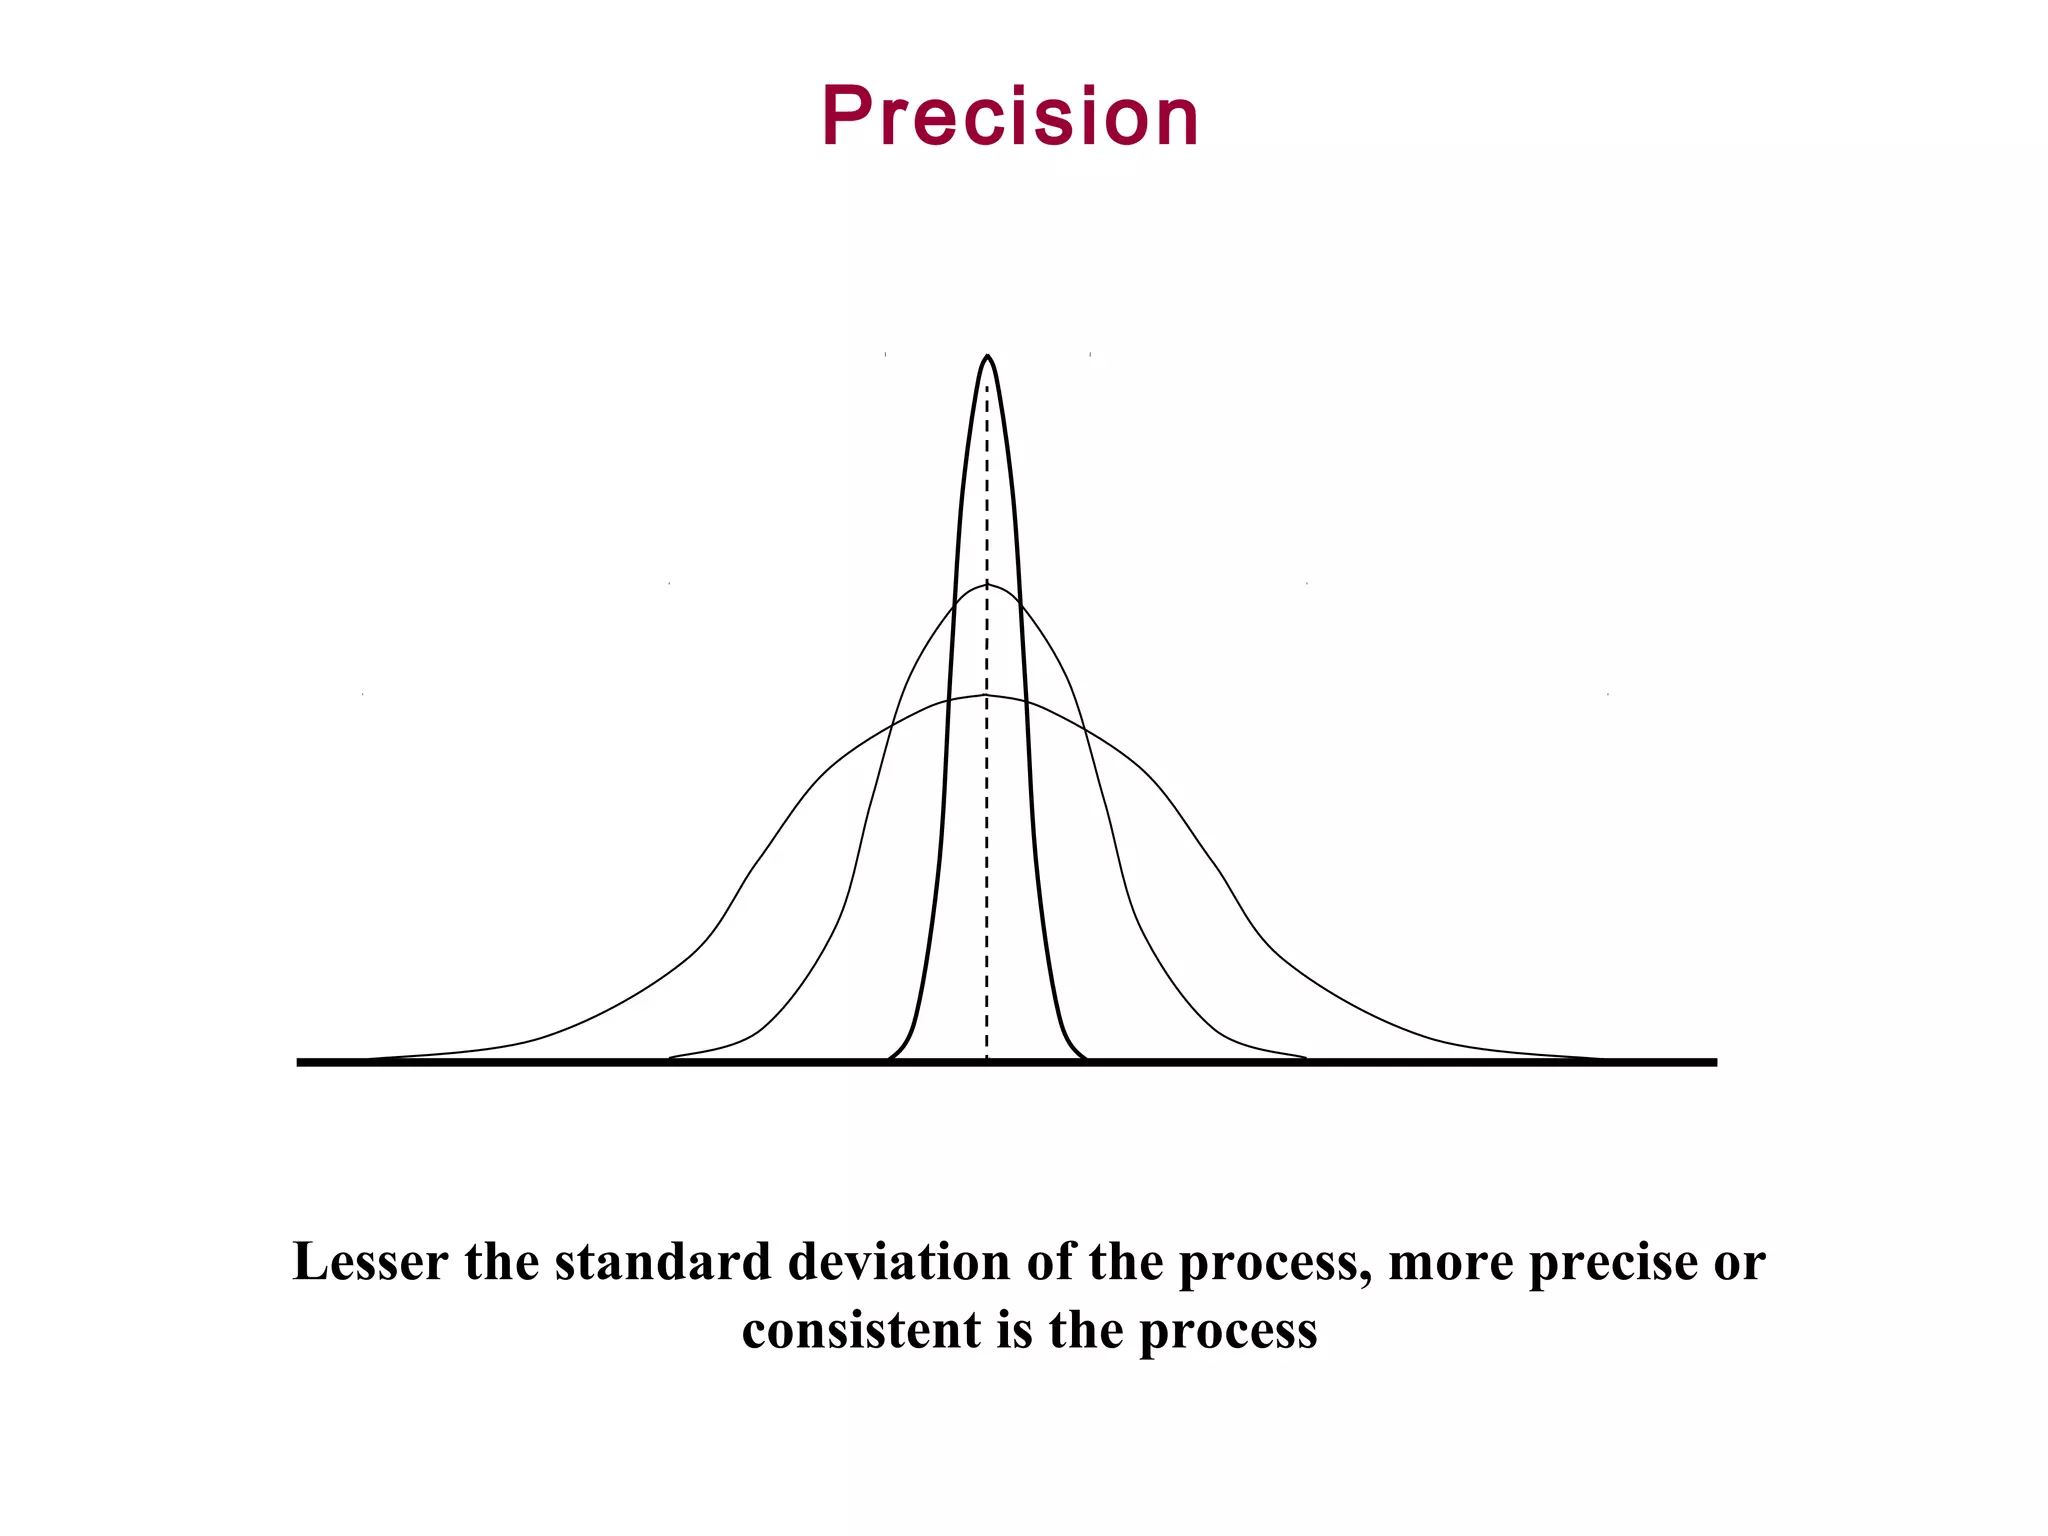
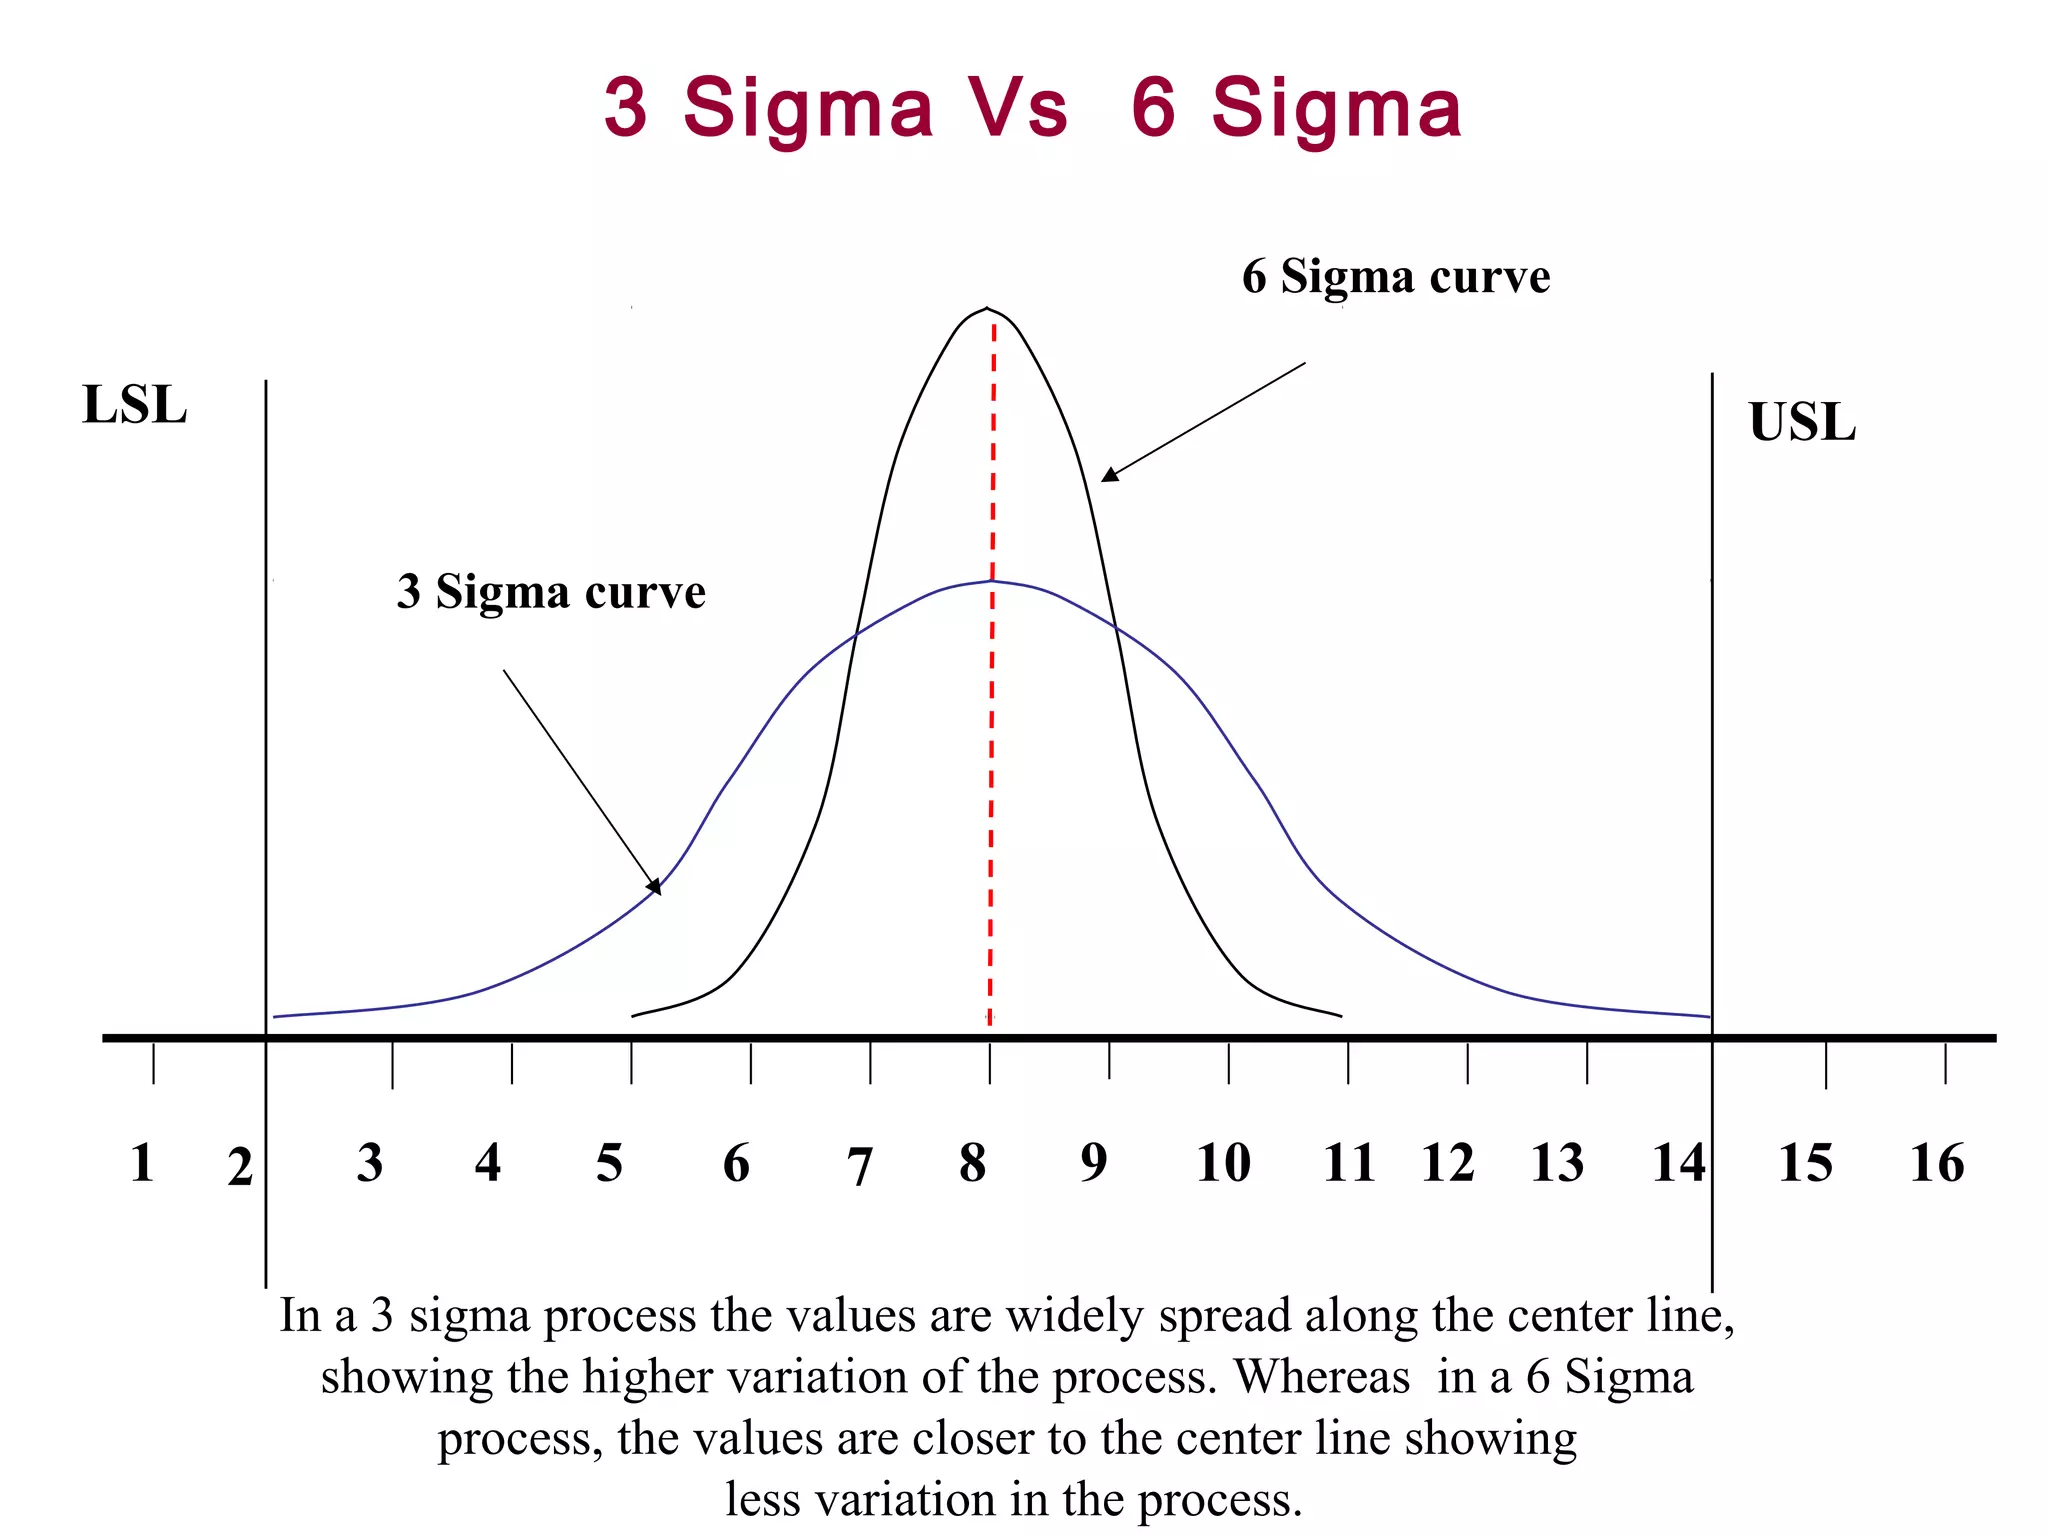
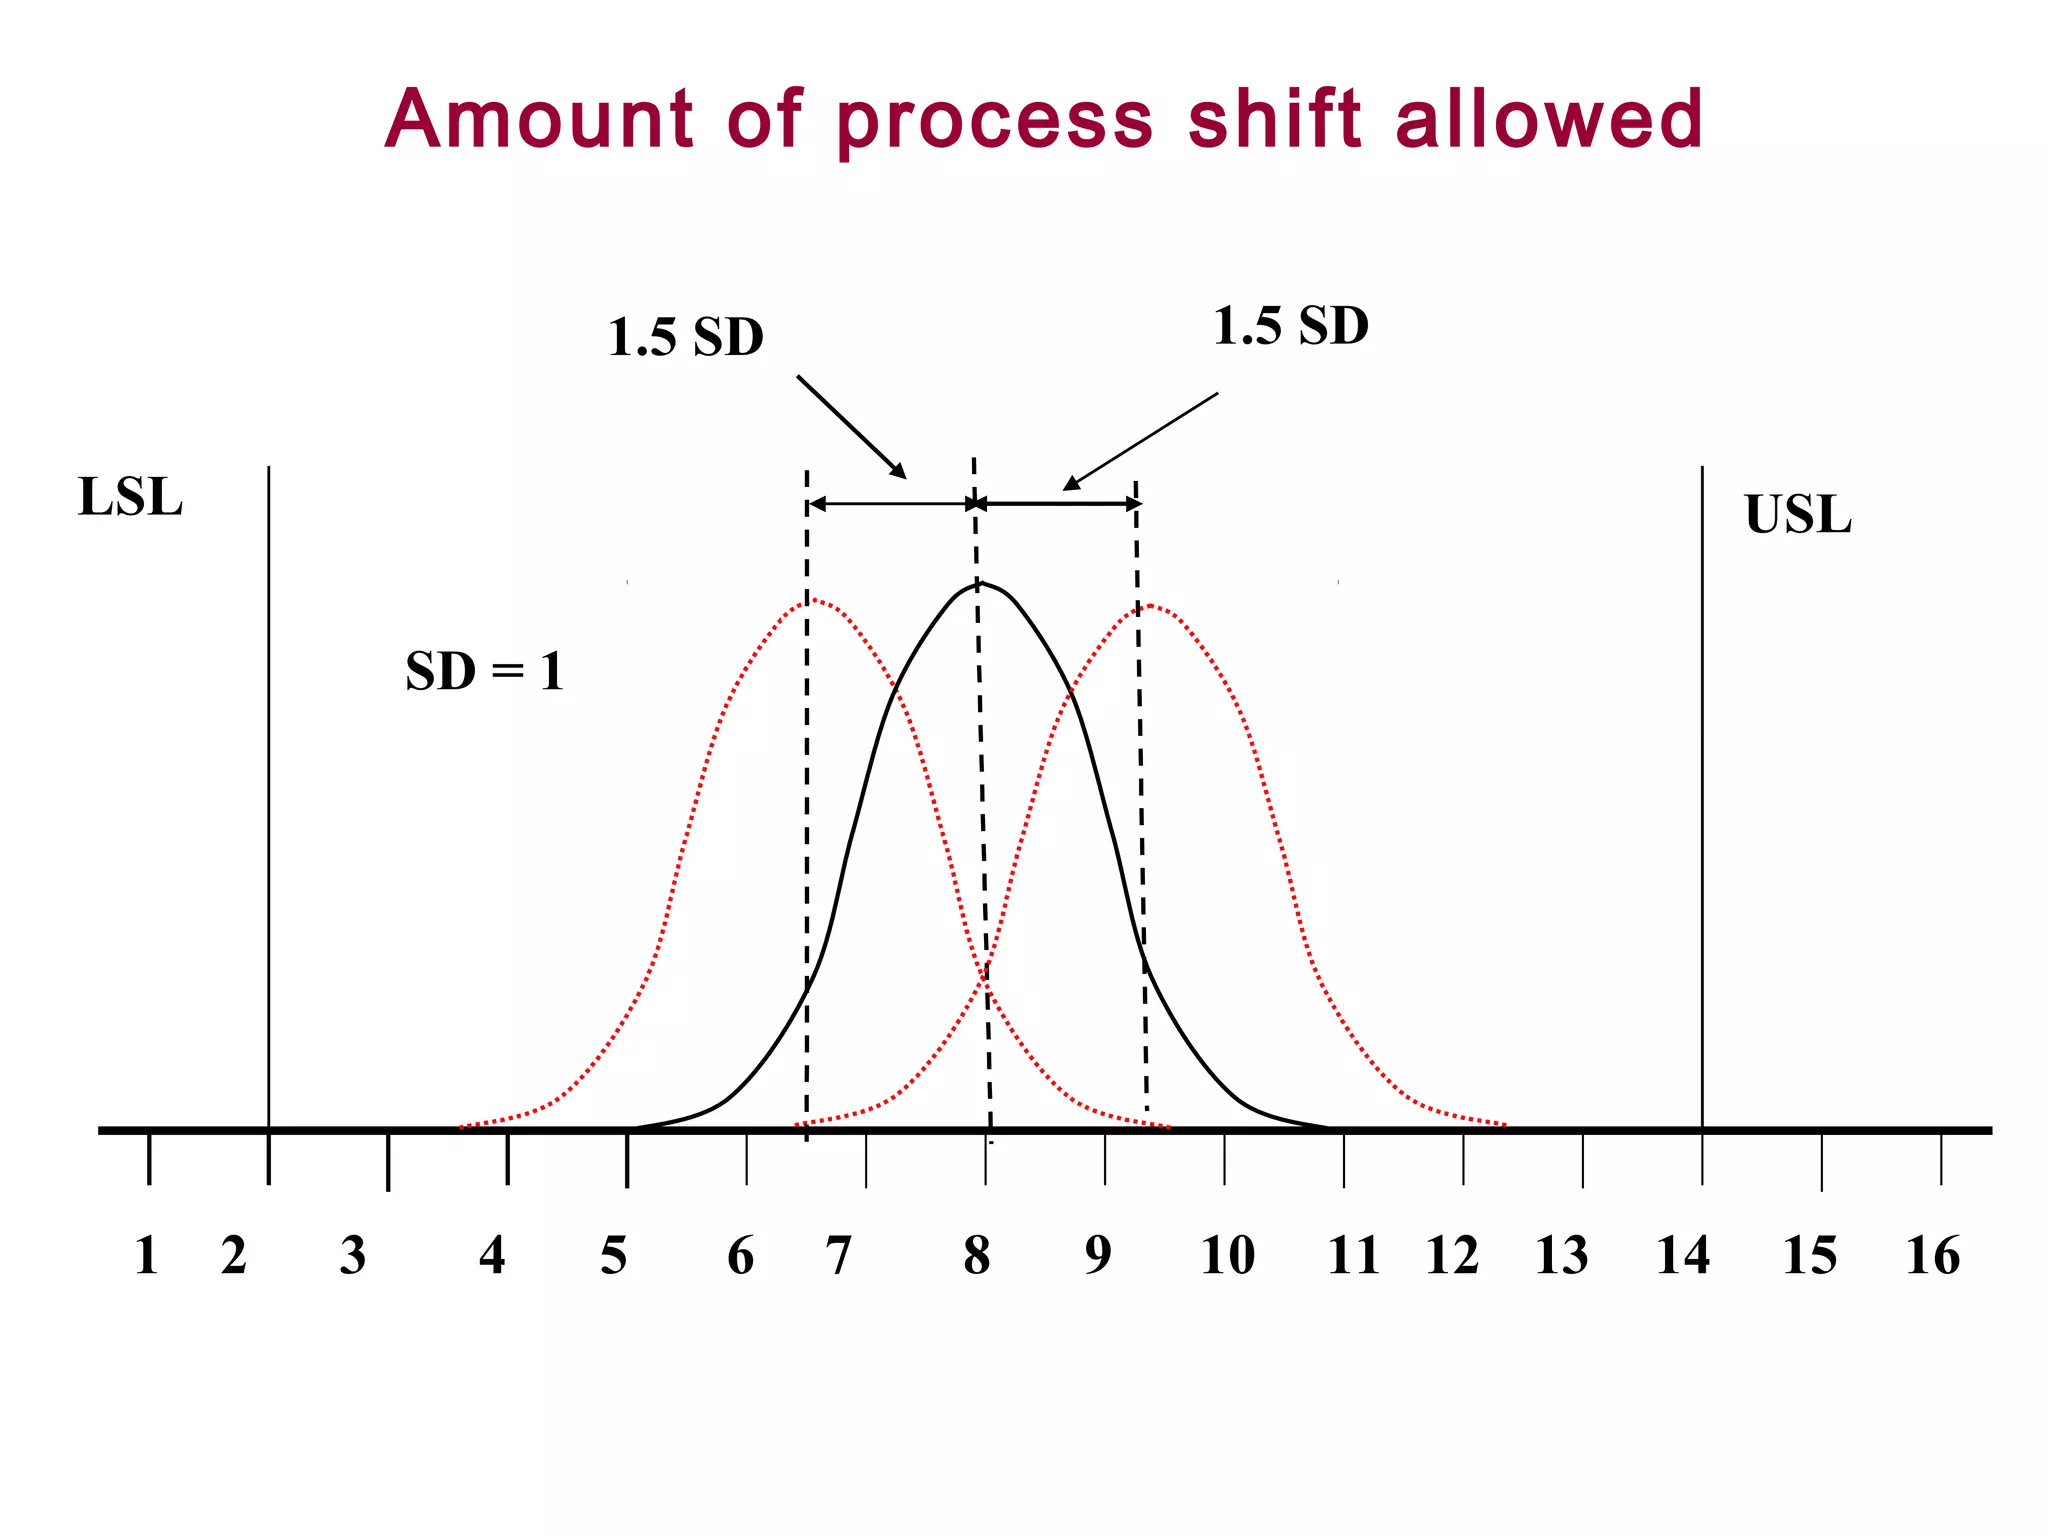
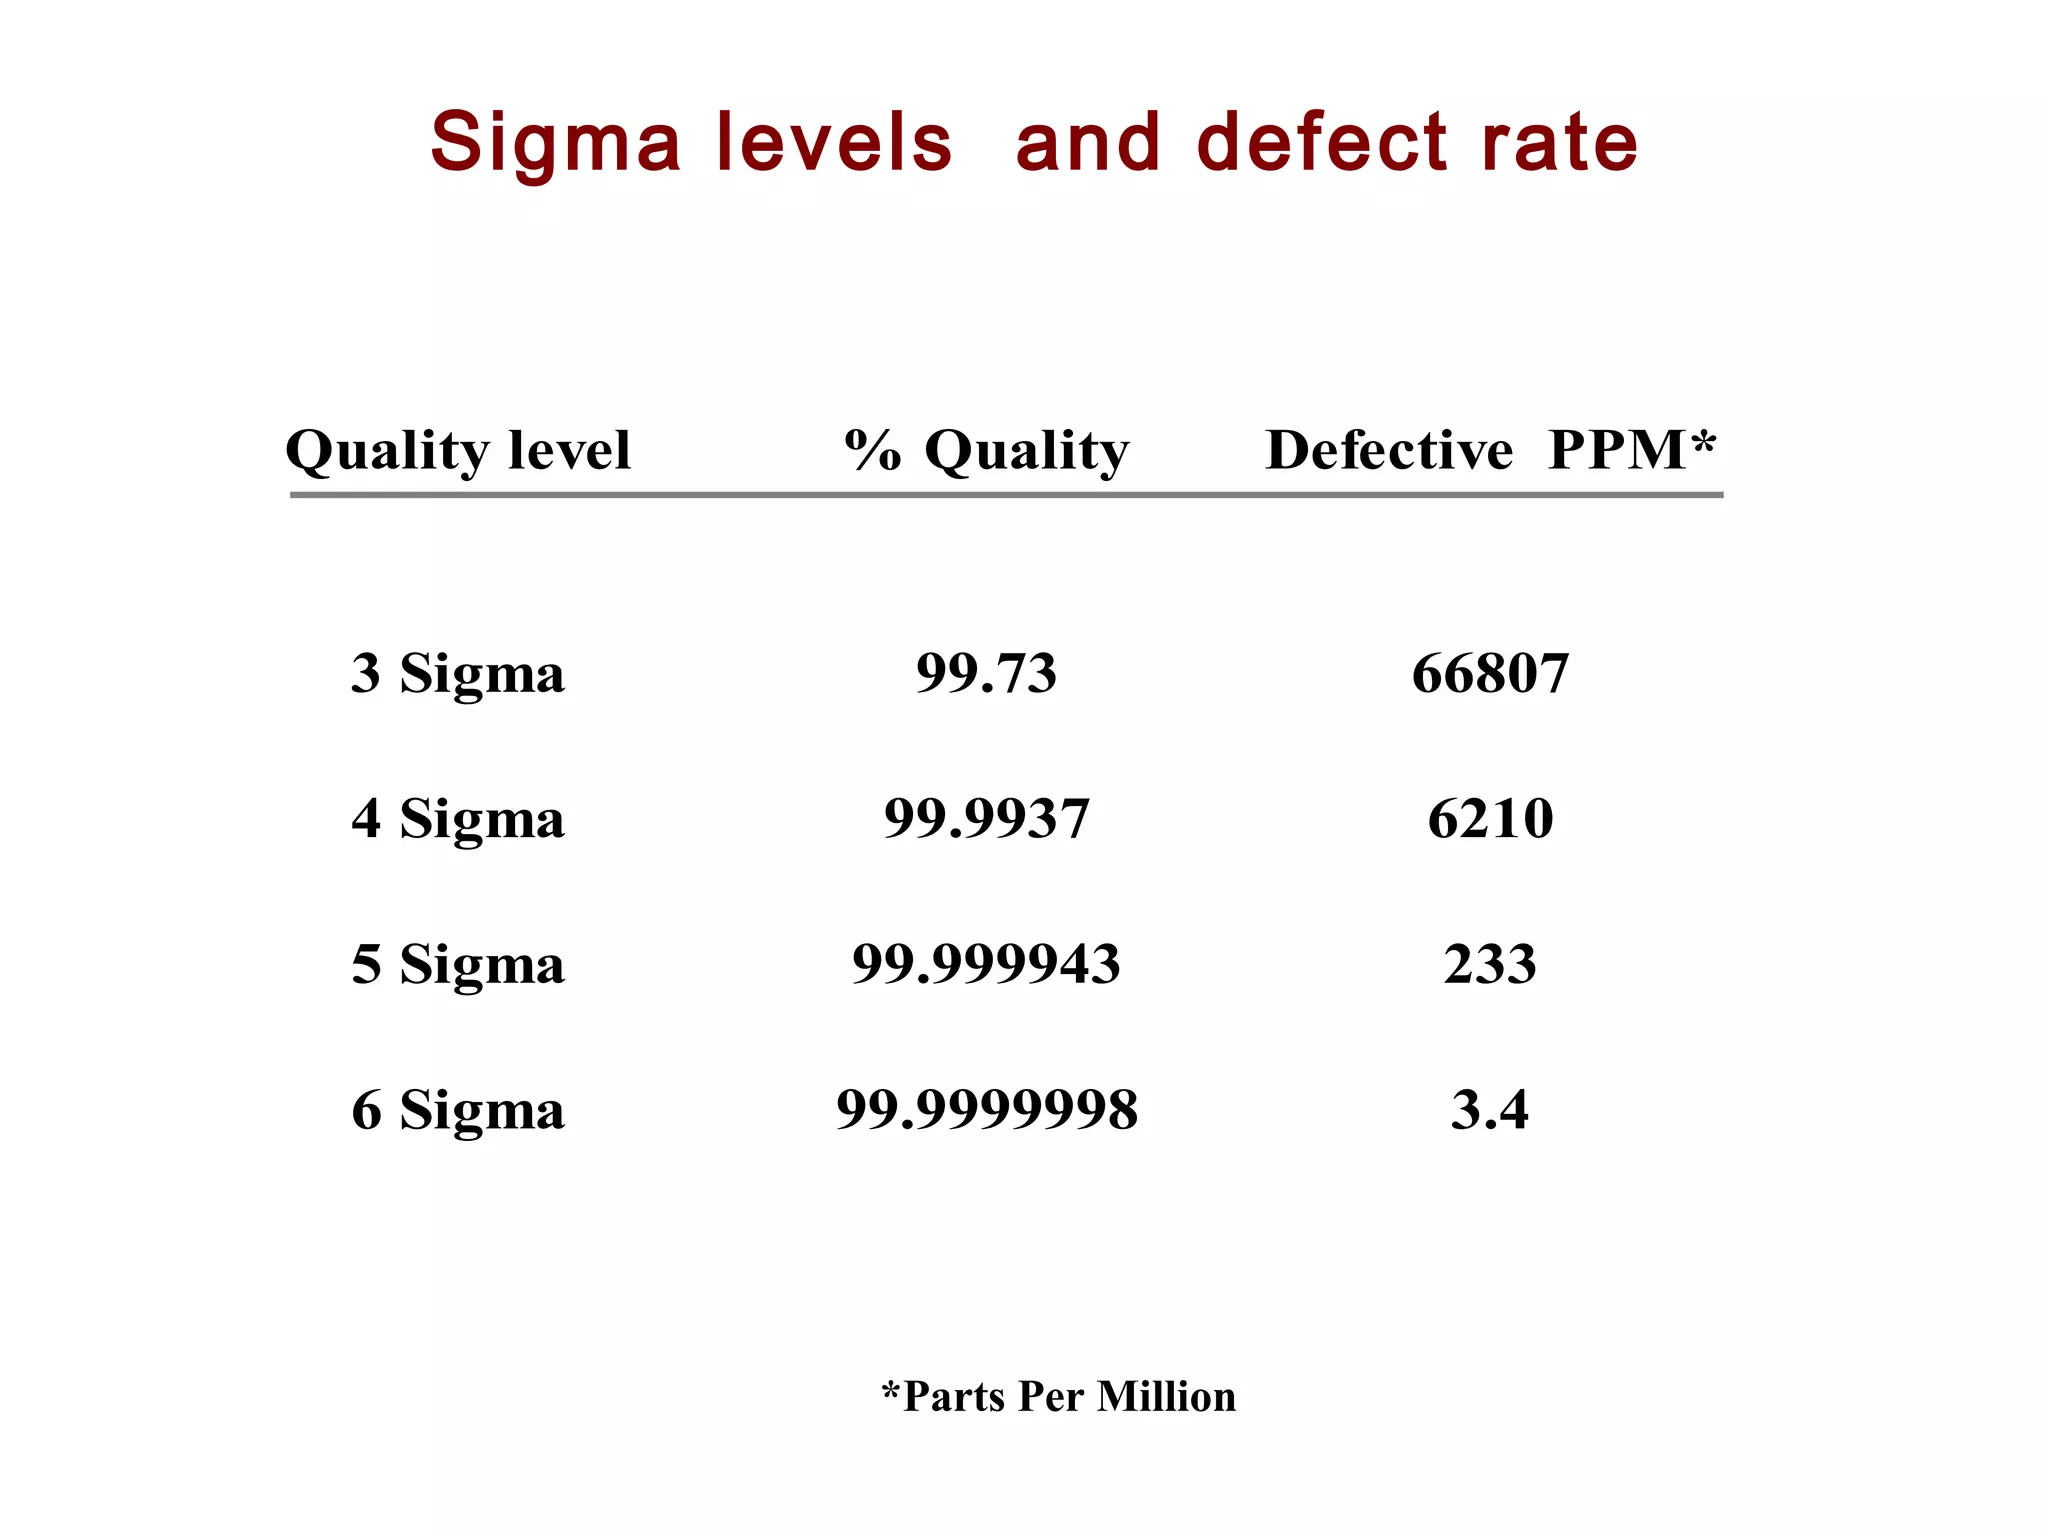
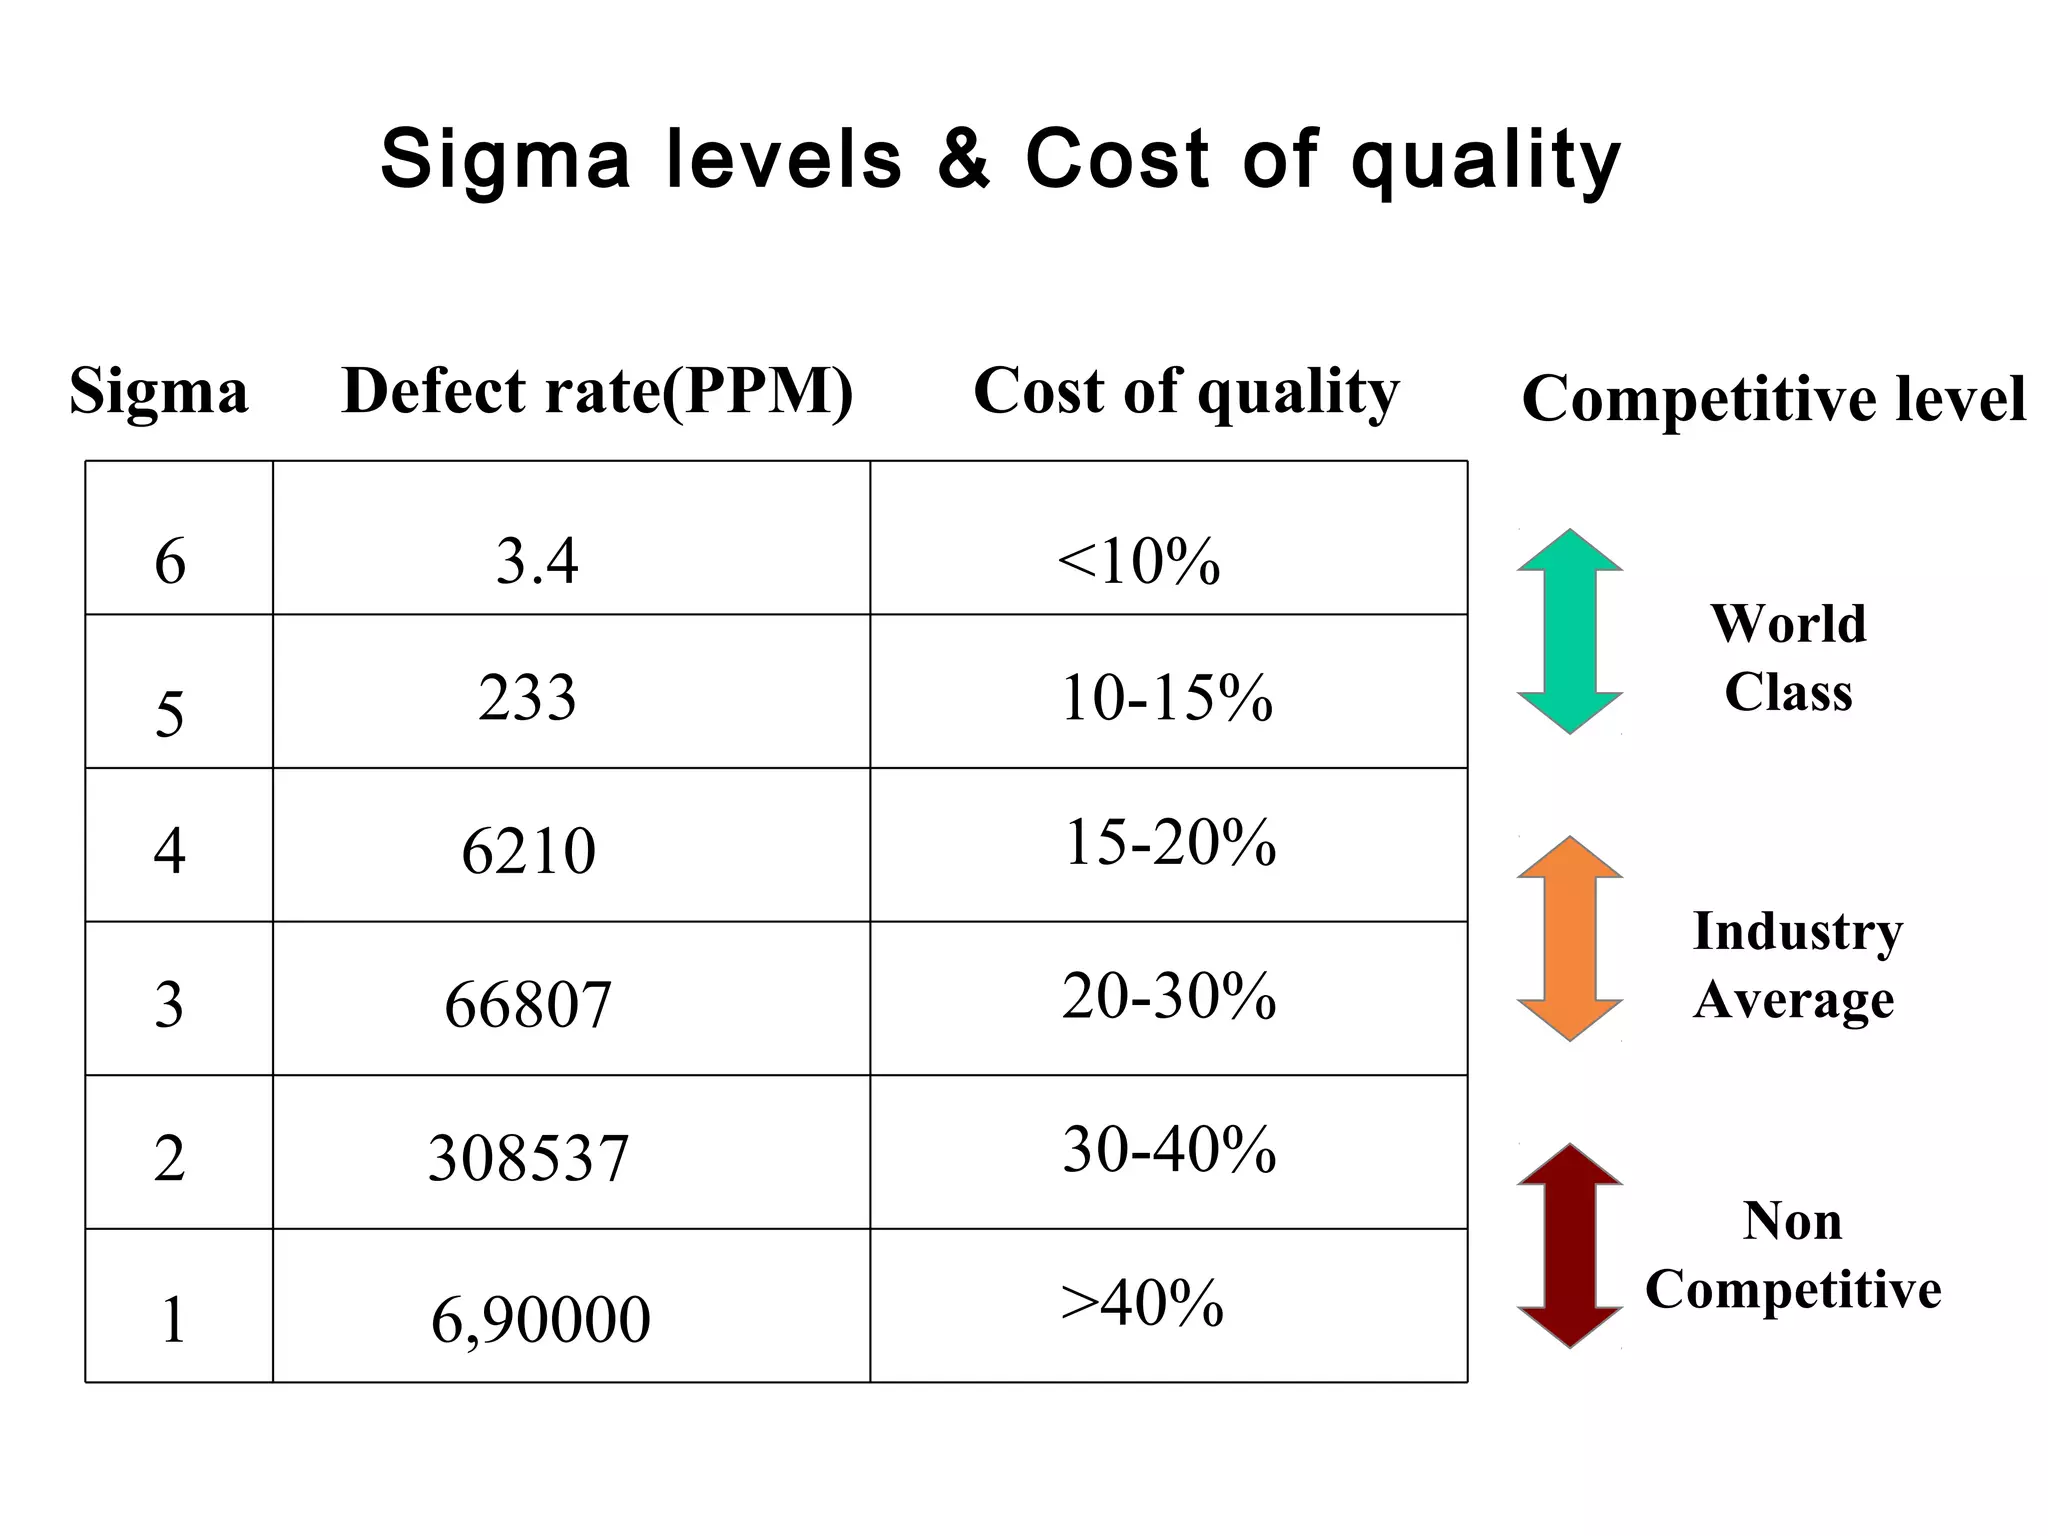

The document discusses Six Sigma, which aims to reduce process variation and improve quality by moving processes towards higher levels of accuracy and precision. It explains that Six Sigma seeks to reduce the standard deviation of processes to a level where the spread of 6 sigmas fits within specifications, resulting in only 3.4 defective parts per million. Achieving higher sigma levels can significantly lower costs and increase competitiveness compared to processes operating at 3 sigma or lower.


