Downloaded 2,547 times
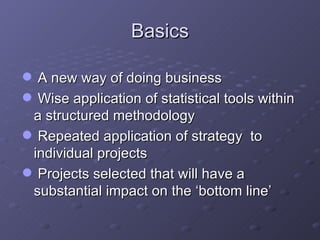
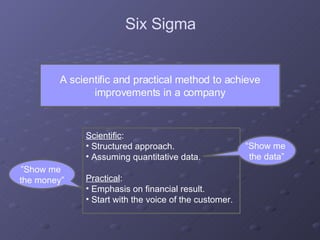
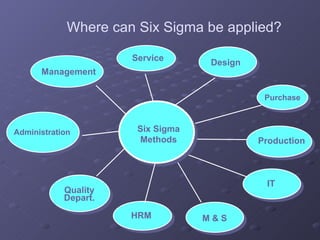
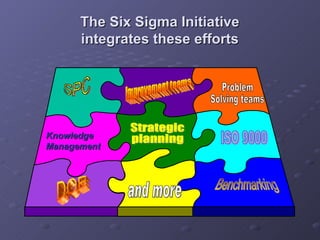
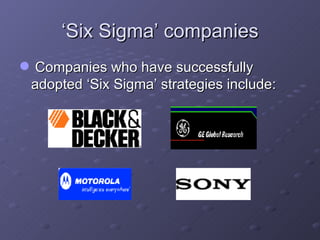
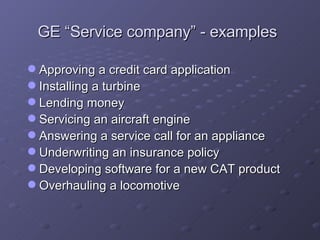
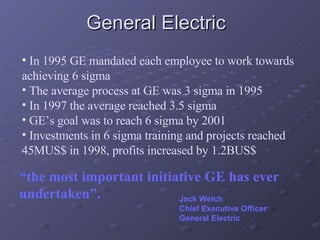
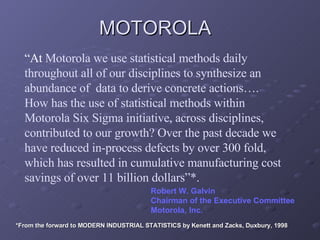
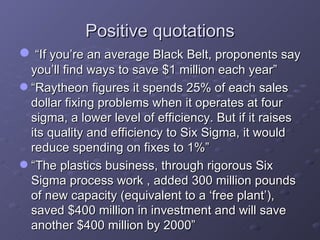
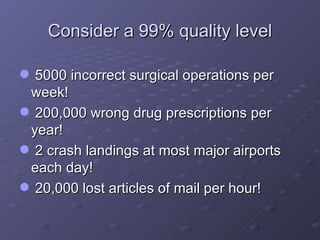
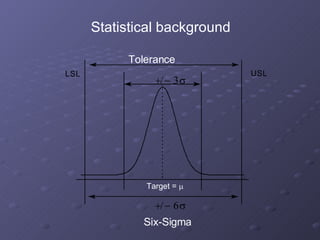
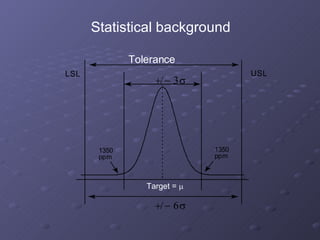
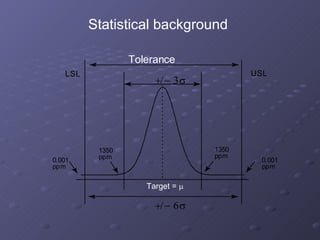
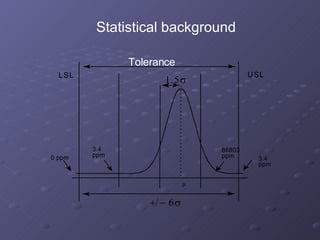
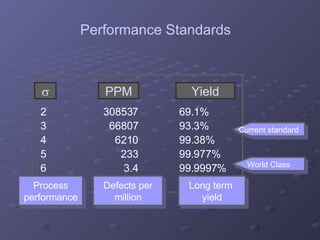
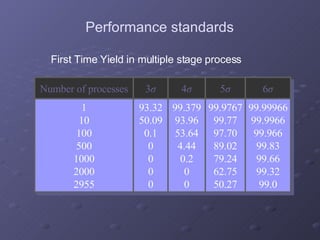
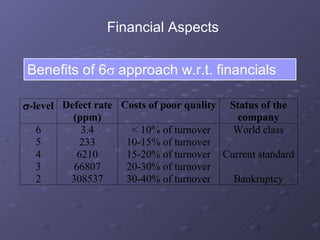


The document provides an overview of Six Sigma, including: 1) Six Sigma is a data-driven approach to process improvement that aims to reduce defects. It uses statistical tools and methodology applied to projects selected for high impact. 2) Major companies like GE and Motorola have successfully adopted Six Sigma, achieving significant cost savings and quality improvements. 3) Six Sigma aims for near-perfect processes, with less than 3.4 defects per million opportunities. Achieving six sigma quality levels can have substantial financial benefits for companies.


![China E-commerce Analytics [Credit Suisse]](https://cdn.slidesharecdn.com/ss_thumbnails/creditsuisse-chinae-commerceanalytics-121208092641-phpapp01-thumbnail.jpg?width=640&height=640&fit=bounds)


