
Recommended
More Related Content
What's hot
Viewers also liked
Viewers also liked (17)
Similar to S&P500 Market Recap
More from macavity_d_katt
More from macavity_d_katt (20)
Recently uploaded
Recently uploaded (20)
S&P500 Market Recap
- 1. COB: Fri 28-Aug-09 Index S&P100 - $OEX IdxMatch 2254 PriceUp -29.00% Symbol OEX 477.75 NumCons 100 VolumeUp -9.00% Daily 97.00% Adv Dec PUVU PUVD PDVU PDVD 34.00% 63.00% 16.00% 18.00% 28.00% 35.00% Moving Averages High/Lows BreakOuts Levels Index Above Below Index Highs Lows Net Index Highs Lows Net Highs Lows 3D -1 47.00% 53.00% 1 35.00% 21.00% 14.00% 0 14.00% 8.00% 6.00% 482.75 472.96 13D 1 76.00% 24.00% 1 24.00% 0.00% 24.00% 0 12.00% 0.00% 12.00% 482.75 455.02 55D 1 94.00% 6.00% 1 16.00% 0.00% 16.00% 0 10.00% 0.00% 10.00% 482.75 408.76 233D 1 74.00% 26.00% 0 6.00% 0.00% 6.00% 0 3.00% 0.00% 3.00% 566.86 317.37 Weekly 100.00% Adv Dec PUVU PUVD PDVU PDVD 49.00% 51.00% 24.00% 25.00% 13.00% 38.00% Moving Averages High/Lows Index Above Below Index Highs Lows Net 3W 1 72.00% 28.00% 1 64.00% 2.00% 62.00% 13W 1 96.00% 4.00% 1 47.00% 0.00% 47.00% 55W 1 67.00% 33.00% 0 2.00% 0.00% 2.00% 233W -1 31.00% 69.00% 0 0.00% 0.00% 0.00%
- 2. COB: Fri 28-Aug-09 Index Nasdaq100 - $NDX IdxMatch 2141 PriceUp -6.00% Symbol NDX--X 1643.24 NumCons 100 VolumeUp 6.00% Daily 96.00% Adv Dec PUVU PUVD PDVU PDVD 45.00% 51.00% 29.00% 16.00% 22.00% 29.00% Moving Averages High/Lows BreakOuts Levels Index Above Below Index Highs Lows Net Index Highs Lows Net Highs Lows 3D 1 53.00% 47.00% 1 46.00% 19.00% 27.00% 0 19.00% 6.00% 13.00% 1668.01 1611.73 13D 1 69.00% 31.00% 1 33.00% 1.00% 32.00% 0 12.00% 0.00% 12.00% 1668.01 1563.14 55D 1 83.00% 17.00% 1 20.00% 1.00% 19.00% 0 10.00% 0.00% 10.00% 1668.01 1394.87 233D 1 83.00% 17.00% 0 9.00% 0.00% 9.00% 0 4.00% 0.00% 4.00% 1677.65 1018.86 Weekly 100.00% Adv Dec PUVU PUVD PDVU PDVD 49.00% 51.00% 21.00% 28.00% 9.00% 42.00% Moving Averages High/Lows Index Above Below Index Highs Lows Net 3W 1 64.00% 36.00% 1 44.00% 8.00% 36.00% 13W 1 83.00% 17.00% 1 33.00% 2.00% 31.00% 55W 1 77.00% 23.00% 0 8.00% 0.00% 8.00% 233W 1 48.00% 52.00% 0 2.00% 0.00% 2.00%
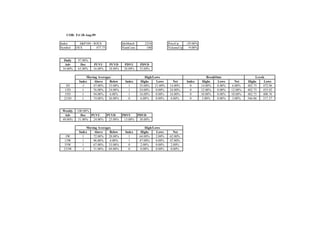
- 3. COB: Fri 28-Aug-09 Index S&P500 - $SPX IdxMatch 2779 PriceUp -11.60% Symbol SP-500 1028.93 NumCons 500 VolumeUp -6.00% Daily 97.60% Adv Dec PUVU PUVD PDVU PDVD 43.00% 54.60% 21.80% 21.20% 24.00% 30.60% Moving Averages High/Lows BreakOuts Levels Index Above Below Index Highs Lows Net Index Highs Lows Net Highs Lows 3D 1 49.40% 50.60% 1 38.20% 17.00% 21.20% 0 15.60% 6.40% 9.20% 1039.47 1016.20 13D 1 76.40% 23.60% 1 28.20% 1.40% 26.80% 0 10.60% 0.60% 10.00% 1039.47 978.51 55D 1 91.60% 8.40% 1 17.00% 0.20% 16.80% 0 7.20% 0.00% 7.20% 1039.47 869.32 233D 1 77.80% 22.20% 0 5.80% 0.00% 5.80% 0 1.20% 0.00% 1.20% 1215.77 666.79 Weekly 99.60% Adv Dec PUVU PUVD PDVU PDVD 49.20% 50.40% 22.80% 26.40% 14.80% 35.60% Moving Averages High/Lows Index Above Below Index Highs Lows Net 3W 1 72.20% 27.80% 1 56.40% 3.60% 52.80% 13W 1 92.40% 7.60% 1 42.40% 0.40% 42.00% 55W 1 69.80% 30.20% 0 3.80% 0.00% 3.80% 233W -1 30.20% 69.80% 0 0.40% 0.00% 0.40%
- 4. COB: Fri 28-Aug-09 Index Russell1000 - $RUI IdxMatch 2620 PriceUp 0.31% Symbol RUI-X 563.11 NumCons 968 VolumeUp -3.00% Daily 98.14% Adv Dec PUVU PUVD PDVU PDVD 49.17% 48.97% 26.34% 22.83% 21.18% 27.69% Moving Averages High/Lows BreakOuts Levels Index Above Below Index Highs Lows Net Index Highs Lows Net Highs Lows 3D 1 54.34% 45.66% 1 39.77% 17.05% 22.73% 0 18.60% 5.48% 13.12% 568.73 555.53 13D 1 74.38% 25.62% 1 28.93% 3.10% 25.83% 0 12.91% 1.24% 11.67% 568.73 535.41 55D 1 89.67% 10.33% 1 18.08% 0.52% 17.56% 0 8.37% 0.21% 8.16% 568.73 474.10 233D 1 77.89% 22.11% 0 6.10% 0.10% 5.99% 0 2.17% 0.10% 2.07% 660.99 362.27 Weekly 99.48% Adv Dec PUVU PUVD PDVU PDVD 51.76% 47.73% 25.10% 26.65% 16.63% 31.10% Moving Averages High/Lows Index Above Below Index Highs Lows Net 3W 1 70.25% 29.75% 1 52.38% 6.10% 46.28% 13W 1 90.19% 9.81% 1 40.50% 0.93% 39.57% 55W 1 71.18% 28.82% 0 5.37% 0.10% 5.27% 233W -1 36.16% 63.84% 0 1.34% 0.00% 1.34%
- 5. COB: Fri 28-Aug-09 Index Russell2000 - $RUT IdxMatch 2623 PriceUp -53.29% Symbol RUT-X 579.86 NumCons 2006 VolumeUp 5.83% Daily 98.21% Adv Dec PUVU PUVD PDVU PDVD 22.38% 75.82% 13.66% 8.72% 38.29% 37.39% Moving Averages High/Lows BreakOuts Levels Index Above Below Index Highs Lows Net Index Highs Lows Net Highs Lows 3D -1 29.01% 70.99% 1 26.37% 27.82% (1.45%) 0 8.23% 14.96% (6.73%) 589.79 572.66 13D 1 52.44% 47.56% 1 17.55% 5.68% 11.86% 0 5.33% 2.64% 2.69% 589.79 546.96 55D 1 73.33% 26.67% 1 10.72% 1.25% 9.47% 0 3.64% 0.55% 3.09% 589.79 473.54 233D 1 66.40% 33.60% 0 3.69% 0.05% 3.64% 0 1.40% 0.05% 1.35% 705.52 342.59 Weekly 99.15% Adv Dec PUVU PUVD PDVU PDVD 37.64% 61.57% 19.39% 18.25% 17.30% 44.22% Moving Averages High/Lows Index Above Below Index Highs Lows Net 3W 1 53.14% 46.86% 1 37.14% 10.47% 26.67% 13W 1 74.63% 25.37% 1 26.52% 1.89% 24.63% 55W 1 61.62% 38.38% 0 5.98% 0.15% 5.83% 233W -1 30.61% 69.39% 0 1.15% 0.15% 1.00%
- 6. COB: Fri 28-Aug-09 Index Russell3000 - $RUA IdxMatch 2619 PriceUp -35.93% Symbol RUA-X 601.30 NumCons 2975 VolumeUp 2.99% Daily 98.18% Adv Dec PUVU PUVD PDVU PDVD 31.06% 67.13% 17.75% 13.31% 32.77% 34.22% Moving Averages High/Lows BreakOuts Levels Index Above Below Index Highs Lows Net Index Highs Lows Net Highs Lows 3D 1 37.21% 62.79% 1 30.72% 24.34% 6.39% 0 11.60% 11.87% (0.27%) 607.62 593.26 13D 1 59.53% 40.47% 1 21.24% 4.87% 16.37% 0 7.80% 2.18% 5.61% 607.62 571.43 55D 1 78.62% 21.38% 1 13.11% 1.04% 12.07% 0 5.18% 0.44% 4.74% 607.62 505.11 233D 1 70.18% 29.82% 0 4.47% 0.07% 4.40% 0 1.65% 0.07% 1.58% 707.82 384.41 Weekly 99.26% Adv Dec PUVU PUVD PDVU PDVD 42.22% 57.08% 21.24% 20.97% 17.08% 39.97% Moving Averages High/Lows Index Above Below Index Highs Lows Net 3W 1 58.69% 41.31% 1 42.08% 9.08% 33.01% 13W 1 79.66% 20.34% 1 31.06% 1.58% 29.48% 55W 1 64.77% 35.23% 0 5.78% 0.13% 5.65% 233W -1 32.44% 67.56% 0 1.21% 0.10% 1.11%
- 7. COB: Fri 28-Aug-09 Index S&P400 - $MID IdxMatch 2020 PriceUp -7.25% Symbol MID--X 663.15 NumCons 400 VolumeUp -4.75% Daily 98.25% Adv Dec PUVU PUVD PDVU PDVD 45.50% 52.75% 24.25% 21.25% 22.50% 30.25% Moving Averages High/Lows BreakOuts Levels Index Above Below Index Highs Lows Net Index Highs Lows Net Highs Lows 3D 1 51.00% 49.00% 1 37.50% 18.75% 18.75% 0 17.25% 5.25% 12.00% 669.37 648.10 13D 1 70.00% 30.00% 1 27.00% 5.50% 21.50% 0 11.75% 2.00% 9.75% 669.37 626.93 55D 1 86.50% 13.50% 1 16.75% 0.75% 16.00% 0 7.00% 0.25% 6.75% 669.37 539.04 233D 1 79.25% 20.75% 0 5.50% 0.00% 5.50% 0 2.00% 0.00% 2.00% 758.62 397.97 Weekly 99.50% Adv Dec PUVU PUVD PDVU PDVD 51.25% 48.25% 26.00% 25.25% 16.25% 32.00% Moving Averages High/Lows Index Above Below Index Highs Lows Net 3W 1 67.00% 33.00% 1 46.75% 8.25% 38.50% 13W 1 87.25% 12.75% 1 38.00% 1.00% 37.00% 55W 1 72.75% 27.25% 0 5.75% 0.00% 5.75% 233W -1 38.50% 61.50% 0 2.25% 0.00% 2.25%
- 8. COB: Fri 28-Aug-09 Index S&P600 - $SML IdxMatch 2742 PriceUp -43.67% Symbol SML--X 306.64 NumCons 600 VolumeUp 7.67% Daily 97.67% Adv Dec PUVU PUVD PDVU PDVD 27.00% 70.67% 16.50% 10.50% 36.17% 34.50% Moving Averages High/Lows BreakOuts Levels Index Above Below Index Highs Lows Net Index Highs Lows Net Highs Lows 3D -1 35.00% 65.00% 1 29.00% 27.50% 1.50% 0 8.50% 12.50% (4.00%) 311.66 302.96 13D 1 59.17% 40.83% 1 20.50% 4.33% 16.17% 0 5.50% 1.33% 4.17% 311.66 290.52 55D 1 79.33% 20.67% 1 12.50% 0.00% 12.50% 0 3.50% 0.00% 3.50% 311.66 252.11 233D 1 69.33% 30.67% 0 3.33% 0.00% 3.33% 0 1.33% 0.00% 1.33% 373.77 181.32 Weekly 98.83% Adv Dec PUVU PUVD PDVU PDVD 41.50% 57.33% 20.50% 21.00% 16.83% 40.50% Moving Averages High/Lows Index Above Below Index Highs Lows Net 3W 1 60.00% 40.00% 1 42.50% 9.17% 33.33% 13W 1 79.83% 20.17% 1 31.00% 0.83% 30.17% 55W 1 64.33% 35.67% 0 5.67% 0.00% 5.67% 233W -1 34.33% 65.67% 0 1.00% 0.00% 1.00%