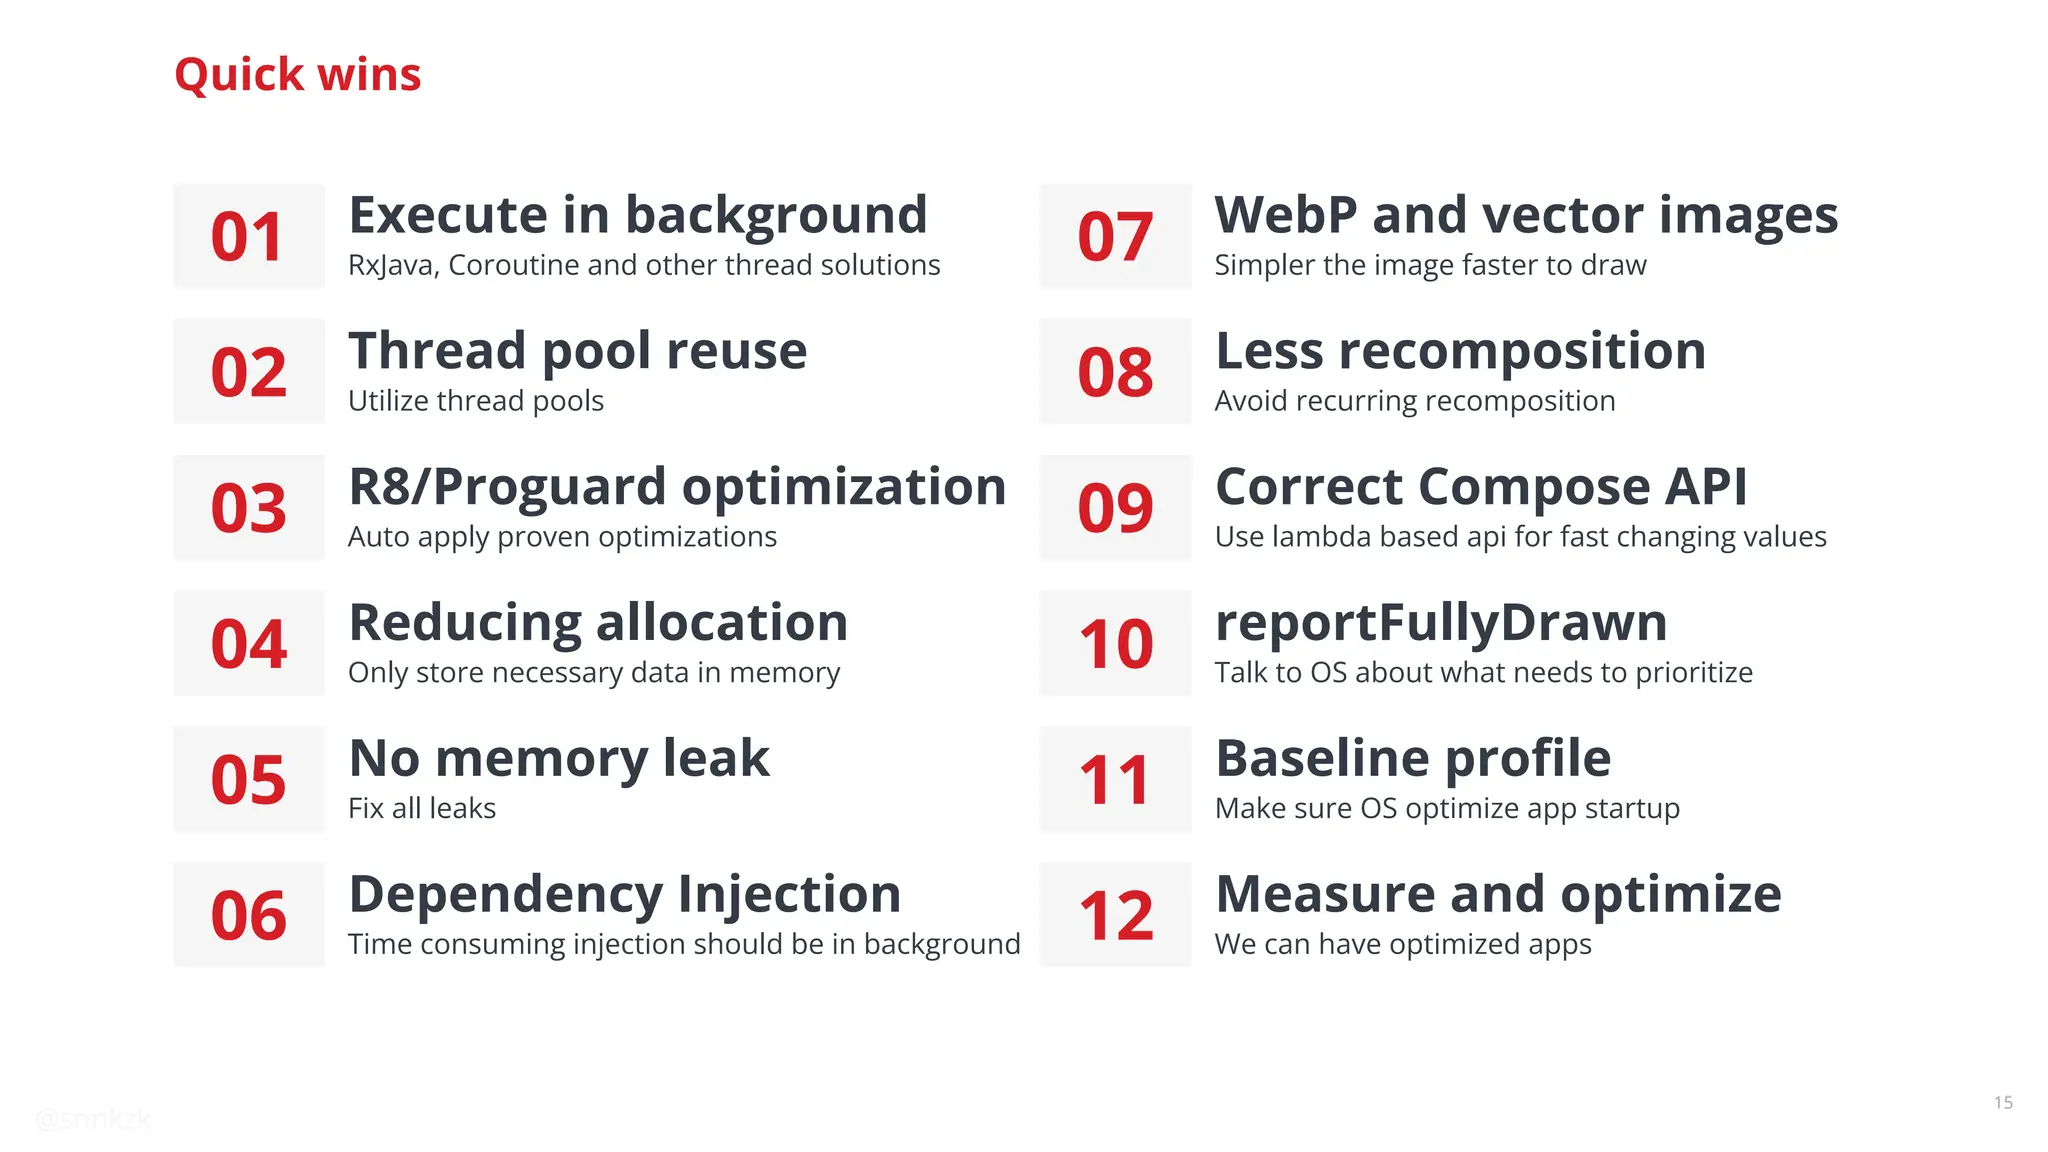
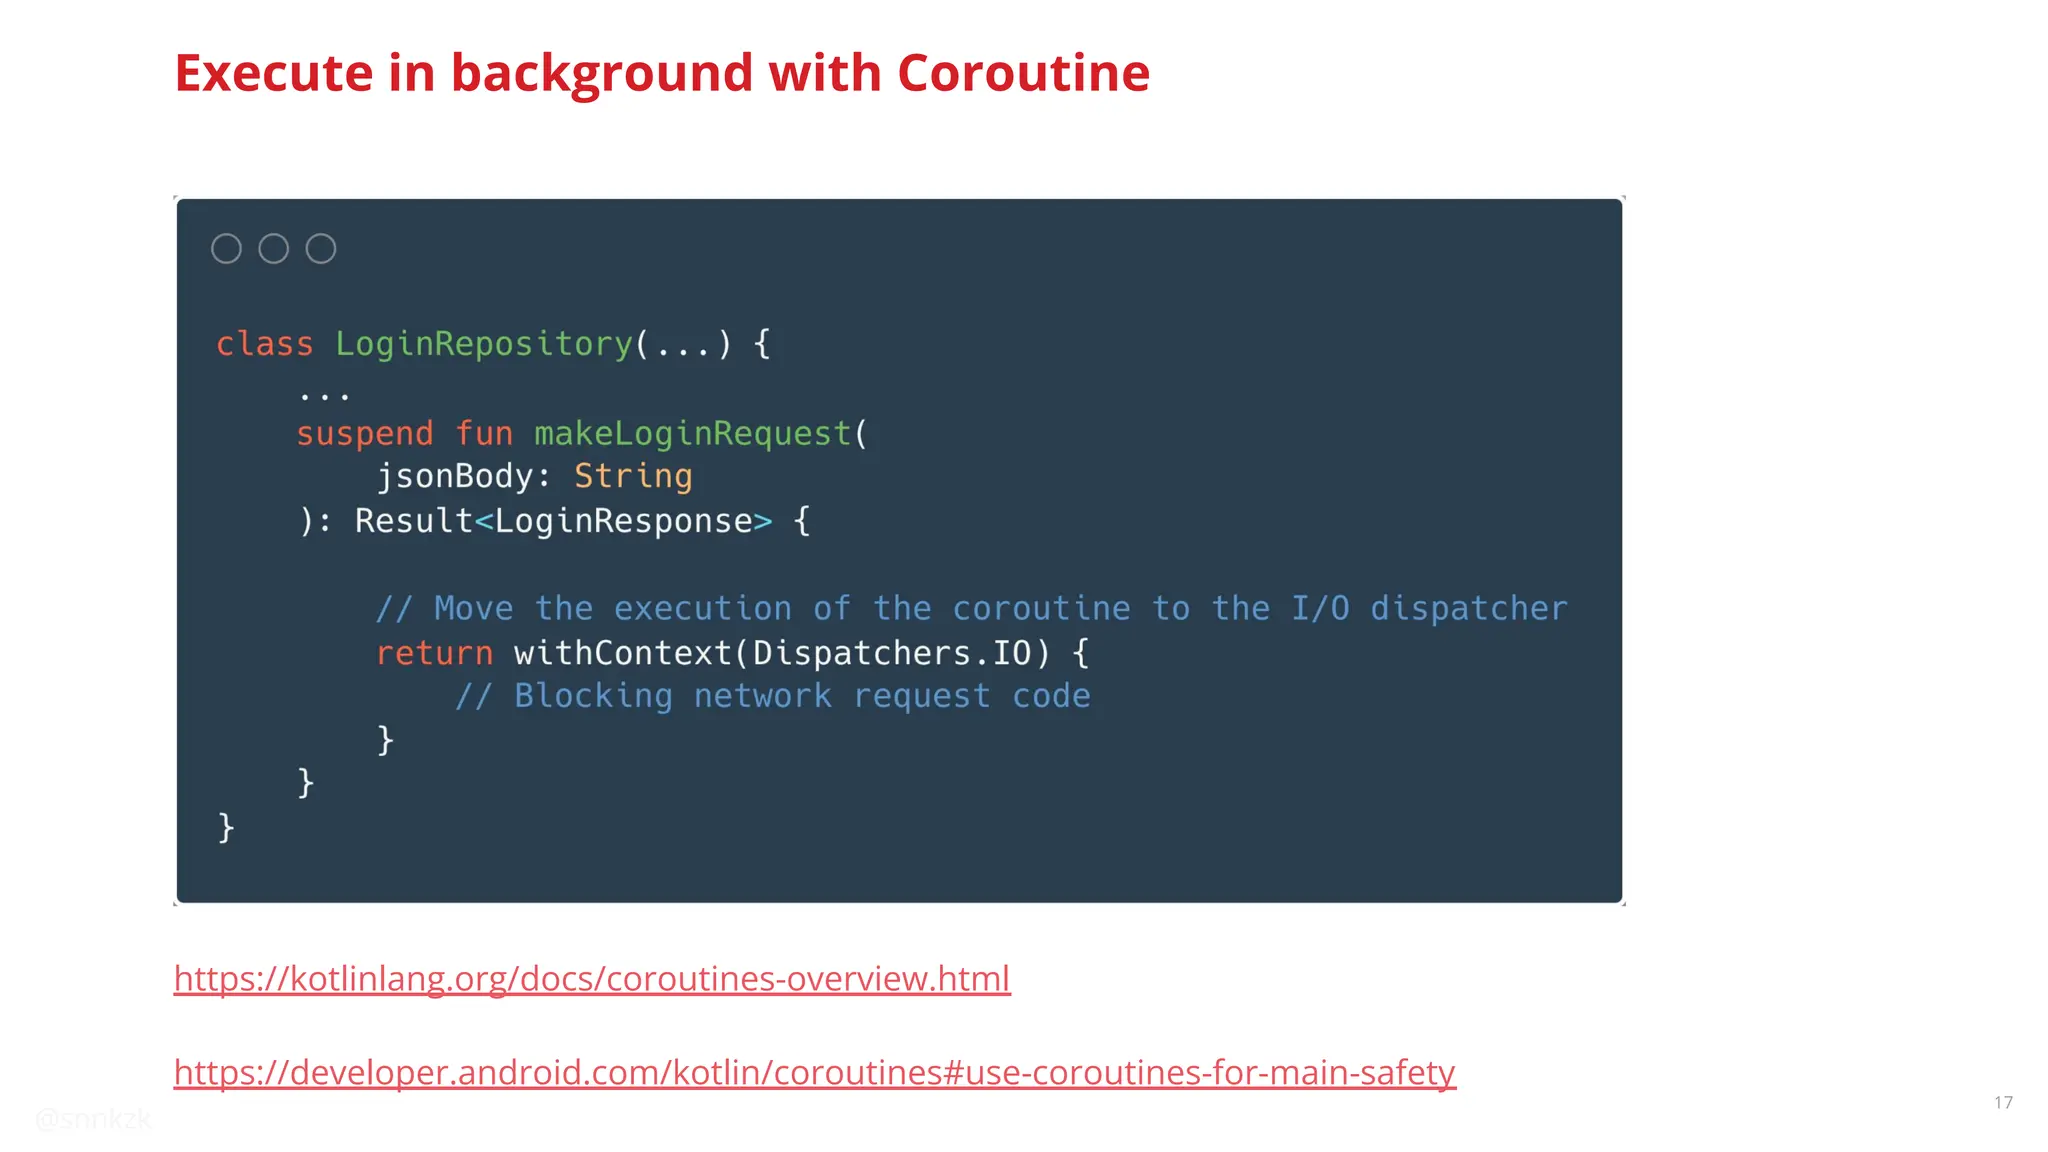
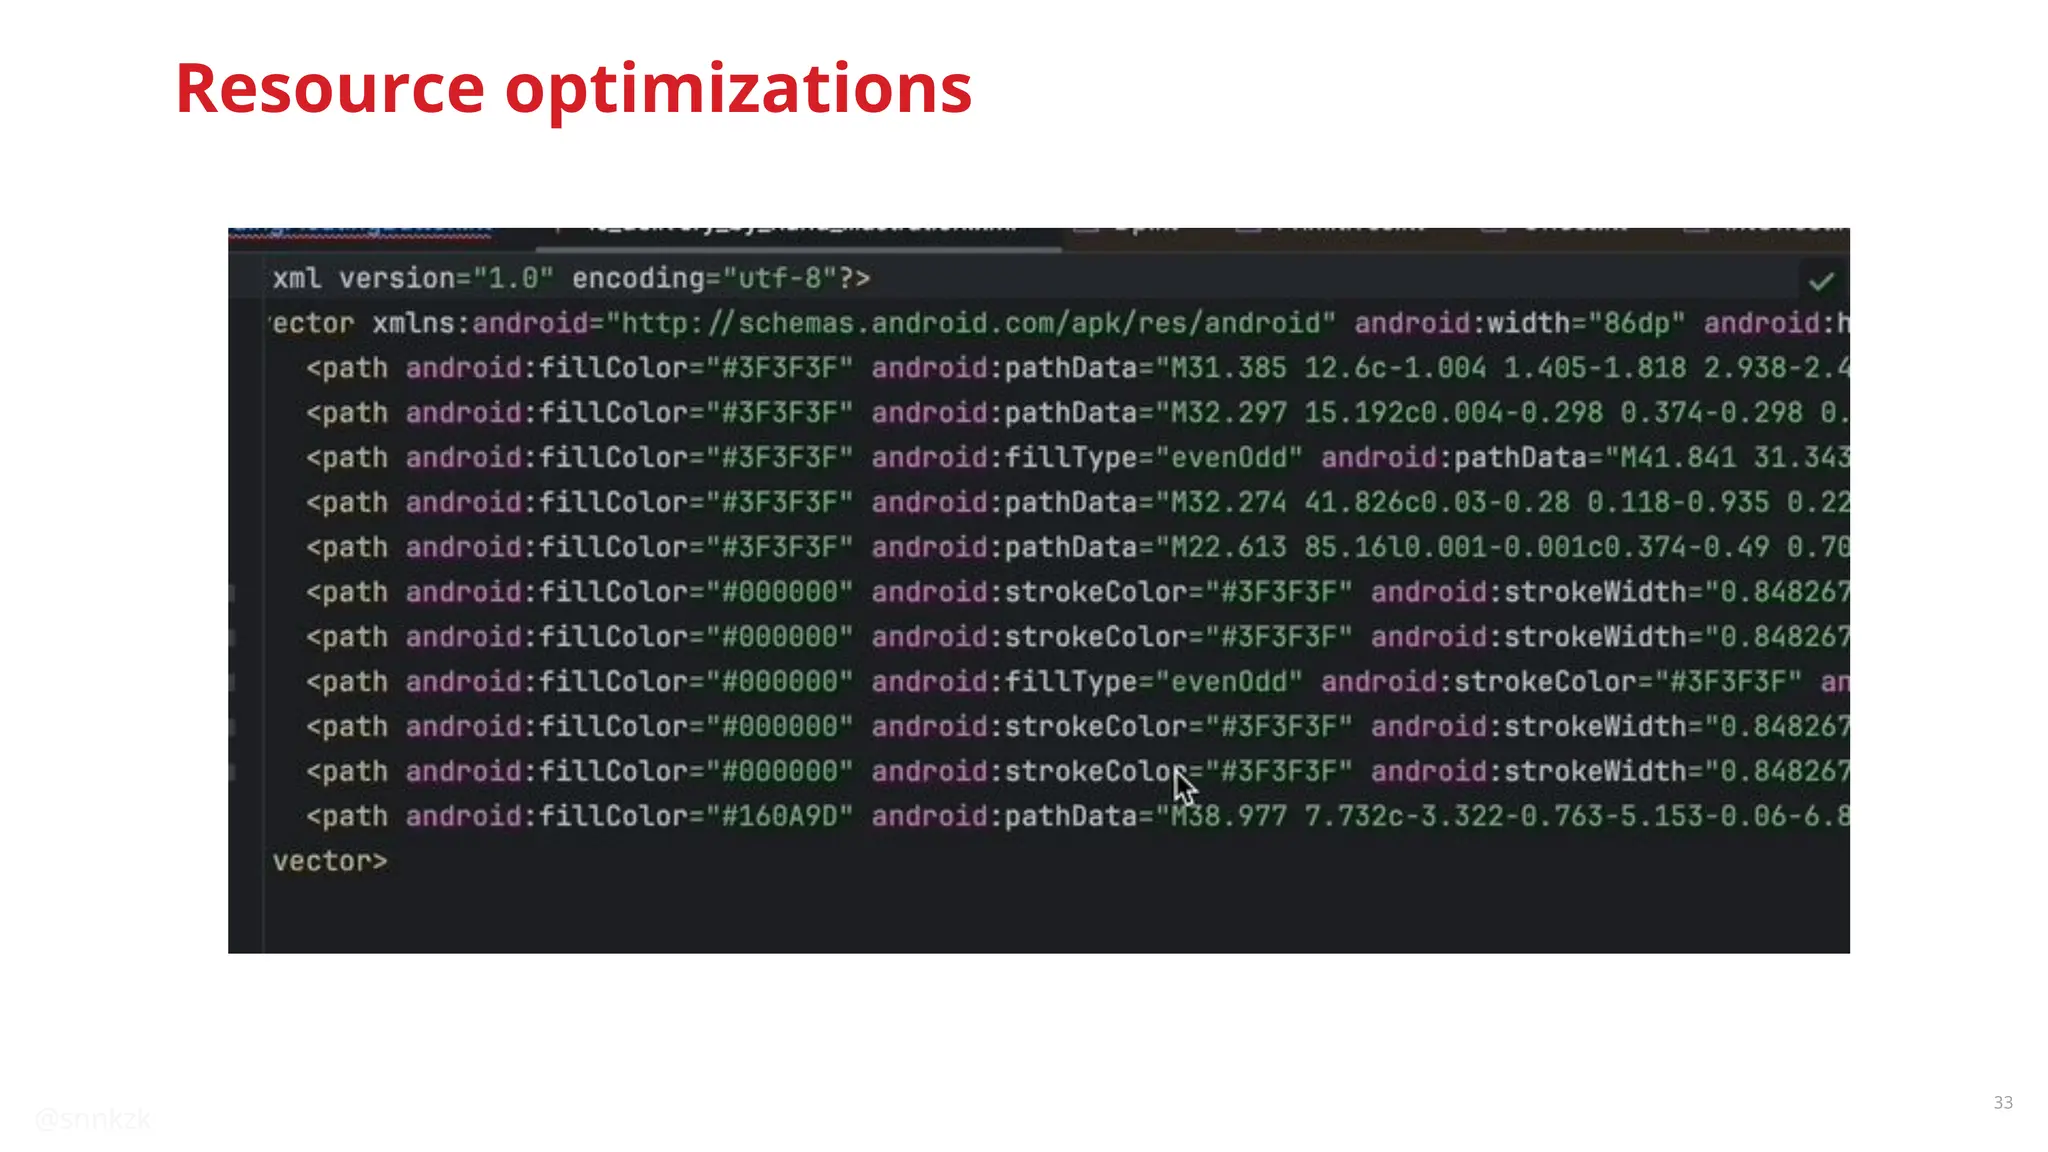
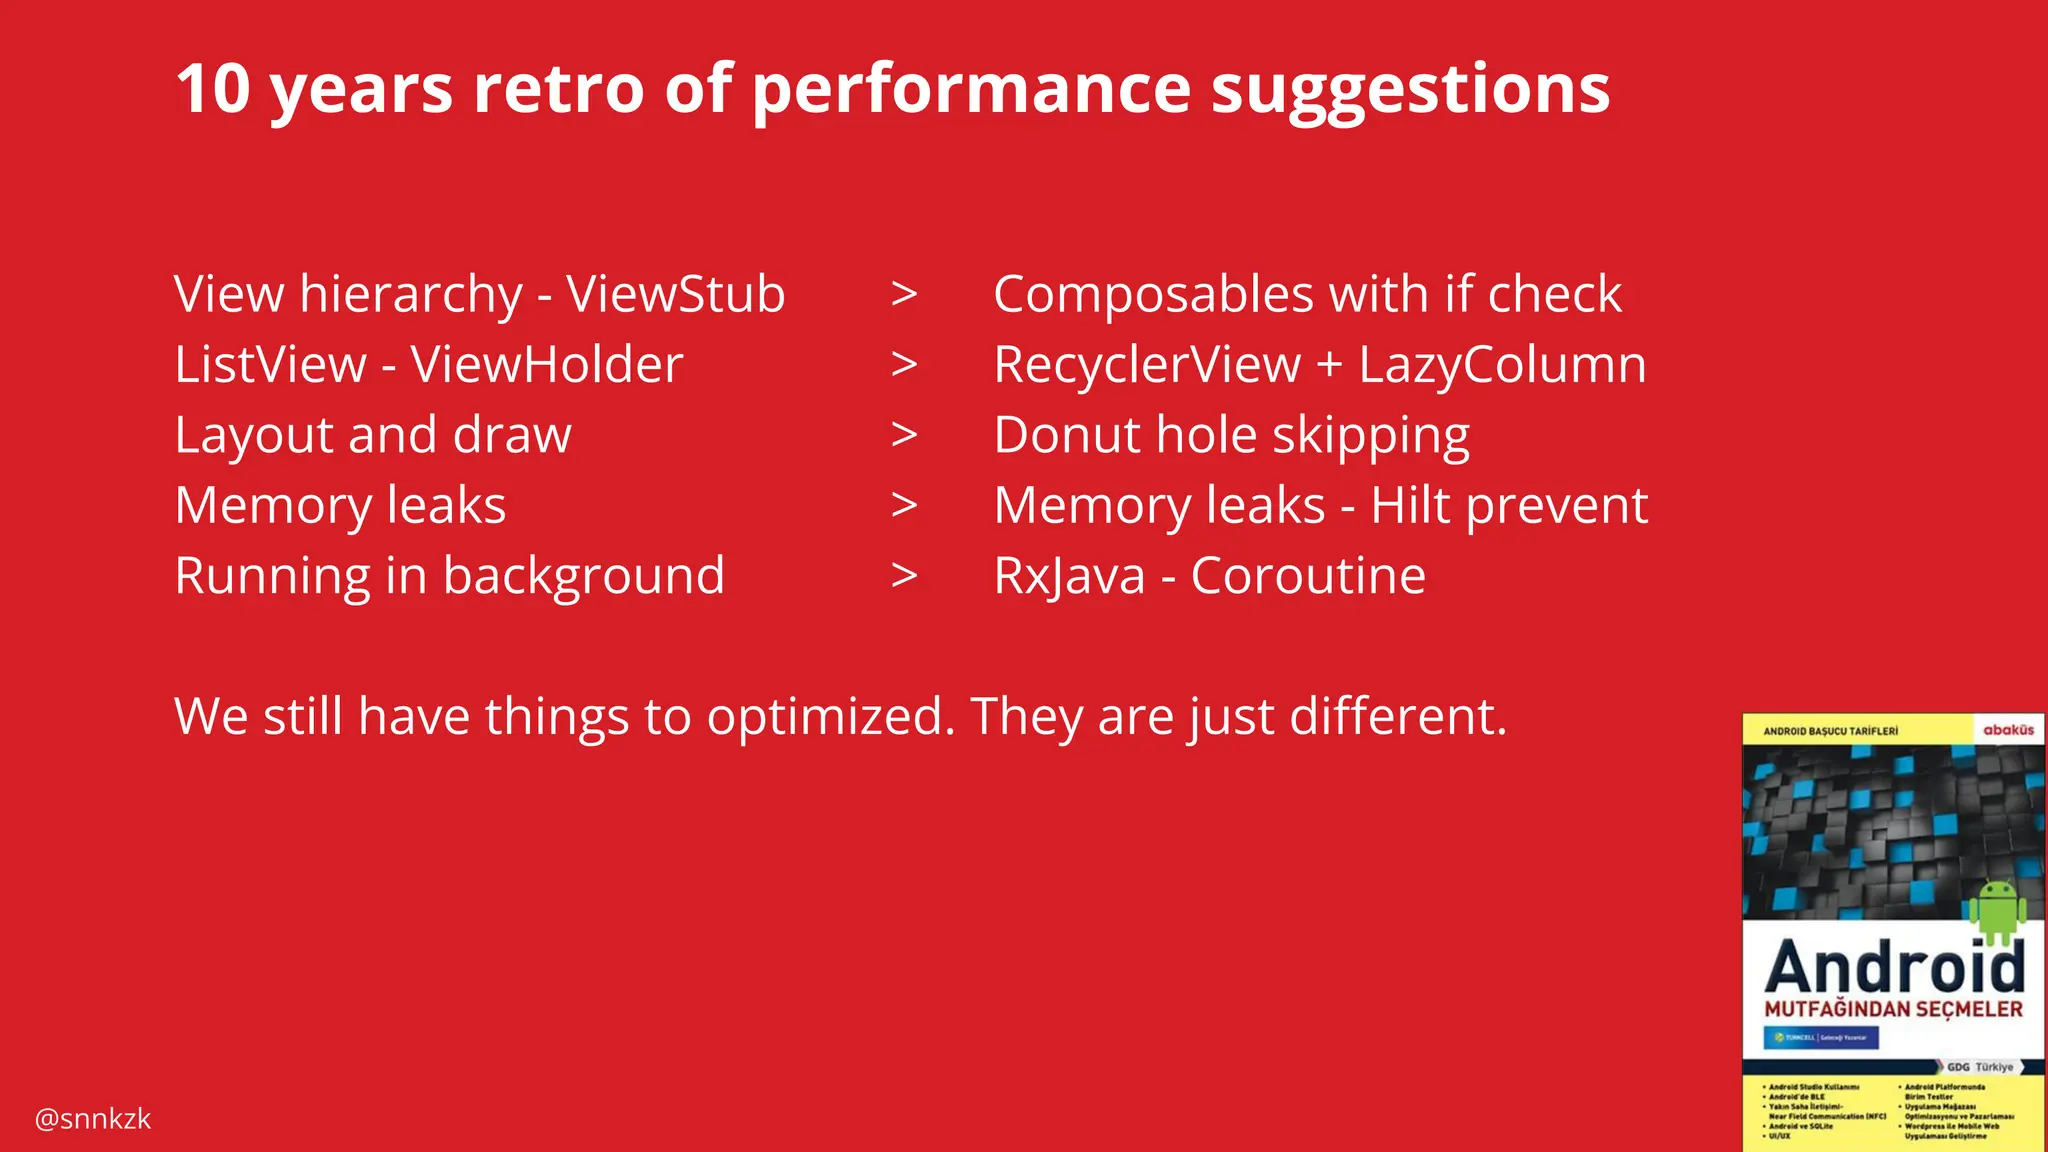
In the realm of Android development, the main thread is our stage, but too often, it becomes a battleground where performance issues arise, leading to ANRs, frozen frames, and sluggish Uls. As we strive for excellence in user experience, understanding and optimizing the main thread becomes essential to prevent these common performance bottlenecks.
We have strategies and best practices for keeping the main thread uncluttered. We'll examine the root causes of performance issues and techniques for monitoring and improving main thread health as well as app performance.
In this talk, participants will walk away with practical knowledge on enhancing app performance by mastering the main thread. We'll share proven approaches to eliminate real-life ANRs and frozen frames to build apps that deliver butter smooth experience.
Unblocking The Main Thread Solving ANRs and Frozen Frames
1. @snnkzk
Unblocking The Main Thread:
Solving ANRs and Frozen Frames
Sinan Kozak
Staff Android Developer
Google Developer Expert
2. @snnkzk
2
Sinan Kozak
12 years Android experience
@snnkzk
I wrote a chapter about performance in 2014
book with GDG community Ankara, Turkey.
If you cannot find my book,
It could be sold out or maybe outdated already.
8. @snnkzk
8
Between 16ms and 700ms
Scroll
Animations
Frame render
Slow Rendering
Between 700ms and 5s
App startup
Navigation
Frozen Frame
Over 5s
Not being able to handle
user input
Unusable
Application Not Responding
Different stages of Jank
9. @snnkzk
9
Can slow runtime cause app crashes?
YES
● User will continue to click the screen. New click events will be
handled based on previous screen state.
● Foreground services might crash because their start will be
delayed
11. @snnkzk
11
How to measure?
Data from user
● Firebase Performance Monitoring or similar solutions
● JankStat library
● Memory leaks from test users
Data from profiling
● Systrace
● CPU
● Allocation and memory
● Layout inspector and debugger
● perfetto.dev
15. @snnkzk
15
Quick wins
01 Execute in background
RxJava, Coroutine and other thread solutions
02 Thread pool reuse
Utilize thread pools
03 R8/Proguard optimization
Auto apply proven optimizations
04 Reducing allocation
Only store necessary data in memory
05 No memory leak
Fix all leaks
06 Dependency Injection
Time consuming injection should be in background
07 WebP and vector images
Simpler the image faster to draw
08 Less recomposition
Avoid recurring recomposition
09 Correct Compose API
Use lambda based api for fast changing values
10 reportFullyDrawn
Talk to OS about what needs to prioritize
11 Baseline profile
Make sure OS optimize app startup
12 Measure and optimize
We can have optimized apps
16. @snnkzk
16
Use multi thread
solutions
● IO operations
● Data parsing
● Encryption
● Any time consuming operation
Move work to the background
Photo by Campbell on Unsplash
17. @snnkzk
17
Execute in background with Coroutine
https://kotlinlang.org/docs/coroutines-overview.html
https://developer.android.com/kotlin/coroutines#use-coroutines-for-main-safety
19. @snnkzk
19
Share Thread Pools
Most of features have their own thread pool
● RxJava
● Coroutine
● OkHttp
● Image loader
● AsyncTask
● AndroidX arch components
● RecyclerView + DiffUtil
● WorkManager
● … many more
And they have APIs to change thread pool
20. @snnkzk
20
Share Thread Pools
We shared Coroutine Dispatchers with
● RxJava
● OkHttp
● Coil
● WorkManager
Thread count reduced 180+ to 130~ after refresh action
“asOkHttpExecutorService” is a custom implementation that only handle execute function
21. @snnkzk
21
R8 and proguard are mainly obfuscation tools, but…
They also shrink and optimize codes.
In order to optimize your app even further, R8 inspects your code at a deeper level to
remove more unused code or, where possible, rewrite your code to make it less
verbose. The following are a few examples of such optimizations:
● If your code never takes the else {} branch for a given if/else statement, R8
might remove the code for the else {} branch.
● If your code calls a method in only a few places, R8 might remove the method
and inline it at the few call sites.
Prefer "proguard-android-optimize.txt" over default
Improve app performance by up to 30%
R8/Proguard optimization
22. @snnkzk
22
More resources optimizations
High level documentation
https://developer.android.com/build/shrink-code
https://www.guardsquare.com/manual/configuration/optimizations
Detailed posts
https://jakewharton.com/blog/
25. @snnkzk
25
In your heap dump, look for memory leaks caused by any of the following:
● Long-lived references to Activity, Context, View, Drawable, and other objects
that might hold a reference to the Activity or Context container.
● Non-static inner classes, such as a Runnable, that can hold an Activity instance.
● Caches that hold objects longer than necessary.
Memory leak
In your heap dump, look for memory leaks caused by any of the
following:
● Long-lived references to Activity, Context, View, Drawable, and
other objects that might hold a reference to the Activity or
Context container.
● Non-static inner classes, such as a Runnable, that can hold an
Activity instance.
● Caches that hold objects longer than necessary.
31. @snnkzk
31
WebP
WebP is an image file format from Google that provides lossy compression
(like JPEG) as well as transparency (like PNG) but can provide better
compression than either JPEG or PNG
Average %26 less space
More efficient
Android Studio can convert images
https://developer.android.com/studio/write/convert-webp
Resource optimizations
32. @snnkzk
32
Resource optimizations
Vector Drawables
is a vector graphic defined in an XML file as a
set of points, lines, and curves along with its
associated color information.
Scalable
svg can be converted to Vector drawables
Simpler is better
The initial loading of a vector drawable can cost
more CPU cycles than the corresponding raster
image.
Size save should be justified with performance
Use Avocado tool to simplify complex vectors
https://github.com/alexjlockwood/avocado
35. @snnkzk
35
Recomposition
Recompose count shouldn’t affect correctness.
The compose runtime might end up recomposing a lot more than
you’d expect.
Just looking at the code does not reveal reasons.
Functions can be inline
Classes can be mutable
37. @snnkzk
37
Donut hole skipping
● Lambdas are special in Compose
● The runtime keeps track of values used in lambdas
● Lambdas get reevaluated if values change
● Composable can be skipped if they are not affected by change
41. @snnkzk
41
Baseline Profiles
● Helps app startup after new install or update
● Android run ahead of time compile to prepare app startup
● We can modify and create aggregated profiles
● Libraries can have their own baseline profiles
● Compose benefit from baseline profiles
https://developer.android.com/topic/performance/baselineprofiles/create-baselineprofile
42. @snnkzk
42
Measure as much as you can
● Collect data from production
● Profile a variant close to release
● Measure high level first
● Add more granular metrics
● Use benchmark tests
● Profile before and after changes
47. @snnkzk
47
10 years retro of performance suggestions
View hierarchy - ViewStub > Composables with if check
ListView - ViewHolder > RecyclerView + LazyColumn
Layout and draw > Donut hole skipping
Memory leaks > Memory leaks - Hilt prevent
Running in background > RxJava - Coroutine
We still have things to optimized. They are just different.