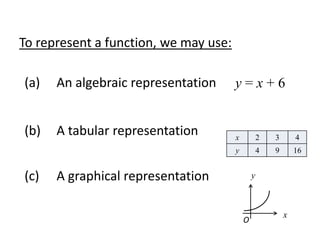
This document discusses different ways to represent functions:
(1) Algebraically using an equation like y=x+6
(2) Using a table of x-y pairs
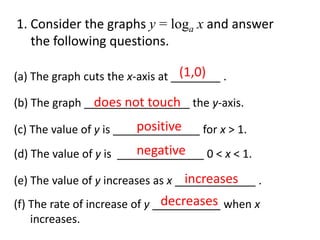
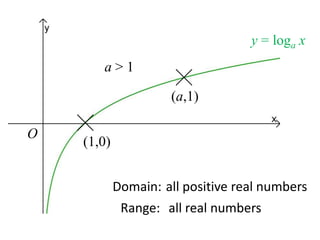
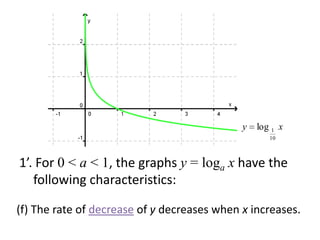
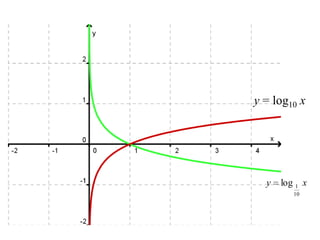
(3) Graphically by plotting the relationship between x and y
It provides examples of each type of representation.