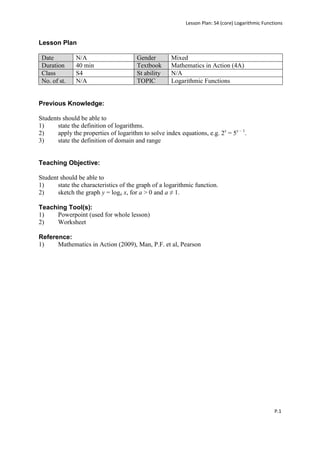
The document is a lesson plan for teaching logarithmic functions to S4 students, focusing on defining logarithms and their graph characteristics. It includes time allocations, teaching tools such as PowerPoint and worksheets, and class activities aimed at understanding the properties and visual representation of logarithmic functions. Key objectives are for students to sketch graphs and understand the domain and range of logarithmic functions.

![Lesson Plan: S4 (core) Logarithmic Functions
Pf:
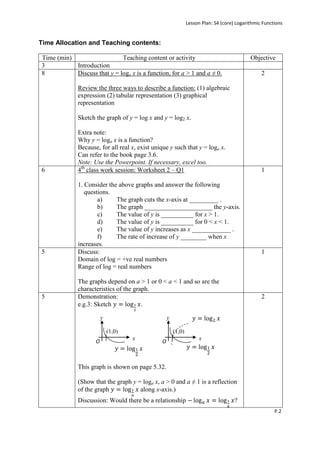
5 Demonstration: 2
e.g.4: Sketch the graph of y = log4 x.
y
y = log2 x
y = log8 x
x
O
[Answer: The dotted-line is the graph of y = log4 x.
Reason: put in the same x (e.g. 64), log8 64 = log8 82 = 2
log2 64 = log2 26 = 6 log2 64 > log8 64]
Discuss: To get the general relation that for x > 1, if a > b > 1,
the loga x < logb x.
6 5th Class work session: 2
Sketch the graph of and .
2 Summary
P.3](https://image.slidesharecdn.com/logchar-120103225137-phpapp01/85/Log-char-3-320.jpg)