Downloaded 60 times

![Obstructive abnormalities
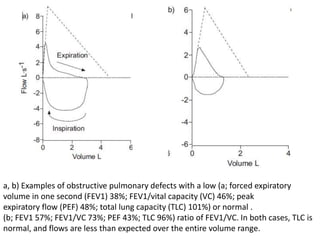
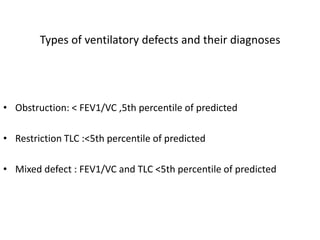
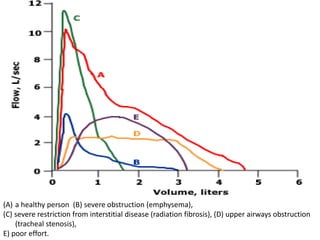
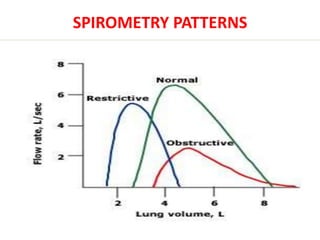
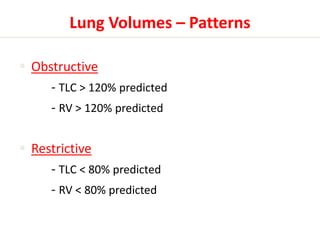
An obstructive ventilatory defect is a disproportionate reduction
of maximal airflow from the lung in relation to the
maximal volume (i.e. VC) that can be displaced from the lung
[45–47]. It implies airway narrowing during exhalation and is
defined by a reduced FEV1/VC ratio below the 5th percentile
of the predicted value.
The earliest change associated with airflow obstruction in
small airways is thought to be a slowing in the terminal
portion of the spirogram, even when the initial part of the
spirogram is barely affected](https://image.slidesharecdn.com/pft-141102070145-conversion-gate02/85/Pft-13-320.jpg)
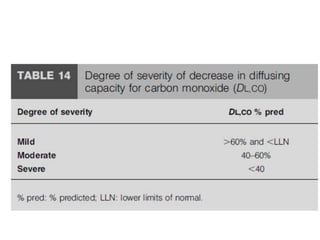
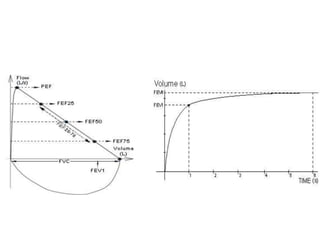
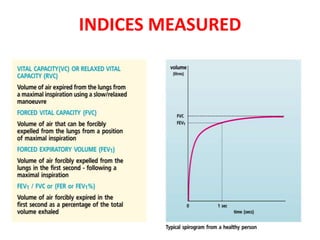
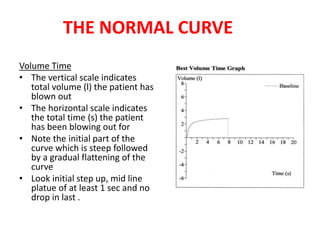
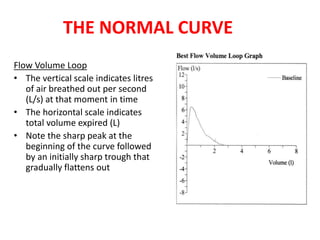
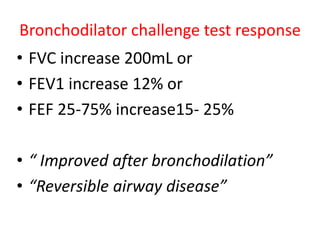
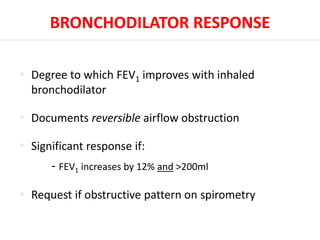
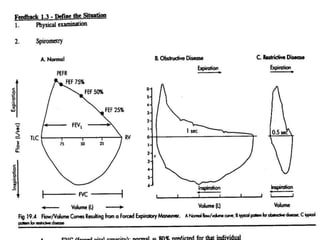

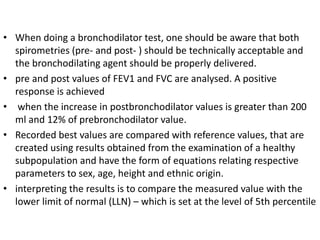
Pulmonary function tests measure how an individual inhales and exhales air over time. Spirometry evaluates lung function through acceptability criteria, reproducibility criteria, and comparison to reference values to identify obstructive, restrictive, or mixed lung patterns. Interpretation involves assessing the flow-volume loop and volume-time curve for start and end-of-test criteria and comparing values like FEV1, FVC, and their ratio to predicted values and determination of limits of normal. A bronchodilator response test evaluates change in values after administration of a bronchodilator.


