Downloaded 102 times


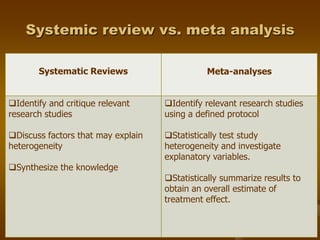
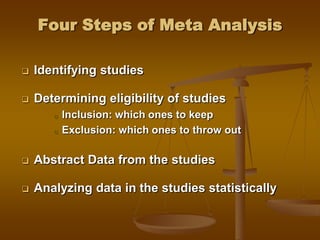


ANOVA and meta-analysis are statistical techniques used to analyze data from multiple groups or studies. ANOVA allows researchers to determine if variability between groups is statistically significant or due to chance. It compares the means of three or more independent groups and tests the hypothesis that their means are equal. Meta-analysis systematically combines results from independent studies on a topic to obtain an overall estimate of effect. It involves identifying relevant studies, determining their eligibility, abstracting their data, and statistically analyzing the data to summarize results. Both techniques provide a more robust analysis than examining individual studies alone.