The document discusses statistical concepts such as parameters, statistics, hypotheses testing, types of hypotheses and errors. It provides examples of hypotheses testing for single population means. The key points are:
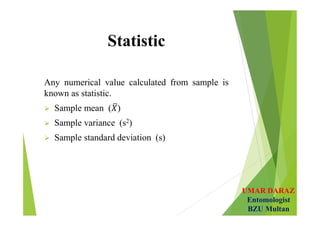
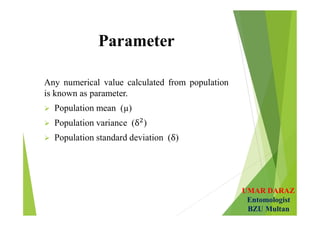
- Statistics are values calculated from samples while parameters are from populations.
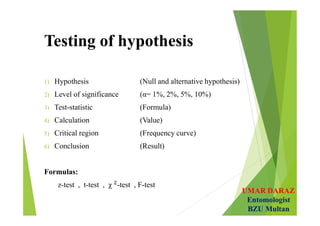
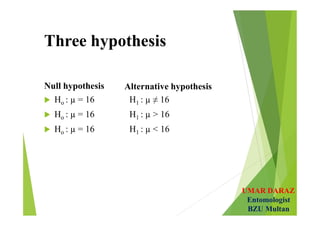
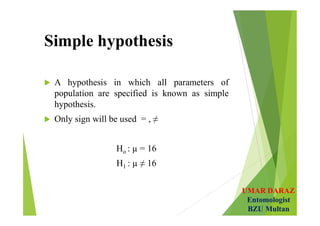
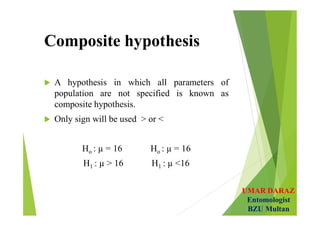
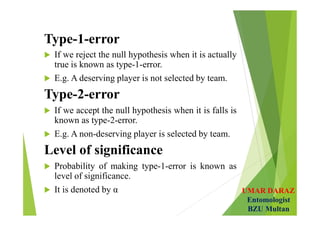
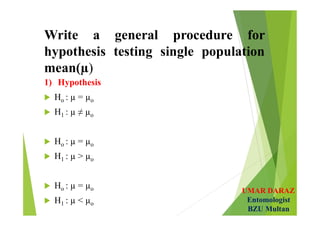
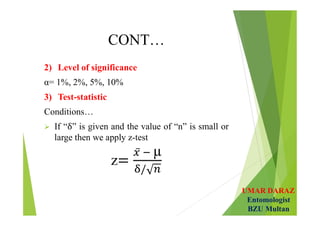
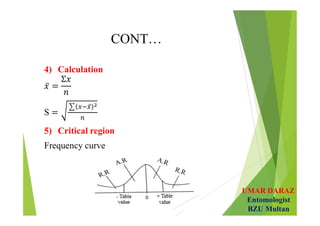
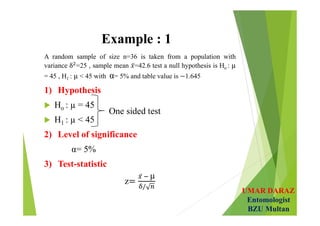
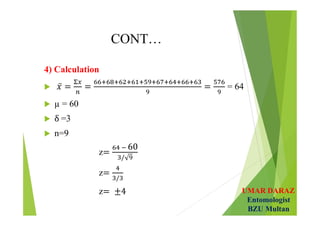
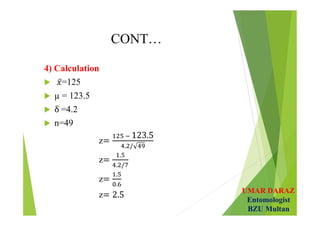
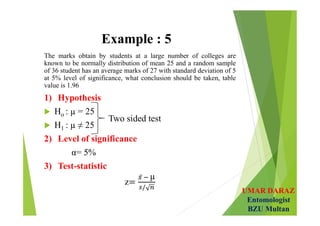
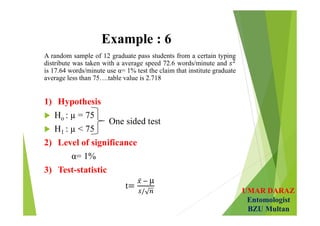
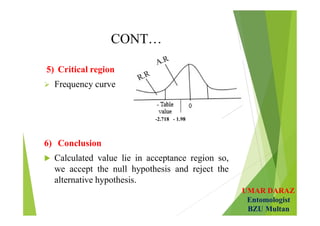
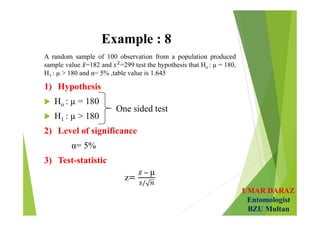
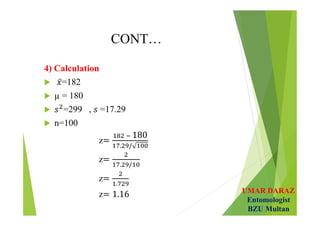
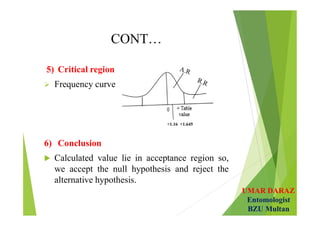
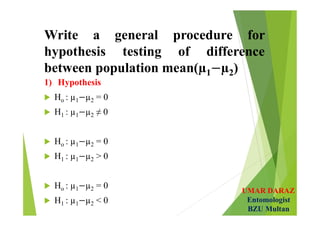
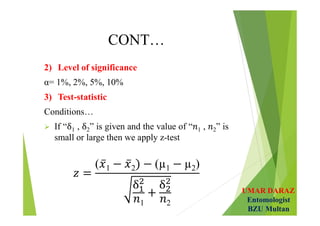
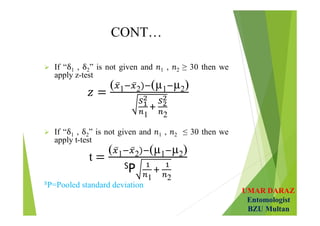
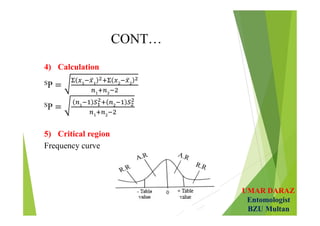
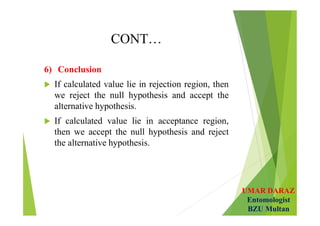
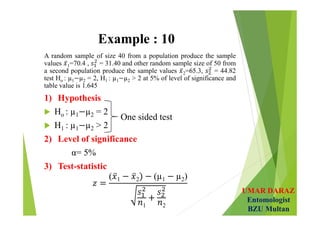
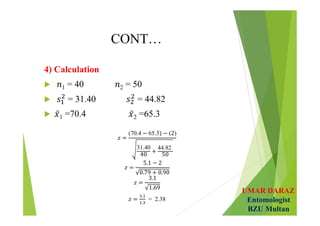
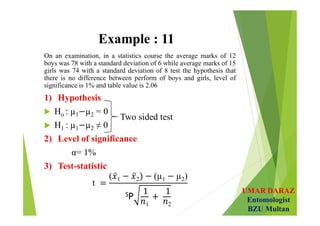
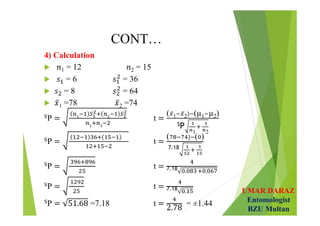
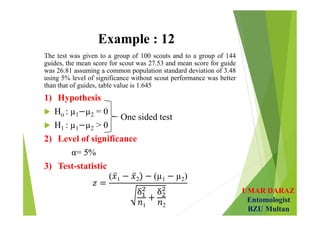
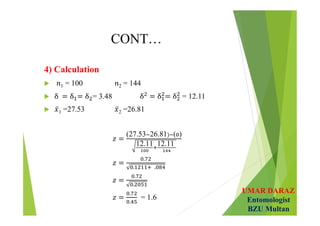
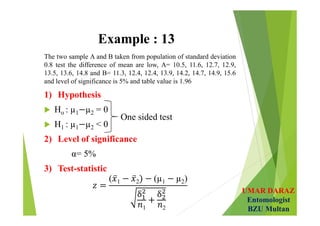
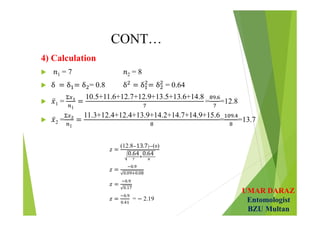
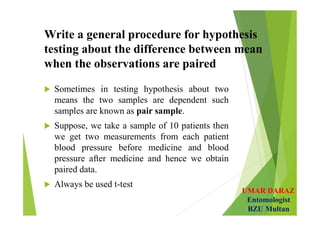
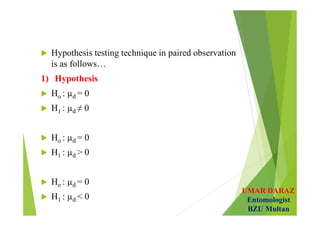
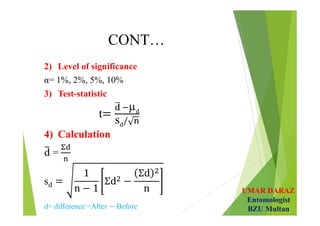
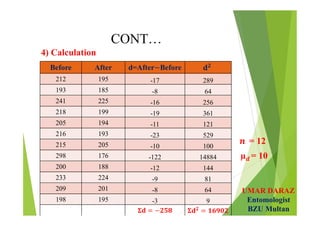
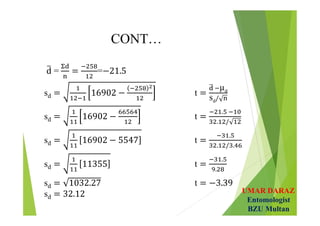
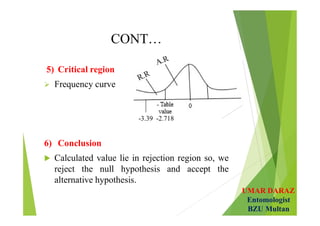
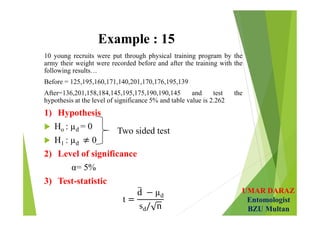
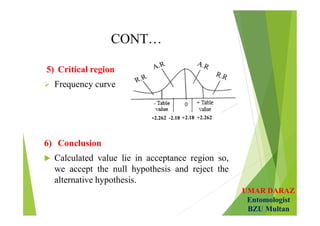
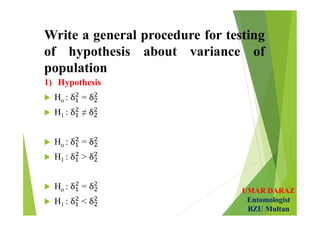
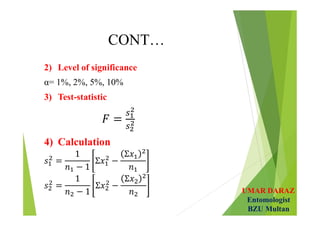
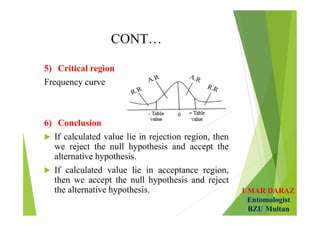
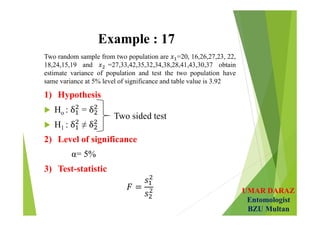
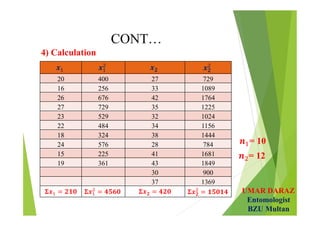
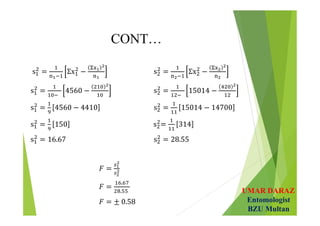
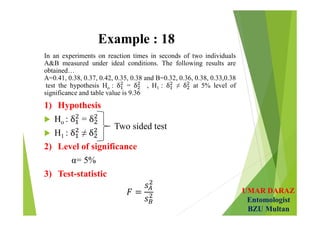
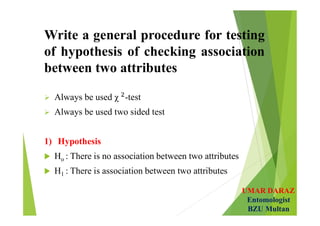
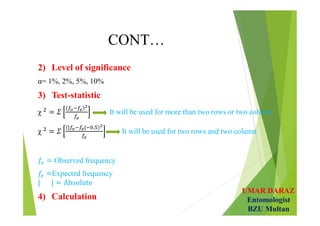
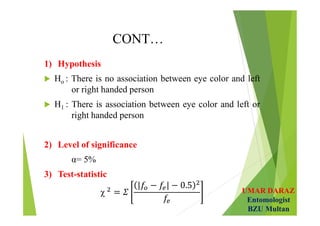
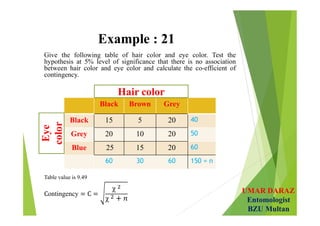
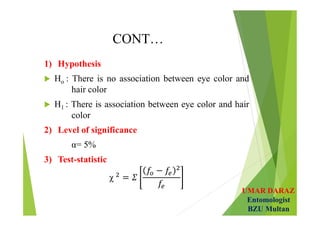
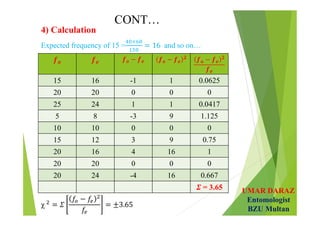
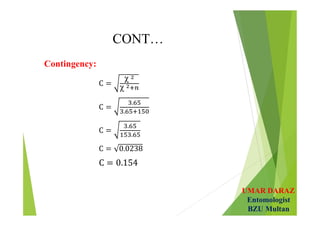
- Hypotheses testing involves defining null and alternative hypotheses, significance level, calculating test statistic and concluding whether to reject or fail to reject the null hypothesis.
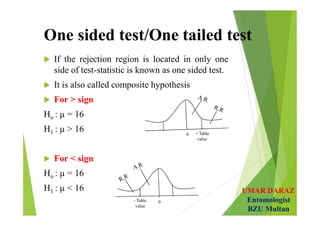
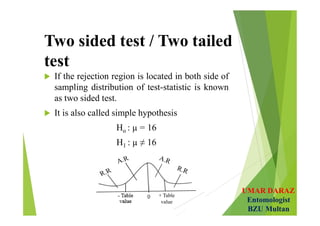
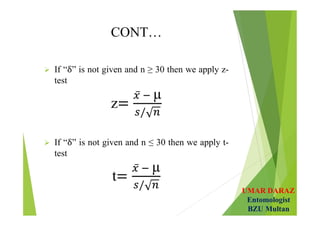
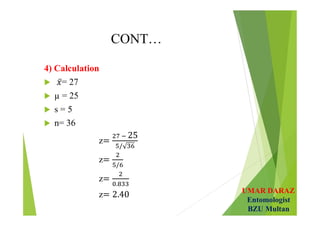
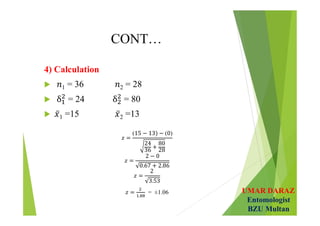
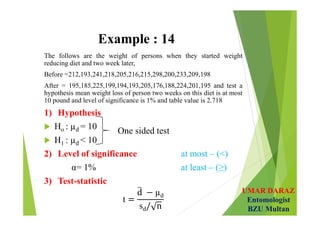
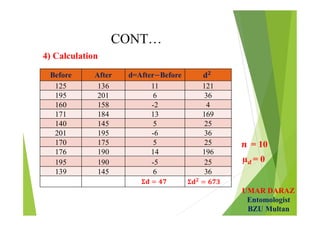
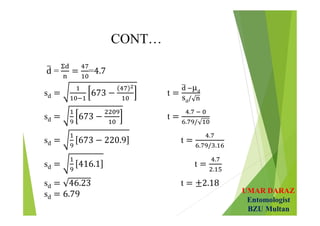
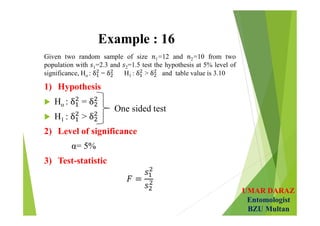
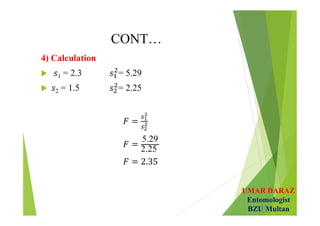
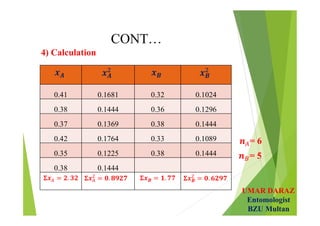
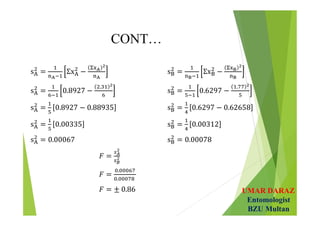
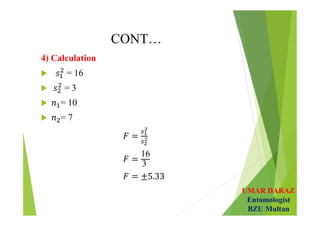
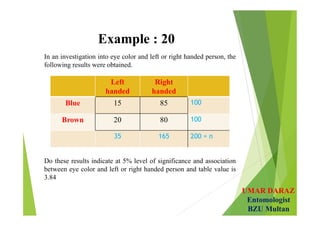
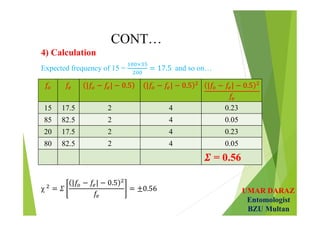
- Examples demonstrate hypotheses testing for single means using z-test and t-test at various significance levels and determining the critical regions.