Quality Analysis of Food Grains and Liquids
•
0 likes•34 views

This document summarizes a research paper that analyzes the quality of food grains and liquids using digital image processing techniques. The paper segments images of different types of rice (e.g. basmati, sonamasoor, brown rice) using thresholding and morphological operations. It then extracts geometrical features from the segmented images to classify and count the rice grains. The paper finds the mean squared error and peak signal-to-noise ratio between original and processed images to quantify accuracy. A similar process is applied to images of liquids like kerosene and petrol to detect impurities by changes in pixel values when mixed. The techniques achieved 100% accuracy in classifying pure versus impure food grains and liquids.

Recommended
Recommended
More Related Content
What's hot
What's hot (10)
Similar to Quality Analysis of Food Grains and Liquids
Similar to Quality Analysis of Food Grains and Liquids (20)
More from IRJET Journal
More from IRJET Journal (20)
Recently uploaded
Recently uploaded (20)
Quality Analysis of Food Grains and Liquids
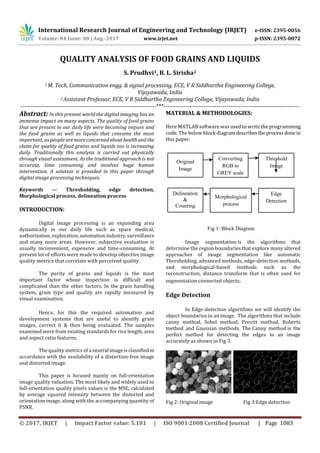
- 1. International Research Journal of Engineering and Technology (IRJET) e-ISSN: 2395-0056 Volume: 04 Issue: 08 | Aug -2017 www.irjet.net p-ISSN: 2395-0072 © 2017, IRJET | Impact Factor value: 5.181 | ISO 9001:2008 Certified Journal | Page 1083 QUALITY ANALYSIS OF FOOD GRAINS AND LIQUIDS S. Prudhvi1, B. L. Sirisha2 1 M. Tech, Communication engg. & signal processing, ECE, V R Siddhartha Engineering College, Vijayawada, India 2 Assistant Professor, ECE, V R Siddhartha Engineering College, Vijayawada, India ---------------------------------------------------------------------***--------------------------------------------------------------------- Abstract: In this present world the digital imaging has an immense impact on many aspects. The quality of food grains that are present in our daily life were becoming impure and the food grains as well as liquids that consume the most important, as people are moreconcernedabouthealthand the claim for quality of food grains and liquids too is increasing daily. Traditionally this analysis is carried out physically through visual assessment. As the traditional approach is not accurate, time consuming and involves huge human intervention. A solution is provided in this paper through digital image processing techniques. Keywords — Thresholding, edge detection, Morphological process, delineation process INTRODUCTION: Digital image processing is an expanding area dynamically in our daily life such as space medical, authorization,exploration,automationindustry,surveillance and many more areas. However, subjective evaluation is usually inconvenient, expensive and time-consuming. At present lot of efforts were made to develop objective image quality metrics that correlate with perceived quality. The purity of grains and liquids is the most important factor whose inspection is difficult and complicated than the other factors. In the grain handling system, grain type and quality are rapidly measured by visual examination. Hence, for this the required automation and development systems that are useful to identify grain images, correct it & then being evaluated. The samples examined were from existing standards for rice length, area and aspect ratio features. The quality metrics of a neutral imageisclassifiedin accordance with the availability of a distortion-free image and distorted image. This paper is focused mainly on full-orientation image quality valuation. The most likely and widely used to full-orientation quality pixels values is the MSE, calculated by average squared intensity between the distorted and orientation image, along with the accompanying quantity of PSNR. MATERIAL & METHODOLOGIES: Here MATLAB software was used to write the programming code. The below block diagramdescribestheprocessdonein this paper. Image segmentation is the algorithms that determine the region boundaries that explore many altered approaches of image segmentation like automatic Thresholding, advanced methods, edge-detection methods, and morphological-based methods such as the reconstruction, distance transform that is often used for segmentation connected objects. Edge Detection In Edge-detection algorithms we will identify the object boundaries in an image. The algorithms that include canny method, Sobel method, Previtt method, Roberts method and Gaussian methods. The Canny method is the perfect method for detecting the edges in an image accurately as shown in Fig 3. Fig 2: Original image Fig 3:Edge detection Original Image Delineation & Counting Morphological process Edge Detection Threshold Image Converting RGB to GREY scale Fig 1: Block Diagram
- 2. International Research Journal of Engineering and Technology (IRJET) e-ISSN: 2395-0056 Volume: 04 Issue: 08 | Aug -2017 www.irjet.net p-ISSN: 2395-0072 © 2017, IRJET | Impact Factor value: 5.181 | ISO 9001:2008 Certified Journal | Page 1084 Morphological Operators Morphological operators are segmented to enable an image into regions, detect edges or perform sketch on regions. Morphological functions include: Reconstruction Distance transform Watershed segmentation Labelling of connected components Feature Extraction Feature Extraction is the default method for extracting the quantitative information from segmented Images. Classifications and object recognitionareperformed based on variousalgorithms ofmorphological features.Some of the classified morphological features can contain irrelevant and redundant noisy information. Geometrical Features The geometrical parameters gives basic information about the shape and size of grains. Area: It refers to the amount of pixelsthatarepresentin the region, i.e. the pixels with level “1”. Major Axis Lenght: The object at which the Length of the major axis of ellipse with respect to the same second order normalized central moment. Minor Axis Lenght: The object at which theLengthofthe minor axis of ellipse with respect to the same second order normalized central moment. ConvexArea: The object enclosing the Area of the smallest convex shape. Eccentricity: The relation between the distance of the focus of the ellipse and the length of the principal axis is known as eccentricity. The delineation process was done to the inputimageandthe morphological processed image. The countoftheobjects are also displayed. By this, the count of given image must be equal to the unwanted and delineation count. ALGORITHM: 1. Take a picture of Rice grain samples. 2. The image is resized due to high resolution and its size. 3. The image is converted to grey scale and increasing the grey scale image pixel values for thresholding. 4. In threshold I use Otsu’s method for convertinginto binary image. 5. The morphological process is done for the binary image that will compare the pixel values of binary image and the input. 6. By using some techniques finding the countofinput image and the image that was identified after eliminating the unwanted objects. 7. The image that was delineated will be displayed by counting the objects. 8. Finding the Average of MSE and PSNR values. RESULTS & TABLE: Analysis of Sonamasoor Rice: Fig 4: Original image Fig5: Rgb to grey Fig 6: Threshold image Fig7:Countingtheobjects of original image Fig 8: counting the objects after detecting unwanted objects Analysis of Basmathi Rice : Fig 9: Original image Fig 10: Rgb to grey
- 3. International Research Journal of Engineering and Technology (IRJET) e-ISSN: 2395-0056 Volume: 04 Issue: 08 | Aug -2017 www.irjet.net p-ISSN: 2395-0072 © 2017, IRJET | Impact Factor value: 5.181 | ISO 9001:2008 Certified Journal | Page 1085 Fig 11: Threshold image Fig 12: Counting the objects of original image Fig 13: counting the objects after detecting unwanted objects Analysis of Brown Rice : Fig 14: Original image Fig 15: Rgb to grey Fig 16: Threshold image Fig 17: Counting the objects of original image Fig 18: counting the objects after detecting unwanted objects The remaining pictures that I work on are: Fig 19: Organic Brown Rice Fig 20: Samba rice Table1: MSE & PSNR Values S.no Grain name Before Delineation Avg MSE Avg PSNR 1 Basmati 1.25 55.181 2 Sonamasoor 1.78 53.647 3 Brown rice 2.25 52.613 4 Organic brown rice 2.96 51.437 5 Samba rice 1.94 53.272 After delineation, comparing the pure image with the delineation image then the MSE is zero. Therefore the PSNR value becomes infinite. Hence, there is 100% accuracy while using this process. Analysis on Liquids: Initially, the liquid samples are taken in any container which is flat in structure for analysis. Now crop the picture for knowing the pixel values which are considered for finding whether the liquids are pure or impure. Later, the liquids which are taken was mixed andthen take the pictures of it and again check the pixel values there will be change in the values. By this, the liquids that are present in our daily life can be checked. Fig 21: Kerosene In Kerosene RGB values will be in between [0,193,253] to [2,195,255].
- 4. International Research Journal of Engineering and Technology (IRJET) e-ISSN: 2395-0056 Volume: 04 Issue: 08 | Aug -2017 www.irjet.net p-ISSN: 2395-0072 © 2017, IRJET | Impact Factor value: 5.181 | ISO 9001:2008 Certified Journal | Page 1086 Fig 22: Petrol In petrol RGB values will be in between [220,180,85] to [253,225,100]. If there is any mixture in it then the value of RGB changes in accordance with other liquid. For knowing whether the pixels are changing or not the kerosene is mixed with petrol with less quantity.Then,there was a change in the color of petrol that means it is getting impure. Take a picture and now observe it, there will be change in the pixel values as shown in fig 23. CONCLUSION: In this article, the image processing algorithm is graded to rice on the basis of length, width, area and also worked on color identification. From the results, it was concluded that some are better while comparing with other in quality that is based on area. However it is not essential to find the over lapping of grains.so, for further research the moisture in grains and to do for more food grains (or) species. In liquids generally the purity wasknownbyfinding the pixel values. Further the improvement on liquids are done for identifying the quality that was mixed in it. REFERENCE: [1] Grading of rice grains by image processing. Jagdeep singh aulakh , Dr. V.K. Banga Amritsar college of engineering & technology , Amritsar [2] Analysis of Rice Granules using Image Processing and Neural Network Pattern Recognition Tool by AbiramiS, Neelamegam P and Kala. H [3] Review Paper on Analysis and Grading of Food, Grains Using Image Processing and SVM Sunil S. Telang [4] Assessment of quality of rice grain using optical and image processingtechnique byEngr.zahida parveenand Dr. Muhammad anzar alam. Fig 23: impured liquid image