IRJET- Water Quality Analysis of Avaragere Lake- A Case Study
•
0 likes•40 views

https://irjet.net/archives/V5/i12/IRJET-V5I1299.pdf

Recommended
Recommended
More Related Content
What's hot
What's hot (20)
Similar to IRJET- Water Quality Analysis of Avaragere Lake- A Case Study
Similar to IRJET- Water Quality Analysis of Avaragere Lake- A Case Study (20)
More from IRJET Journal
More from IRJET Journal (20)
Recently uploaded
Recently uploaded (20)
IRJET- Water Quality Analysis of Avaragere Lake- A Case Study
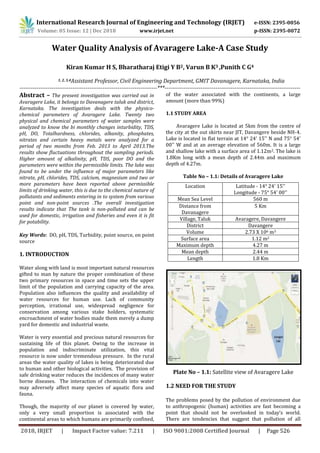
- 1. International Research Journal of Engineering and Technology (IRJET) e-ISSN: 2395-0056 Volume: 05 Issue: 12 | Dec 2018 www.irjet.net p-ISSN: 2395-0072 2018, IRJET | Impact Factor value: 7.211 | ISO 9001:2008 Certified Journal | Page 526 Water Quality Analysis of Avaragere Lake-A Case Study Kiran Kumar H S, Bharatharaj Etigi Y B2, Varun B K3 ,Punith C G4 1, 2, 3,4Assistant Professor, Civil Engineering Department, GMIT Davanagere, Karnataka, India -------------------------------------------------------------------------***------------------------------------------------------------------------ Abstract – The present investigation was carried out in Avaragere Lake, it belongs to Davanagere taluk and district, Karnataka. The investigation deals with the physico- chemical parameters of Avaragere Lake. Twenty two physical and chemical parameters of water samples were analyzed to know the bi monthly changes inturbidity, TDS, pH, DO, Totalhardness, chlorides, alkanity, phosphates, nitrates and certain heavy metals were analyzed for a period of two months from Feb. 2013 to April 2013.The results show fluctuations throughout the sampling periods. Higher amount of alkalinity, pH, TDS, poor DO and the parameters were within the permissible limits. The lake was found to be under the influence of major parameters like nitrate, pH, chlorides, TDS, calcium, magnesium and two or more parameters have been reported above permissible limits of drinking water, this is due to the chemical nature of pollutants and sediments entering in to system from various point and non-point sources .The overall investigation results indicate that The tank is non-polluted and can be used for domestic, irrigation and fisheries and even it is fit for potability. Key Words: DO, pH, TDS, Turbidity, point source, on point source 1. INTRODUCTION Water along with land is most important natural resources gifted to man by nature the proper combination of these two primary resources in space and time sets the upper limit of the population and carrying capacity of the area. Population also influences the quality and availability of water resources for human use. Lack of community perception, irrational use, widespread negligence for conservation among various stake holders, systematic encroachment of water bodies made them merely a dump yard for domestic and industrial waste. Water is very essential and precious natural resources for sustaining life of this planet. Owing to the increase in population and indiscriminate utilization, this vital resource is now under tremendous pressure. In the rural areas the water quality of lakes is being deteriorated due to human and other biological activities. The provision of safe drinking water reduces the incidences of many water borne diseases. The interaction of chemicals into water may adversely affect many species of aquatic flora and fauna. Though, the majority of our planet is covered by water, only a very small proportion is associated with the continental areas to which humans are primarily confined, of the water associated with the continents, a large amount (more than 99%) 1.1 STUDY AREA Avaragere Lake is located at 5km from the centre of the city at the out skirts near JIT, Davangere beside NH-4. Lake is located in flat terrain at 14° 24' 15'' N and 75° 54' 00'' W and at an average elevation of 560m. It is a large and shallow lake with a surface area of 1.12m2. The lake is 1.8Km long with a mean depth of 2.44m and maximum depth of 4.27m. Table No – 1.1: Details of Avaragere Lake Location Latitude - 14° 24' 15'' Longitude - 75° 54' 00'' Mean Sea Level 560 m Distance from Davanagere 5 Km Village, Taluk Avaragere, Davangere District Davangere Volume 2.73 X 10⁶ m3 Surface area 1.12 m2 Maximum depth 4.27 m Mean depth 2.44 m Length 1.8 Km Plate No – 1.1: Satellite view of Avaragere Lake 1.2 NEED FOR THE STUDY The problems posed by the pollution of environment due to anthropogenic (human) activities are fast becoming a point that should not be overlooked in today’s world. There are tendencies that suggest that pollution of all
- 2. International Research Journal of Engineering and Technology (IRJET) e-ISSN: 2395-0056 Volume: 05 Issue: 12 | Dec 2018 www.irjet.net p-ISSN: 2395-0072 2018, IRJET | Impact Factor value: 7.211 | ISO 9001:2008 Certified Journal | Page 527 forms (air, water, noise) is fast becoming a modern day evil that has come to live with us and producing in some dangerous effect on human health and well being. Lakes being major source of accessible freshwater require well planned, sustainable and scientific effort to prevent their degradation. It is an impervious to restore and conserve lakes and intends to explore the possibility to work in close partnership with the private sector in protection, conservation and sustainable management of lakes. 1.3 LAYERS OF LAKE The critical element for understanding lake health is phosphorus. It’s the link between what goes on in the watershed and what happens in the lake activities that cause erosion and sedimentation allow phosphorous from land to be transported to lake water. The three layers of lake depending on the lake depth are as follows:- 1. Epillimnion 2. Metalimnion 3. Hypolimnion 1. Epillimnion:- The warm upper waters are sunlit, wind mixed and oxygen rich. It is at 0-30 feet lake depth. 2. Metalimnion:- This Layer in the water column, also known as thermo cline, acts as a thermal barrier that prevents the interchange of nutrients between the warm appear waters and cold bottom waters. It is at 30-36 feet lake depth. 3.Hypolimnion:- In the cold water at the bottom of lakes, food for most creatures is in short supply, and reduces temperatures and light penetration prevents plants from growing in these layers exists below the 36 feet lake depth. 1.4 SOURCES OF POLLUTION IN LAKE Table No – 1.2: Point sources of pollution in lake Source Type of problem Power plants Combustion of fossil fuels emits nitrogen products into atmosphere, which are carried down by rainfall and other process, causing Eutrophication in lake body. Sewage treatment plant (STP) Treatment process releases acids of nitrogen and phosphorus in effluents, which drain in water bodies. Industrial plants Industrial process releases nitrogen and phosphorus products in efficient which drain in water bodies. Table No – 1.3: Non-point sources of pollution in lakes Source Type of problem Agriculture Forming practices, including use of fertilizers rich in nitrogen and phosphorus, deposit increased amount of these nutrients in soil run off from these farms cause Eutrophication in water bodies. Sewage Direct discharge of sewage from domestic sources, not connected to treatment plants, will eventually make its way into water bodies. 2. MATERIALS AND METHODOLOGY In this chapter the attempt has been made to take stock of water sample and the physico-chemical characterization of water and the experimental procedures for the water quality analysis. The study was carried out for the period of 2 months from March 2013 to April 2013 at Avaragere Lake. For the estimation of physico-chemical parameters, water samples were collected in monthly basis and at an interval of 15 days between 8.a.m to 10.a.m. The sampling stations uniformly covered the entire area of the lake (inlet-1, inlet-2, centre, outlet-1, outlet-2 and intermediate station).Sampling points were decided by keeping in mind that the considered sampling points must include shallow and deep regions of the water body, points of inflow, outflow of water in lake, human activities. The water samples were collected in polythene bottles, but for the estimation of dissolved oxygen (DO) the sample (300ml) fixed separately in BOD bottle at spot by using Winkler’s agents, and for other remaining experiments the water samples were immediately brought into laboratory for estimation of various physico-chemical parameters, like water temperature and pH were recorded at the time of sample collection by using thermometer and packet digital pH meter. While the other parameters such as DO, TDS, Hardness, EC, Alkalinity, Chlorides, Phosphates, Nitrites and various heavy metals were estimated in the laboratory by using Indian standard procedures (Titration method, Atomic Absorption Spectrophotometer (AAS) and Flame photometer).
- 3. International Research Journal of Engineering and Technology (IRJET) e-ISSN: 2395-0056 Volume: 05 Issue: 12 | Dec 2018 www.irjet.net p-ISSN: 2395-0072 2018, IRJET | Impact Factor value: 7.211 | ISO 9001:2008 Certified Journal | Page 528 Plate No – 2.1: Water sampling locations 3. RESULTS AND DISCUSSION The temperature of water was found to be in the range between 28°C to 32°C. The temperature of water is one important parameter which directly influences some chemical reaction in aquatic ecosystem. The significant correlation between ambient temperature and water temperature was studied by (Ganapathi 1943, 1962 and Verma 1967). pH of water is important for the biotic compound because most of plant and animal species can survive in a narrow range of pH slightly acidic to slightly alkaline condition. The high values pH during rainy season may be due to dilution of alkaline substances are dissolution of atmospheric carbon dioxide (Sheikh Nisar and Yeragi 2003). The DO and BOD in water is temperature dependent. As it is required to all the plants and animals for respiration, the high temperature and low DO during summer create favorable condition for the development of green algae (Prakash C 1982). Chlorides in urban areas are indicators of large amount of non-point source pollution by pesticides, grease, oil, metals and other toxic materials. Basically calcium, magnesium, barium etc., are responsible for the total hardness of water. The calcium is one of the alkaline earth metals, not known to produce any hazardous effect on human health. The magnesium has ten times the solubility of calcium and being bivalent, too produces hardness. The calcium and magnesium hardness are the two elements, which form the most abundant ions in fresh water, WHO (1984). The alkalinity may be due to high pH. The high pH may be due to the hydroxide, carbonates and bicarbonates .The greater alkalinity values may be due to the large scale use of its banks as open latrine and consequent washing of the excreta in and nearby water body (NarasimhaRao and Jaya raju 2001) 3.1. Following Bar-charts show the variation of various water quality parameters along with sampling stations and sampling time:- 6.75 7 7.25 7.5 7.75 8 8.25 8.5 8.75 9 9.25 pH Figure No - 3.1.1: Variation of pH along with sampling stations and sampling time pH 25-Feb 12-Mar 27-Mar 11-Apr 0.55 0.6 0.65 0.7 0.75 0.8 0.85 0.9 INLET-1 INLET-2 D.S CENTRE OUTLET-1OUTLET-2 E.C(m-Simen) Figure No - 3.1.2: Variation of E.C along with sampling stations and sampling time ELECTRICAL CONDUCTIVITY (E.C) 25-Feb 12-Mar 27-Mar 11-Apr 0 5 10 15 20 25 30 35 40 45 50 ACIDITY(mg/ltr) Figure No - 3.1.3: Variation of Acidity along with sampling stations and sampling time ACIDITY 25-Feb 12-Mar 27-Mar 11-Apr 100 150 200 250 300 350 400 450 500 ALKALINITY(mg/ltr) Figure No - 3.1.4: Variation of Alkalinity along with sampling stations and sampling time ALKALINITY 25-Feb 12-Mar 27-Mar 11-Apr
- 4. International Research Journal of Engineering and Technology (IRJET) e-ISSN: 2395-0056 Volume: 05 Issue: 12 | Dec 2018 www.irjet.net p-ISSN: 2395-0072 2018, IRJET | Impact Factor value: 7.211 | ISO 9001:2008 Certified Journal | Page 529 10 20 30 40 50 60 70 80 90 CHLORIDE(mg/ltr) Figure No - 3.1.5: Variation of Chloride along with sampling stations and sampling time CHLORIDE 25-Feb 12-Mar 27-Mar 11-Apr 10 15 20 25 30 35 40 45 50 INLET-1 INLET-2 D.S CENTRE OUTLET-1 OUTLET-2 CALCIUM(mg/ltr) Figure No - 3.1.6: Variation of Calcium along with sampling stations and sampling time CALCIUM 25-Feb 12-Mar 27-Mar 11-Apr 0 2 4 6 8 10 12 INLET-1 INLET-2 D.S CENTRE OUTLET-1 OUTLET-2 MAGNESIUM(mg/ltr) Figure No - 3.1.7: Variation of Magnesium along with sampling stations and sampling time MAGNESIUM 25-Feb 12-Mar 27-Mar 11-Apr 50 60 70 80 90 100 110 120 130 140 INLET-1 INLET-2 D.S CENTRE OUTLET-1OUTLET-2 TOTALHARDNESS(mg/ltr) Figure No - 3.1.8: Variation of Total Hardness along with sampling stations and sampling time TOTAL HARDNESS 25-Feb 12-Mar 27-Mar 11-Apr 0 0.5 1 1.5 2 2.5 3 3.5 4 4.5 5 5.5 6 DISSOLVEDOXYGEN(mg/ltr) Figure No - 3.1.9: Variation of Dissolved Oxygen along with sampling stations and sampling time DISSOLVED OXYGEN 25-Feb 12-Mar 27-Mar 11-Apr 0 0.5 1 1.5 2 2.5 3 3.5 4 4.5 INLET-1 INLET-2 D.S CENTRE OUTLET-1 OUTLET-2 IRON(mg/ltr) Figure No - 3.1.10: Variation of Iron along with sampling stations and sampling time IRON 25-Feb 12-Mar 27-Mar 11-Apr 0 0.5 1 1.5 2 2.5 3 3.5 4 4.5 5 INLET-1 INLET-2 D.S CENTRE OUTLET-1OUTLET-2 MANGANESE(mg/ltr) Figure No - 3.1.11: Variation of Manganese along with sampling stations and sampling time MANGANESE 25-Feb 12-Mar 27-Mar 11-Apr
- 5. International Research Journal of Engineering and Technology (IRJET) e-ISSN: 2395-0056 Volume: 05 Issue: 12 | Dec 2018 www.irjet.net p-ISSN: 2395-0072 2018, IRJET | Impact Factor value: 7.211 | ISO 9001:2008 Certified Journal | Page 530 Table No3.1: Maximum and Minimum values of different parameters Sl. No. Parameters Units Results of the samples Maximum Minimu m 1 pH - 9.15 7.00 2 ELECTRICAL CONDUCTIVITY mS 0.86 0.60 3 ACIDITY mg/l 48 10 4 ALKALINITY mg/l 498 110 5 CHLORIDE mg/l 82.97 10.99 6 CALCIUM mg/l 46.40 14.40 7 MAGNESIUM mg/l 5.56 0.96 8 TOTAL HARDNESS mg/l 136 52 9 DISSOLVED OXYGEN mg/l 5.61 0.49 10 IRON mg/l 4.33 0.10 11 COPPER mg/l 0.03 BDL 12 MANGANESE mg/l 4.58 0.20 13 ZINC mg/l 1.42 0.03 14 SODIUM mg/l 3.72 0.92 15 BI-CARBONATE mg/l 3.30 1.14 16 SODIUM ABSORPTION RATIO mg/l 3.31 1.22 * pH was found to be in the range of 7 to 9.15 which is slightly alkaline. * EC was found to be in the range of 0.6 to 0.86mS(milli- Simens) which might be due to the high suspended solids. * Acidity was found to be in the range of 10 to 48mg/ltr and alkalinity was found to in the range of 110 to 498mg/ltr which shows that water is slightly alkaline * Chloride was found to be in the range of 11 to 83mg/ltr which is well within limits of BIS standards. * Calcium was found to be in the range of 14.4 to 46.4mg/ltr which is well within limits of BIS standard. * Magnesium was found to be in the range of 0.96 to 5.56mg/ltr which is well within limits of BIS standards. * Total hardness was found to be in the range of 52 to 136mg/ltr which is well within limits of BIS standards. * DO was found to be in the range of 0.49 to 5.6mg/ltr which shows low DO concentration present in lake which indicates that organic pollutants are more. * Iron was found to be in the range of 0.1 to 4.33mg/ltr which is greater than BIS standards for drinking water quality which might be due to the surrounding geology of the lake area. * In addition to above parameter heavy metal analysis was also carried out. The heavy metals like copper, manganese, chromium, zinc, lead, cadmium, boron and sodium was analyzed. And the result of heavy metals analysis shows that all heavy metals are well within the limits of BIS standards. 0 0.5 1 1.5 2 2.5 3 3.5 4 INLET-1 INLET-2 D.S CENTRE OUTLET-1 OUTLET-2 SODIUM(mg/ltr) Figure No - 3.1.12: Variation of Sodium along with sampling stations and sampling time SODIUM 25-Feb 12-Mar 27-Mar 11-Apr 0 0.5 1 1.5 2 2.5 3 3.5 INLET-1 INLET-2 D.S CENTRE OUTLET-1 OUTLET-2 BI-CARBONATE(mg/ltr) Figure No - 3.1.13: Variation of Bi-Carbonate along with sampling stations and sampling time BI-CARBONATE 25-Feb 12-Mar 27-Mar 11-Apr 0 0.5 1 1.5 2 2.5 3 3.5 INLET-1 INLET-2 D.S CENTRE OUTLET-1 OUTLET-2 SAR(mg/ltr) Figure No - 3.1.14: Variation of SAR along with sampling stations and sampling time SODIUM ABSORPTION RATIO(SAR) 25-Feb 12-Mar 27-Mar 11-Apr
- 6. International Research Journal of Engineering and Technology (IRJET) e-ISSN: 2395-0056 Volume: 05 Issue: 12 | Dec 2018 www.irjet.net p-ISSN: 2395-0072 2018, IRJET | Impact Factor value: 7.211 | ISO 9001:2008 Certified Journal | Page 531 By studying all parameters it can be concluded that the lake water is deficit in DO for all the sampling stations and water is slightly alkaline which may be due to the discharge of water from the surrounding irrigational lands. Before using this lake water for domestic purpose it has to treated by suitable treatment method. 4. CONCLUSIONS 1. The initial condition of the lake was studied which shows that the water is turbid even in shallow depths due to the presence of excess of suspended, dissolved and colloidal solids present in the lake water. 2. The depth of the lake in past was more compared to present .As the depth of the lake is decreased the carrying capacity of the lake is reduced which is due to the entry of sediments entering the lake. 3. The physico chemical analysis of results revealed that the acidity and alkalinity of the lake is within permissible limits in comparison with the BIS Drinking water standards. 4. Hardness of the water is found to be within BIS standards. 5. Studies revealed that as of now the lake water is not used for potable use but the water can be effectively used for potable uses with the proper treatment methods which will treat the water to acceptable drinking water standards as the city is facing shortage of water. 6. It can be concluded finally that after the analysis of physico chemical attributes the water can be used for both drinking and Irrigation purposes but with adequate treatment to bring down the water quality to acceptable standards. From the above conclusions It can be suggested that the water quality of lake is getting detoriated. It is very much necessary to rejuvenate the lake and protect the lake from getting polluted due to the pollutants entering into Lake 4.1 SCOPE FOR FUTURE STUDY (1) Seasonal analysis of lake water can be done to know the seasonal variations of the water quality parameters. (2) Sediment analysis of the lake can be done to know the level and kind of pollutants entering the lake. (3) In the present study sampling on the water is carried out in topmost layers. REFERENCES (1) A.G. Deviprasad, Siddaraju Kothathi. “Application of CCME Water quality index to lake of mandya, Karnataka, India”., International Inter disciplinary research journal Jan-Feb-2012 (2) Aboud S Jumbe, N. Nandini, Sucharita Tandon, Sunita N. ”Bangalore Lakes Issues and perspectives onpollution, restoration and Management”., 1699-1706 (3) Basavaraja Simpi, S.M. Hiremath, K.N.S Murthy, K.N. Chandrashekarappa, Anil N Patel, E.T Puttiah. “Analysis of water quality using physico-chemical parameters Hosahalli Tank in Shimoga District, Karnataka, India”., Global Journals INC(USA) , 2001 (4) Bridgton. ”Lakes Environmental Association, Water Testing Report” (5)Egwuonwa C.C, Uzoije A.P, Okafor V.C, Ezeanya M.C and Nwachukwu M.U.”Evolution of the effects of industrial waste water discharge on surface water (A Case study of Niegeria Breweries P/C Enugu)., Greener Journal of Physical sciences (6) Farhana Ali and M. Musaddique. “Comparitive Analysis of Physico-chemical and Bacteriological properties of Eutrophic and fresh water bodies”., J.Aqua.Biol.Vol.24(1):57-60, 2009 (7) Infrastructure Development Corporation (Karnataka) Limited. “Development of Lake Conservation Project, Karnataka” (8)K. Khelchandra Singh, B. Manihar Sharma and K.H. Usha. “Echology of Kharungpat Lake, Thoubal, Manipur, India: Part-1 water quality status”., The Ecoscan 4(2 & 3):241-245, 2010. (9) K. Sahu, A. Mehta, Sangeeta Sing and Shruthi Shukla.“Physico-chemical and Bacterological Studies of Daphrin Hostipal Discharge at Sagar, Madhyapradesh”., Asian.J.Exp.Sci.Vol.No.2, 2007 (10) Masse and Miller Consulting Ltd. “Windermere Lake Water Quality Monitoring Program and Literature Review”., Nov-2005
- 7. International Research Journal of Engineering and Technology (IRJET) e-ISSN: 2395-0056 Volume: 05 Issue: 12 | Dec 2018 www.irjet.net p-ISSN: 2395-0072 2018, IRJET | Impact Factor value: 7.211 | ISO 9001:2008 Certified Journal | Page 532 BIOGRAPHIES Working as an assistant professor in the department of Civil Engineering ,GMIT, Davanagere, Research Scholar in VTU Belgaum and working in the area of water and waste water pollution prevention and treatment Engineering. Life member of Indian Society of Technical Education (ISTE). Working as an assistant professor in the department of Civil Engineering, GMIT, Davanagere from past 15 years of Teaching and Research Scholar in VTU Belgaum and working in the area of Eco-friendly concrete. Life member of Indian Society of Technical Education(ISTE). Working as an assistant professor in the department of Civil Engineering, GMIT, Davanagere, Research Scholar in VTU Belgaum and working in the area of Eco- friendly concrete. Life member of Indian Society of Technical Education(ISTE). Working as an assistant professor in the department of Civil Engineering,GMIT, Davanagere. Life member of Indian Society of Technical Education(ISTE). 3rd