IRJET- Evaluation of Ground Water Status using Arc GIS in Lathur Block, Kanchipuram District, Tamil Nadu, India
•
1 like•38 views

This document evaluates the groundwater status in Lathur Block, Kanchipuram District, Tamil Nadu, India using ArcGIS software. Key findings include: 1) Groundwater quality, water level, and rainfall patterns from 2008-2018 were analyzed and mapped using ArcGIS. Water quality parameters like pH, chloride, sodium, and hardness exceeded permissible limits in some areas, especially near the coast. 2) Rainfall patterns and water levels fluctuated over the study period. Reduced rainfall and increased pumping led to seawater intrusion in coastal areas. 3) Recommendations to address issues include rainwater harvesting, treating industrial wastewater, recharge pits/ponds,

Recommended
Recommended
More Related Content
What's hot
What's hot (12)
Similar to IRJET- Evaluation of Ground Water Status using Arc GIS in Lathur Block, Kanchipuram District, Tamil Nadu, India
Similar to IRJET- Evaluation of Ground Water Status using Arc GIS in Lathur Block, Kanchipuram District, Tamil Nadu, India (20)
More from IRJET Journal
More from IRJET Journal (20)
Recently uploaded
Recently uploaded (20)
IRJET- Evaluation of Ground Water Status using Arc GIS in Lathur Block, Kanchipuram District, Tamil Nadu, India
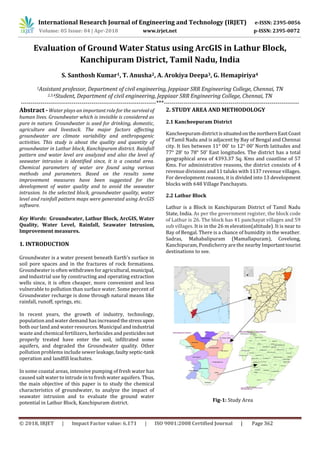
- 1. International Research Journal of Engineering and Technology (IRJET) e-ISSN: 2395-0056 Volume: 05 Issue: 04 | Apr-2018 www.irjet.net p-ISSN: 2395-0072 © 2018, IRJET | Impact Factor value: 6.171 | ISO 9001:2008 Certified Journal | Page 362 Evaluation of Ground Water Status using ArcGIS in Lathur Block, Kanchipuram District, Tamil Nadu, India S. Santhosh Kumar1, T. Anusha2, A. Arokiya Deepa3, G. Hemapiriya4 1Assistant professor, Department of civil engineering, Jeppiaar SRR Engineering College, Chennai, TN 2,3,4Student, Department of civil engineering, Jeppiaar SRR Engineering College, Chennai, TN ---------------------------------------------------------------------***--------------------------------------------------------------------- Abstract - Water plays an important role for the survival of human lives. Groundwater which is invisible is considered as pure in nature. Groundwater is used for drinking, domestic, agriculture and livestock. The major factors affecting groundwater are climate variability and anthropogenic activities. This study is about the quality and quantity of groundwater in Lathur block, Kanchipuram district. Rainfall pattern and water level are analyzed and also the level of seawater intrusion is identified since, it is a coastal area. Chemical parameters of water are found using various methods and parameters. Based on the results some improvement measures have been suggested for the development of water quality and to avoid the seawater intrusion. In the selected block, groundwater quality, water level and rainfall pattern maps were generated using ArcGIS software. Key Words: Groundwater, Lathur Block, ArcGIS, Water Quality, Water Level, Rainfall, Seawater Intrusion, Improvement measures. 1. INTRODUCTION Groundwater is a water present beneath Earth’s surface in soil pore spaces and in the fractures of rock formations. Groundwater is often withdrawn for agricultural,municipal, and industrial use by constructing and operating extraction wells since, it is often cheaper, more convenient and less vulnerable to pollution than surface water. Some percent of Groundwater recharge is done through natural means like rainfall, runoff, springs, etc. In recent years, the growth of industry, technology, population and water demand has increased thestressupon both our land and water resources. Municipal and industrial waste and chemical fertilizers, herbicides and pesticidesnot properly treated have enter the soil, infiltrated some aquifers, and degraded the Groundwater quality. Other pollution problems include sewer leakage,faultyseptic-tank operation and landfill leachates. In some coastal areas, intensive pumping of fresh water has caused salt water to intrude in to fresh water aquifers. Thus, the main objective of this paper is to study the chemical characteristics of groundwater, to analyze the impact of seawater intrusion and to evaluate the ground water potential in Lathur Block, Kanchipuram district. 2. STUDY AREA AND METHODOLOGY 2.1 Kancheepuram District Kancheepuram districtissituatedonthenorthernEastCoast of Tamil Nadu and is adjacent by Bay of Bengal and Chennai city. It lies between 11° 00' to 12° 00’ North latitudes and 77° 28' to 78° 50' East longitudes. The district has a total geographical area of 4393.37 Sq. Kms and coastline of 57 Kms. For administrative reasons, the district consists of 4 revenue divisions and 11 taluks with 1137 revenue villages. For development reasons, it is divided into 13 development blocks with 648 Village Panchayats. 2.2 Lathur Block Lathur is a Block in Kanchipuram District of Tamil Nadu State, India. As per the government register, the block code of Lathur is 26. The block has 41 panchayat villages and 59 sub villages. It is in the 26 m elevation(altitude). It is near to Bay of Bengal. There is a chance of humidity in the weather. Sadras, Mahabalipuram (Mamallapuram), Covelong, Kanchipuram, Pondicherry are the nearbyImportanttourist destinations to see. Fig-1: Study Area
- 2. International Research Journal of Engineering and Technology (IRJET) e-ISSN: 2395-0056 Volume: 05 Issue: 04 | Apr-2018 www.irjet.net p-ISSN: 2395-0072 © 2018, IRJET | Impact Factor value: 6.171 | ISO 9001:2008 Certified Journal | Page 363 2.3 Methodology Fig-2: Methodology 3. MATERIALS AND SOFTWARE USED 3.1 Materials In order to meet the objective of the project the following data have been used. Water quality data from Indian Water Studies, Tharamani for the year 2008 and 2013, Kancheepuram district. Water level data from Central Ground Water Board, Chennai for the period 2008, 2013, Kancheepuram district. Rainfall data from Indian Water Studies, Tharamani for the year 2008, 2013, 2017 Kancheepuram district. 3.2 SOFTWARE USED To manipulate the data to obtain required result the following software have been used in this project. For thematic map preparation software like ArcGIS are used since more accurate processing is achieved through this software. 4. PRIMARY AND SECONDARY DATA 4.1 Primary Data Primary data includes selection of study area and collection of samples. Lathur block consists of 41 panchayat villages with 59 sub villages and out of which samples have been collected from 22villages including coastal areas. 4.2 Secondary Data Secondary data includes water level data, water qualitydata and rainfall data collectedfromCentral Ground WaterBoard, Chennai. 4.2.1 Chemical Parameters The following chemical parameters are selected to determine spatial and temporal variations. For domestic purpose, if the values are high, it affects the human health and public utilities such as pipes, vessels, etc. pH Total Hardness Electrical Conductivity Total Alkalinity Chloride Sodium Potassium Dissolved Oxygen Sl. No Parameter Methods 1 pH pH meter 2 Electrical Conductivity Conductivity meter 3 Total Hardness EDTA titration 4 Chloride Silver nitrate titration 5 Sodium Flame photometer 6 Potassium Flame photometer 7 Total Alkalinity Phenolphthalein indicator 8 Dissolved Oxygen Using probe Table – 1: Testing Methods 5. RESULTS AND DISCUSSIONS 5.1 General Using the collected primary and secondary data, the variation of groundwater in the observation wells with respective rainfall over the decade was interpreted. Maps such as rainfall map, water level maps, groundwater quality maps were generated using ArcGIS. Various inferences and interpretation were made based on the maps.
- 3. International Research Journal of Engineering and Technology (IRJET) e-ISSN: 2395-0056 Volume: 05 Issue: 04 | Apr-2018 www.irjet.net p-ISSN: 2395-0072 © 2018, IRJET | Impact Factor value: 6.171 | ISO 9001:2008 Certified Journal | Page 364 As per BIS Sl. No Parameter Desirable Permissible 1 pH 6.5 – 8.5 No relaxation 2 Electrical Conductivity (TDS) 500mg/l 2000mgl 3 Total Hardness 300mg/l 600mg/l 4 Chloride 250mg/l 1000mg/l 5 Sodium 50mg/l 100mg/l 6 Potassium - - 7 Total Alkalinity 200mg/l 600mg/l 8 Dissolved Oxygen 5mg/l 18mg/l Table- 2: Desirable and Permissible Limits 5.2 Chemical Characteristics 2018 5.3 Rainfall Pattern and Water Level Above maps show the rainfall pattern and waterlevel forthe years 2008, 2013, 2017.We cansaythattheyears2008,2013 and 2017 has moderate rainfall and water levels have been increased and decreased accordingly. 5.4 Ph Range Variation
- 4. International Research Journal of Engineering and Technology (IRJET) e-ISSN: 2395-0056 Volume: 05 Issue: 04 | Apr-2018 www.irjet.net p-ISSN: 2395-0072 © 2018, IRJET | Impact Factor value: 6.171 | ISO 9001:2008 Certified Journal | Page 365 From the above maps, we conclude that, pH range for the year 2008 is within the permissible limit. pH range for the year 2013 is within the permissible limit for certain stations but for remaining stations pH is more basic. This is due to reasons like industrialization, urbanization andreductionin rainfall. The region of permissible pH for the year 2018 is more when compared to its previous year2013. Onstudying the rainfall data, it is clear that heavy rainfall in the year 2016 & 2017 in the study area has diluted the pH in the location. 5.5 Chloride Range Variation The chloride limit for the years 2008,2013,2018 are within the permissible range. However, the chloride contentforthe year 2018 is much higher in the coastal areas compared to previous years. This is due to effect of saltwaterintrusion on the coastal areas and also the non-point source pollution from the agricultural lands has increased the chloride content in the ground water. 5.6 Sodium Ion Concentration Variation The sodium limit for the years 2008,2013 are within the permissible limit. In inland areas,increaseinsodiumcontent is due to leaching process carried out in the agricultural fields. The sodium content for certain locations (Kadalur, Paramankeni) in the year 2018exceedsthepermissiblelimit due to the reduction in water level which resulted in sea water intrusion as most of these regions are near coastal areas. But, as we can see that sodium content in certain locations(inland) in the year 2018 is reduced as the water quality was replenished because of the heavy rain in 2017. 5.7 Potassium Ion Concentration Variation
- 5. International Research Journal of Engineering and Technology (IRJET) e-ISSN: 2395-0056 Volume: 05 Issue: 04 | Apr-2018 www.irjet.net p-ISSN: 2395-0072 © 2018, IRJET | Impact Factor value: 6.171 | ISO 9001:2008 Certified Journal | Page 366 Potassium (K) is an essential nutrientfor plantgrowthandis classified as a macronutrient due to large quantities of K being taken up by plants during their life cycle. Potassium content for the year 2018 is much higher compared to 2007,2013. This is due to the use of fertilizers for the crops which are rich in potassium and also due to sea water intrusion as we can see that those regions areneartocoastal areas. 5.8 Electrical Conductivity Ion Variation The permissible limit for total dissolved solids is within the permissible range in the years 2008, 2013, 2018. However, TDS range is more in 2018 compared to other years due to industrialization, urbanization and use of fertilizers. The range of TDS is 2100mg/l near Cheyyur region due to the discharge of industrial waste. 5.9 Total Hardness Range Variation Total Hardness is defined as the sum of calcium and magnesium hardness. From the maps, we can conclude that, Hardness of water is primarily affected by the soil type and the minerals present in it. The hardness variation for the years 2008, 2013 are within the permissible limit. Whereas, for the year 2018 stations like Sengathur, Thirupurakoil, Paramankeni the hardness range is more than the permissible limit which is due to industrialization, urbanization and may also due to sea water intrusion. 5.10 Total Alkalinity Variation
- 6. International Research Journal of Engineering and Technology (IRJET) e-ISSN: 2395-0056 Volume: 05 Issue: 04 | Apr-2018 www.irjet.net p-ISSN: 2395-0072 © 2018, IRJET | Impact Factor value: 6.171 | ISO 9001:2008 Certified Journal | Page 367 Total alkalinity is a total concentration of bases and Total dissolved solids (TDS) in water expressed as parts per million (ppm) or milligrams per litre (mg/L) of calcium carbonate CaCO3. These bases are usually bicarbonates (HCO3) and carbonate (CO3), and they act as buffer system that prevents drastic changes in pH. From the maps, we can conclude that, Alkalinity of natural water is determined by the soil and bedrock through which it passes. Alkalinity in environmental water is beneficial because it acts as a buffer and minimizes pH changes, reduces the toxicity of many metals by forming complexes with them, and provides nutrient carbon for aquatic plants. The alkalinity range for all the three years are within the permissible range. 5.11 Dissolved Oxygen Variation 2018 Decrease in DO is due to non-point sources like fertilizer runoff from farm fields and lawns. If the weather becomes cloudy for several days, respiring plants will use muchofthe DO while failing to photosynthesize. The DO level in theland area is approaching to the permissible limit which might be the cause of increased land surface temperature in the region. In common, salt water holds less oxygen than fresh water, so DO along the coastal areas tend to be lower than inland. 6. CONCLUSION AND RECOMMENDATION 6.1 Conclusion From the results obtained from questionnaire survey, various comparisons and experiments, major conclusions were made as follows, • Climate variability, agriculture, urbanization, industrialization are the major factors influencing the fluctuation of groundwater level andqualityinthestudy area. • Seawater intrusion is due to various anthropogenic activities, urbanization, climate change and groundwater level. • Physio-chemical parameters determines the quality of water. • It is concluded from the maps the rainfall pattern varies year by year. • The well level changes accordance with rainfall intensity. • There is seawater intrusion in the selected block.
- 7. International Research Journal of Engineering and Technology (IRJET) e-ISSN: 2395-0056 Volume: 05 Issue: 04 | Apr-2018 www.irjet.net p-ISSN: 2395-0072 © 2018, IRJET | Impact Factor value: 6.171 | ISO 9001:2008 Certified Journal | Page 368 On analyzing, the variation of all the chemical parameters and water level in the area, it is evident that the sea water is intruding in the coastal areasofLathurblock.Thearea under the permissible region has been reduced sufficiently. However, the area of intrusion in the location and the severity of the quality is still in the beginning stage. It is also evident if the anthropogenic activities are continued in the same way the severity of the intrusion will increase and reaches the vulnerable stage. 6.2 Recommendations Based on the above inferences and the maps generated the possible measures are given below, • Awareness should be created among peopletotakecare of environment and adapt to the changing climate • Various Rainwater harvesting structures can be constructed to improve the groundwaterlevel.Thus,the seawater intrusion can be avoided. • Industries and other point source runoff should be treated by economical method such as natural filtration before discharging it. • The annual average rainfall is changing, hence construction of farm ponds, percolationponds,recharge pits helps to store and recharge the groundwater level. • More of trees should be grown in the coastal regions in order to minimize the sea water intrusion. REFERENCES [1] Waikar M, Aditya P. Nilawar, (2014)’Identification of Groundwater Potential Zone using Remote Sensing and GIS Technique’, International Journal of innovative research in science, engineering and technology, ISSN:2319-8753, vol-3 [2] Ramu, Mahalingam B, Vinay M, (2014)’Identification of groundwater potential zones using Remote andSensing Techniques: A case study of Mysore taluk-Karnataka’, International Journal of Geomatics and Geosciences, ISSN:0976-4380, vol-5 [3] Ramamoorthy.P, Rammohan.V, (2015)’Assessment of Groundwater potential zone using remote sensing and GIS in Varahanadhi watershed, Tamilnadu, India. International Journal for Research in Applied Science & EngineeringTechnology(IJRASET),ISSN:23219653,vol- 3. [4] Nezar Hammouri, Ali EI-Naqa, Mohammed Barakat, (2012)’An Integrated Approach to Groundwater Exploration Using Remote Sensing and Geographic Information System, Journal of Water Resource and Protection. [5] M.Nagaraj, Sujit Singh, (2009)’Assessment of Groundwater Potential Zones using GIS Technique, Indian Soc.Remote Sens. [6] S. Majumdar, (2015)’Underground water Quantity and Quality Assessment in Next Decade in Bilaspur District, Chhattisgarh’, The International Journal of Engineering and Science (IJES), vol-4. [7] Sarala C, Ravi Babu P, (2012)’ Assessment of Groundwater Quality Parameters in and around Jawaharnagar, Hyderabad’, International Journal of Scientific and Research Publications, vol-2. [8] Dr. Swaminathan Rajan, (2012)’A Study of Drinking Water Quality of Aminjikarai, J. JNagar, Valluvarkottam and Vadapalani Area Chennai, Tamilnadu BIOGRAPHIES S. Santhosh Kumar M.E., Assistant Professor, Department of Civil Engineering, Jeppiaar SRR Engineering College. T. Anusha, Student, Civil Engineering, Jeppiaar SRR Engineering College. A. Arokiya Deepa, Student, Civil Engineering, Jeppiaar SRR Engineering College. thor Photo