Experimental Investigation of Pool Boiling Enhancement on Different Structured Surfaces
•
0 likes•44 views

https://irjet.net/archives/V4/i12/IRJET-V4I1287.pdf
![International Research Journal of Engineering and Technology (IRJET) e-ISSN: 2395-0056
Volume: 04 Issue: 12 | Dec-2017 www.irjet.net p-ISSN: 2395-0072
© 2017, IRJET | Impact Factor value: 6.171 | ISO 9001:2008 Certified Journal | Page 468
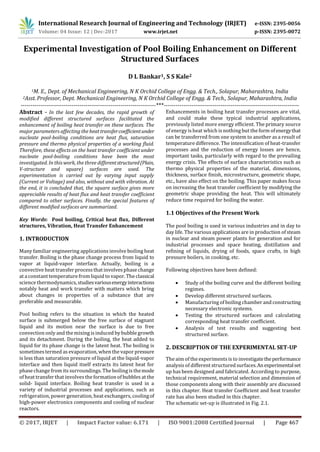
Figure 2.1: Schematic of Experimental set-up
The whole experiment can be subdivided into two major
parts, 1. Boiling chamber along with heater rod assembly 2.
Electrical setup along with control panel. The Heating rod
assembly consist of mainly 4 parts, a. Copper Rod b. Copper
Coupler c. Copper Surface (Structured Surfaces) d. Main
Heater. Copper rod is made hallow such that electric heater
can be inserted in it to supply heat. The way for the flow of
the heat will be towards surface which is screwed over the
copper rod. The coupler is welder over the copper rod. It is
provided with internal BSW threading. Surface is screwedto
this coupler. These surfaces are nothing but the structured
surface whose heat transfer coefficient has to be finding out.
Copper surface is screw on the top of the copper rod. These
surfaces can be replaced by one another. This heater is of
cylindrical type which gets inserted into the copper rod. For
ease in calculation it is necessary to assure one directional
heat flow. To avoid the heat flow in other direction we need
arrangement of insulation. It is possible because oftheuseof
Teflon insulation.
The bottom flange assembly mainly consists of 3 parts, a.
Bottom Flange, b. GlassCylinder, c. Top Flange. This flangeis
made up of MS. This bottom flange has provision for
insertion of auxiliary heater from bottom side. It provides
support to glass cylinder through suitable projections
provided. Proper sealing is done with silicon sealant. This
cylinder is made of borosilicate glass. This type of glass has
inert behavior and shows minimal thermal expansion with
high resistance to thermal shock. The pressure in tankhasto
be maintained constant. This can be achieved by supply of
cold water through condenser in the tank to reduce the
temperature and hence vapor pressure. The provision was
made on the top flange of the chamber for the insertion of
the condenser coil. Neither vapor nor water will be escaped
from the tank. Finally, the control panel consists of Electric
Heaters- Main heater, Auxiliary heater, Voltmeter,Ammeter,
Dimmer stat to change the heater inputs, Thermocouples- 3
No. of K type thermocouples with digital display, Water
pump and Switches- Main heater on-off switch, Auxiliary
heater on-off switch, Pump on-off switch.
3. EXPERIMENTAL INVESTIGATION
In this study, the performance of the system under the
conditions of varying electric supply (such asvaryingelectric
current or voltage) is analyzed using the measured data. The
experiments were conducted on the different structured
surfaces under steady state conditions in the heating mode.
Heat flux is function of heat transfer coefficient and
temperature difference. Hence for known quantities of heat
flux and temperature difference, heattransfer coefficientcan
be determined. In order to analyze the performance of the
system under varying conditions of electric supply and
temperature, average values of 15 measurements between
the Plain surface, V-structure surface and Square surface,
with an interval of 15 minutes are used in the calculations.
3.1 Mathematical Model
3.1.1 Calculation of the Slope
The heat is transfer to water from structured surface. Hence
thermocouple can’t be directly usedtomeasuringthesurface
temperature ( ), the slopes are introduced to find out
surface temperature for known value of temperature at
particular length of the rod.
The two thermocouplesare placed at the differenceinlength
of 10 mm in the copper rod. The slope of the curve is
obtained and curved is extended up to the length of 30 mm.
Hence the temperature of rod at length of 30mm (excluding
the threads) is predicted. This temperature is nothing but
the temperature of the structured copper surface, i.e.
and slope is calculated by formula-
Using same procedure surface temperature for eachreading
is found out. Further ΔT = ( – Twater) is calculated
required for further calculations.
3.1.2 Calculation of the Heat Flux and Heat Transfer
Coefficient:
a) Calculation of Heat Flux:
Heat transfer = Q = V×I
Where,
V = Voltage
I = Current
This heat transfer can be considered as theoretical heat
energy available at heating rod.
Now,
According to the Fourier’s law -
Heat transfer = Q = -K×A× (dt/dx)
q = -K× (dt/dx)
Where,
Q = Heat Transfer [W]](data:image/gif;base64,R0lGODlhAQABAIAAAAAAAP///yH5BAEAAAAALAAAAAABAAEAAAIBRAA7)
Recommended
Recommended
More Related Content
What's hot
What's hot (20)
Similar to Experimental Investigation of Pool Boiling Enhancement on Different Structured Surfaces
Similar to Experimental Investigation of Pool Boiling Enhancement on Different Structured Surfaces (20)
More from IRJET Journal
More from IRJET Journal (20)
Recently uploaded
Recently uploaded (20)
Experimental Investigation of Pool Boiling Enhancement on Different Structured Surfaces
- 1. International Research Journal of Engineering and Technology (IRJET) e-ISSN: 2395-0056 Volume: 04 Issue: 12 | Dec-2017 www.irjet.net p-ISSN: 2395-0072 © 2017, IRJET | Impact Factor value: 6.171 | ISO 9001:2008 Certified Journal | Page 467 Experimental Investigation of Pool Boiling Enhancement on Different Structured Surfaces D L Bankar1, S S Kale2 1M. E., Dept. of Mechanical Engineering, N K Orchid College of Engg. & Tech., Solapur, Maharashtra, India 2Asst.Professor, Dept. Mechanical Engineering, N K Orchid College of Engg. & Tech., Solapur, Maharashtra, India ---------------------------------------------------------------------***--------------------------------------------------------------------- Abstract - In the last few decades, the rapid growth of modified different structured surfaces facilitated the enhancement of boiling heat transfer on these surfaces. The major parameters affecting the heat transfercoefficientunder nucleate pool-boiling conditions are heat flux, saturation pressure and thermo physical properties of a working fluid. Therefore, these effects on the heat transfer coefficient under nucleate pool-boiling conditions have been the most investigated. In this work, the three differentstructured(Plain, V-structure and square) surfaces are used. The experimentation is carried out by varying input supply (Current or Voltage) and also, without and with vibration. At the end, it is concluded that, the square surface gives more appreciable results of heat flux and heat transfer coefficient compared to other surfaces. Finally, the special features of different modified surfaces are summarized. Key Words: Pool boiling, Critical heat flux, Different structures, Vibration, Heat Transfer Enhancement 1. INTRODUCTION Many familiar engineering applications involve boiling heat transfer. Boiling is the phase change process from liquid to vapor at liquid-vapor interface. Actually, boiling is a convective heat transfer processthat involvesphase change at a constant temperature from liquid to vapor. The classical science thermodynamics, studiesvariousenergyinteractions notably heat and work transfer with matters which bring about changes in properties of a substance that are preferable and measurable. Pool boiling refers to the situation in which the heated surface is submerged below the free surface of stagnant liquid and its motion near the surface is due to free convection only and the mixing is induced by bubble growth and its detachment. During the boiling, the heat added to liquid for its phase change is the latent heat. The boiling is sometimes termed as evaporation, when the vapor pressure is less than saturation pressure of liquid at the liquid-vapor interface and then liquid itself extracts its latent heat for phase change from its surroundings. The boilingis themode of heat transfer that involvesthe formation of bubbles at the solid- liquid interface. Boiling heat transfer is used in a variety of industrial processes and applications, such as refrigeration, power generation, heat exchangers, coolingof high-power electronics components and cooling of nuclear reactors. Enhancements in boiling heat transfer processes are vital, and could make these typical industrial applications, previously listed more energy efficient. The primary source of energy is heat which is nothing but the form ofenergythat can be transferred from one system to another as a result of temperature difference. The intensification of heat-transfer processes and the reduction of energy losses are hence, important tasks, particularly with regard to the prevailing energy crisis. The effects of surface characteristics such as thermo physical properties of the material, dimensions, thickness, surface finish, microstructure, geometric shape, etc., have also effect on the boiling. This paper makes focus on increasing the heat transfer coefficient by modifying the geometric shape providing the heat. This will ultimately reduce time required for boiling the water. 1.1 Objectives of the Present Work The pool boiling is used in various industries and in day to day life. The various applications are in production of steam in nuclear and steam power plants for generation and for industrial processes and space heating, distillation and refining of liquids, drying of foods, space crafts, in high pressure boilers, in cooking, etc. Following objectives have been defined: Study of the boiling curve and the different boiling regimes. Develop different structured surfaces. Manufacturing of boiling chamber and constructing necessary electronic systems. Testing the structured surfaces and calculating corresponding heat transfer coefficient. Analysis of test results and suggesting best structured surface. 2. DESCRIPTION OF THE EXPERIMENTAL SET-UP The aim of the experimentsis to investigatetheperformance analysis of different structured surfaces.Anexperimentalset up has been designed and fabricated. According to purpose, technical requirement, material selection and dimension of those components along with their assembly are discussed in this chapter. Heat transfer Coefficient and heat transfer rate has also been studied in this chapter. The schematic set-up is illustrated in Fig. 2.1.
- 2. International Research Journal of Engineering and Technology (IRJET) e-ISSN: 2395-0056 Volume: 04 Issue: 12 | Dec-2017 www.irjet.net p-ISSN: 2395-0072 © 2017, IRJET | Impact Factor value: 6.171 | ISO 9001:2008 Certified Journal | Page 468 Figure 2.1: Schematic of Experimental set-up The whole experiment can be subdivided into two major parts, 1. Boiling chamber along with heater rod assembly 2. Electrical setup along with control panel. The Heating rod assembly consist of mainly 4 parts, a. Copper Rod b. Copper Coupler c. Copper Surface (Structured Surfaces) d. Main Heater. Copper rod is made hallow such that electric heater can be inserted in it to supply heat. The way for the flow of the heat will be towards surface which is screwed over the copper rod. The coupler is welder over the copper rod. It is provided with internal BSW threading. Surface is screwedto this coupler. These surfaces are nothing but the structured surface whose heat transfer coefficient has to be finding out. Copper surface is screw on the top of the copper rod. These surfaces can be replaced by one another. This heater is of cylindrical type which gets inserted into the copper rod. For ease in calculation it is necessary to assure one directional heat flow. To avoid the heat flow in other direction we need arrangement of insulation. It is possible because oftheuseof Teflon insulation. The bottom flange assembly mainly consists of 3 parts, a. Bottom Flange, b. GlassCylinder, c. Top Flange. This flangeis made up of MS. This bottom flange has provision for insertion of auxiliary heater from bottom side. It provides support to glass cylinder through suitable projections provided. Proper sealing is done with silicon sealant. This cylinder is made of borosilicate glass. This type of glass has inert behavior and shows minimal thermal expansion with high resistance to thermal shock. The pressure in tankhasto be maintained constant. This can be achieved by supply of cold water through condenser in the tank to reduce the temperature and hence vapor pressure. The provision was made on the top flange of the chamber for the insertion of the condenser coil. Neither vapor nor water will be escaped from the tank. Finally, the control panel consists of Electric Heaters- Main heater, Auxiliary heater, Voltmeter,Ammeter, Dimmer stat to change the heater inputs, Thermocouples- 3 No. of K type thermocouples with digital display, Water pump and Switches- Main heater on-off switch, Auxiliary heater on-off switch, Pump on-off switch. 3. EXPERIMENTAL INVESTIGATION In this study, the performance of the system under the conditions of varying electric supply (such asvaryingelectric current or voltage) is analyzed using the measured data. The experiments were conducted on the different structured surfaces under steady state conditions in the heating mode. Heat flux is function of heat transfer coefficient and temperature difference. Hence for known quantities of heat flux and temperature difference, heattransfer coefficientcan be determined. In order to analyze the performance of the system under varying conditions of electric supply and temperature, average values of 15 measurements between the Plain surface, V-structure surface and Square surface, with an interval of 15 minutes are used in the calculations. 3.1 Mathematical Model 3.1.1 Calculation of the Slope The heat is transfer to water from structured surface. Hence thermocouple can’t be directly usedtomeasuringthesurface temperature ( ), the slopes are introduced to find out surface temperature for known value of temperature at particular length of the rod. The two thermocouplesare placed at the differenceinlength of 10 mm in the copper rod. The slope of the curve is obtained and curved is extended up to the length of 30 mm. Hence the temperature of rod at length of 30mm (excluding the threads) is predicted. This temperature is nothing but the temperature of the structured copper surface, i.e. and slope is calculated by formula- Using same procedure surface temperature for eachreading is found out. Further ΔT = ( – Twater) is calculated required for further calculations. 3.1.2 Calculation of the Heat Flux and Heat Transfer Coefficient: a) Calculation of Heat Flux: Heat transfer = Q = V×I Where, V = Voltage I = Current This heat transfer can be considered as theoretical heat energy available at heating rod. Now, According to the Fourier’s law - Heat transfer = Q = -K×A× (dt/dx) q = -K× (dt/dx) Where, Q = Heat Transfer [W]
- 3. International Research Journal of Engineering and Technology (IRJET) e-ISSN: 2395-0056 Volume: 04 Issue: 12 | Dec-2017 www.irjet.net p-ISSN: 2395-0072 © 2017, IRJET | Impact Factor value: 6.171 | ISO 9001:2008 Certified Journal | Page 469 q = Heat Flux [W/m2] K = Thermal Conductivity [W/m0C] dt/dx = Temperature Gradient [0C/m] b) Calculation for Heat Transfer Coefficient: According to Newton’s law of cooling q = h× ( – T3) Where, q = Heat flux [W/m2] = Surface temperature of the surface obtained by graph [0C] T3 = Saturation temperature of water [0C] h = heat transfer coefficient [W/ C] Here all values except h are known. Hence, h can be calculated now. c) Sample Calculation For Heat Flux: The Thermocouples are placed at difference in distance of 0.01m. The temperatures at this distance are measured and result is displayed digitally. Temperature at surface of surface is calculated by extrapolation. 3.2 Observations for Various Surfaces In this section, calculations for different surfaces are calculated. Surface temperature of different specimens is calculated along with actual heat transfer. Finally based on the temperature difference obtained, heat transfer coefficient is calculated and compared with other. 3.2.1 Observations for Plain Surface Table -3.1: Observations for Plain Surface (Without Vibration) Table -3.2: Observations for Plain Surface (With Vibration) 3.1.2 Observations for V-structured Surface Table -3.3: Observations for V Surface (Without Vibration) Heat Inputs (W) Average Heat Flux ( ) [kW/ Avg. ΔT Average Heat Transfer Coefficient ( ) [kW/m2 0C] 42 24.86 1.92 13.03 56 33.68 2.32 14.43 72 50.53 2.60 19.43 3.1.3 Observations for Square Surface Table -3.5: ReadingsforSquare Surface (Without Vibration) Heat Inputs [W] Average Heat Flux ( [W/m2] Avg. ΔT [ 0C] Average Heat Transfer Coefficient ( ) [kW/m2 0C] 42 17.64 1.5 11.78 56 20.85 1.74 12.11 72 28.87 1.96 14.55 Heat Inputs [W] Average Heat Flux ( ) [W/m2] Avg. ΔT [ 0C] Average Heat Transfer Coefficient ( ) [kW/m2 0C] 42 21.65 1.74 12.50 56 29.67 2.10 14.03 72 40.10 2.32 17.30 Heat Inputs (W) Average Heat Flux ( ) [kW/ Avg. ΔT Average Heat Transfer Coefficient ( ) [kW/m2 0C] 42 22.46 1.82 12.29 56 30.48 2.20 13.79 72 45.71 2.50 18.26 Heat Inputs (W) Average Heat Flux ( ) [kW/ Avg. ΔT Average Heat Transfer Coefficient ( ) [kW/m2 OC] 42 22.46 1.94 11.45 56 37.69 2.36 15.89 72 52.93 2.66 19.00 Heat Inputs (W) Average Heat Flux ( ) [kW/ Avg. ΔT Average Heat Transfer Coefficient ( ) [kW/m2 0C] 42 28.07 2.04 13.71 56 44.11 2.40 18.33 72 60.95 2.88 21.10 Table -3.6: Observations for SquareSurface(WithVibration) 4. RESULT AND DISCUSSION It is well known that the bubble behavior including nucleation growth and departure on the heater surface influences the boiling heat transfer performance in the nucleate boiling regime. Briefly, boiling heat transfer can be Table -3.4: Observations for V Surface (With Vibration)
- 4. International Research Journal of Engineering and Technology (IRJET) e-ISSN: 2395-0056 Volume: 04 Issue: 12 | Dec-2017 www.irjet.net p-ISSN: 2395-0072 © 2017, IRJET | Impact Factor value: 6.171 | ISO 9001:2008 Certified Journal | Page 470 enhanced when the nucleated bubbles are more and bubble frequency is higher. Thus, the most engineered surface was designed for increasing the active nucleation sites as well as possibility of vapor/gas entrapment, by changing the cavity shape and surface wettability. 4.1 Heat flux for all surfaces In this section, the observations for different surfaces are carried out. Surface temperature of different specimens is observed along with actual heat transfer. Finally based on the temperature difference obtained, heat flux is calculated and compared with other using graphs. The following graphs will show the variation of heat flux for three different surfaces under the conditions of vibration and without vibration. The following graph- q vs. ΔT shows that, the comparison between readings for plain surface with vibration and without vibration. Figure 4.1: Heat flux (q) vs. ΔT for Plain Surface It shows that, the curve obtained with vibration has greater value of heat flux than the curve obtained without vibration and also, it has maximum temperature difference. Figure 4.2: Heat flux (q) vs. ΔT for V-structured Surface Above graph- q vs. ΔT shows that, the comparison between readings for V-structured surface withvibrationandwithout vibration. It shows that, the curve obtained with vibration has greater value of heat flux than the other with maximum temperature difference. Finally, the observations for square surface are carried out using the graph. Figure 4.3: Heat flux (q) vs. ΔT for Square Surface The above graph- q vs. ΔT shows that, the comparison between readings of heat flux for square surface without vibration and with vibration. The curve obtained with vibration has greater value of heat flux than the curve obtained without vibration. Also, it is having greatervalueof temperature difference at that heat flux. So, it is clear that the vibration increases the heat transfer with increase in temperature. From above three graphs, it is proved that the heat flux is increases with increase in temperature difference. And the square surfaces have maximum heat flux with maximum value of temperature difference. 4.2 Comparison of all structured surfaces The three different structured surfaces (Plain, V- Structure, and Square) are compared with each other on the basis of variation in heat flux with the variation in temperature difference. Also, the graphs are drawn by operating two conditions, without and with vibration given to the specimen. In this section, all the structured surfacesare comparedwith each other on the basis of variation in heat flux and temperature variations. From these graphs, the best surface is to be suggested. 4.2.1 Observations without Vibration The following graph is drawn under the varying conditions of electric supply, temperature and heat flux without taking consideration of vibration. The graph shows that, how the variation in heat fluxes of various structures is takes place with respect to variation in
- 5. International Research Journal of Engineering and Technology (IRJET) e-ISSN: 2395-0056 Volume: 04 Issue: 12 | Dec-2017 www.irjet.net p-ISSN: 2395-0072 © 2017, IRJET | Impact Factor value: 6.171 | ISO 9001:2008 Certified Journal | Page 471 temperature. The variation in heat fluxes of different structures is observed by giving different color codes to them. Figure 4.4: Heat flux (q) vs. ΔT for all Surfaces Above graph- ( ) vs. ΔT shows that, with increase in temperature difference, the heat flux also increasing. The plain surface has minimum heat flux and the square surface has maximum heat flux. Also, the temperature difference is also high for square surface compared to other surfaces. 4.2.2 Observations with vibration The following graph is drawn under consideration of vibration. Figure 4.5: Heat flux (q) vs. ΔT for all Surfaces Above graph- ( ) vs. ΔT shows that, with increase in temperature difference, the heat flux also increasing. The v- surface has moderate value of heat transfer coefficient. The square surface has maximum heat flux value at maximum temperature difference compared to other surfaces. 5. CONCLUSION AND FUTURE SCOPE 5.1 Conclusion In this chapter the results for individualsurfaceisconcluded. On the basis of results obtained and graphs plotted best suitable surface is recommended. Some methods for improvement of the heat transfer are also discussed. Following are the conclusions: For Plain Surface: The rate of bubble generation is least. From the q vs. ΔT graph, it can be concludedthat q and ΔT have nearly linear relationship.PlainSurface shows least heat transfer coefficient for each heat input from h vs. ΔT graph. At 72 W heat input, we have got heat transfer coefficient of 14.55 without vibration and 17.30 with vibration. For V Surface: The rate of bubble generation is moderate. From the q vs. ΔT graph, it can be concluded that q and ΔT have non-linear relationship. It is observed that for higher temperature difference the rate of detachment of bubbles form surface gets increased. V surfaces are more suitable than plain for higher temperature difference. Effect of surface isnot so dominating at relatively lower temperature. At 72 W heat input, we have got heat transfer coefficient of 18.26 without vibration and 19.43 with vibration. For Square Surface: The rate of bubble generation is highest. From the q vs. ΔT graph, it can be concluded that q and ΔT have non-linear relationship. Little change in temperature showed drastic change in heat transfer coefficient. Square surface has highest heat transfer coefficient for all heat inputs. For lower as well as for higher temperature difference, heat transfer coefficient is always highest. At 72 W heat input, we have got heat transfer coefficient of 19.00 without vibration and 21.10 with vibration. The selection of best suitable surface is based on higher heat transfer coefficient for relatively low temperature difference. The increased heat transfer rate is going to reduce time required forheating.At72 W heat input, square surface has maximum heat transfer coefficient of 21.10 as compared to other surfaces. With higher rate of bubble generation square surface showshighestheattransfer coefficient. Hence, square surface is recommended as best suitable surface.
- 6. International Research Journal of Engineering and Technology (IRJET) e-ISSN: 2395-0056 Volume: 04 Issue: 12 | Dec-2017 www.irjet.net p-ISSN: 2395-0072 © 2017, IRJET | Impact Factor value: 6.171 | ISO 9001:2008 Certified Journal | Page 472 5.2 Future Scope The present work experimentally investigated the performance of the different structured surfaces. Recommended future studies are as follows: Enhancement by using modified different structures with different geometries can be employed for improved heat transfer rate within shorter intervalof time. Enhancement by bubble dynamics Enhancement by utilizing nano particles. Adaptation of such new technique and selection of best suitable method can be done for efficient energy utilization with economic considerations. ACKNOWLEDGEMENT We thank N. K. Orchid College of Engineering and Technology, Solapur, for providing facilities- Workshop, Library, internet facility, Computer Lab, etc. REFERENCES [1] K. K. Nangia, W. Y. Chon “ Some Observations on the effect of Interfacial Vibration on Saturated Boiling Heat Transfer” AIChE Journal Vol. 13 No. 5 (1967), pp. 872-876. [2] Carlo Bartoli, Federica Baffigi “Effects of ultrasonic waves on the heat transfer enhancement in subcooled boiling” Experimental ThermalandFluid Science (2011), pp. 423-432. [3] Dawen Zhong, Ji’an Meng, Zhixin Li, Zengyuan Guo “Critical heat flux for downward-facing saturated pool boiling on pin fin Surfaces” International Journal of Heat and Mass Transfer (2015), pp. 201- 211. [4] V. V. Chekanov, L.M. Kul’gina “Effect of heater vibration on the boiling process” Inzhenerno- Fizicheskii Journal Vol. 30 No. 1 (1976), pp. 31-34. [5] Seol Ha Kim, Gi Cheol Lee, Jun YoungKang,Kiyofumi Moriyama, Moo Hwan Kim, Hyun Sun Park “Boiling heat transfer and critical heat flux evaluation of the pool boiling on micro structured surface” International Journal of Heat and Mass Transfer (2015), pp. 1140–1147. [6] Dwight Cooke, Satish G. Kandilkar “Effect of open microchannel geometry on pool boiling enhancement” International Journal of Heat and Mass Transfer (2012), pp. 1004-1013. [7] Shoji Mori, Kunito Okuyama “Enhancement of the critical heat flux in saturated pool boiling using honeycomb porous media” International Journal of Multiphase Flow (2009), pp. 946–951. [8] A.K. Das, P.K. Das, P. Saha “Nucleate boiling of water from plain and structured surfaces” Experimental Thermal and Fluid Science (2007), pp. 967–977. [9] Yoon-Ho Kim, Kyu-Jung Lee, DonghyouckHan“Pool boiling enhancement with surface treatments”Heat Mass Transfer (2008), pp. 55–60. [10] A.K. Das, P.K. Das, P. Saha “Performance of different structured surfaces in nucleate pool boiling” Applied Thermal Engineering (2009), pp. 3643– 3653.