Downloaded 314 times
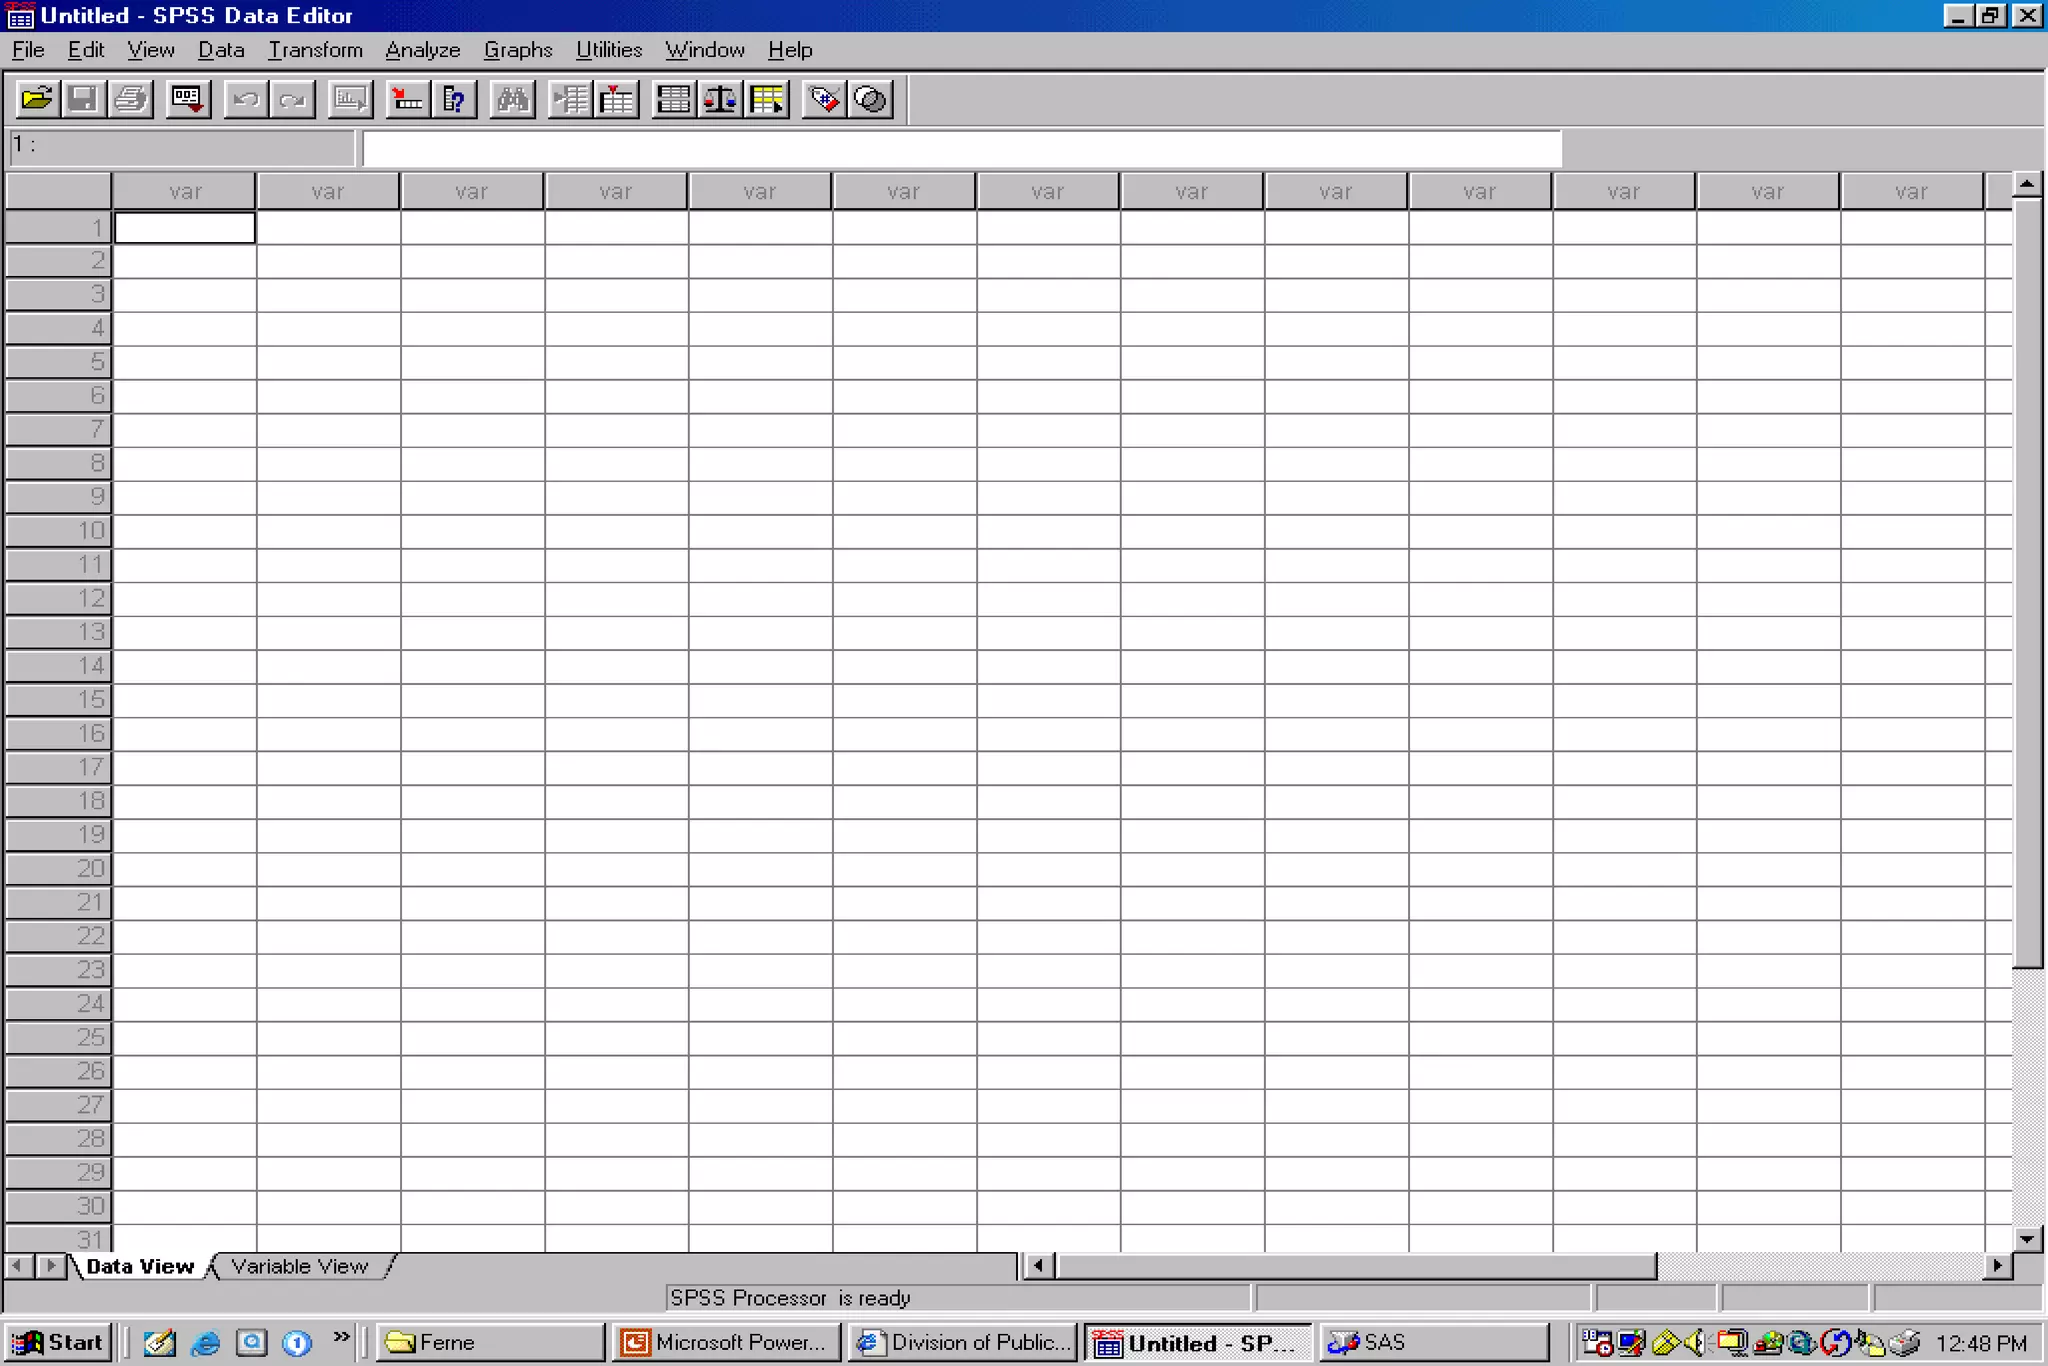
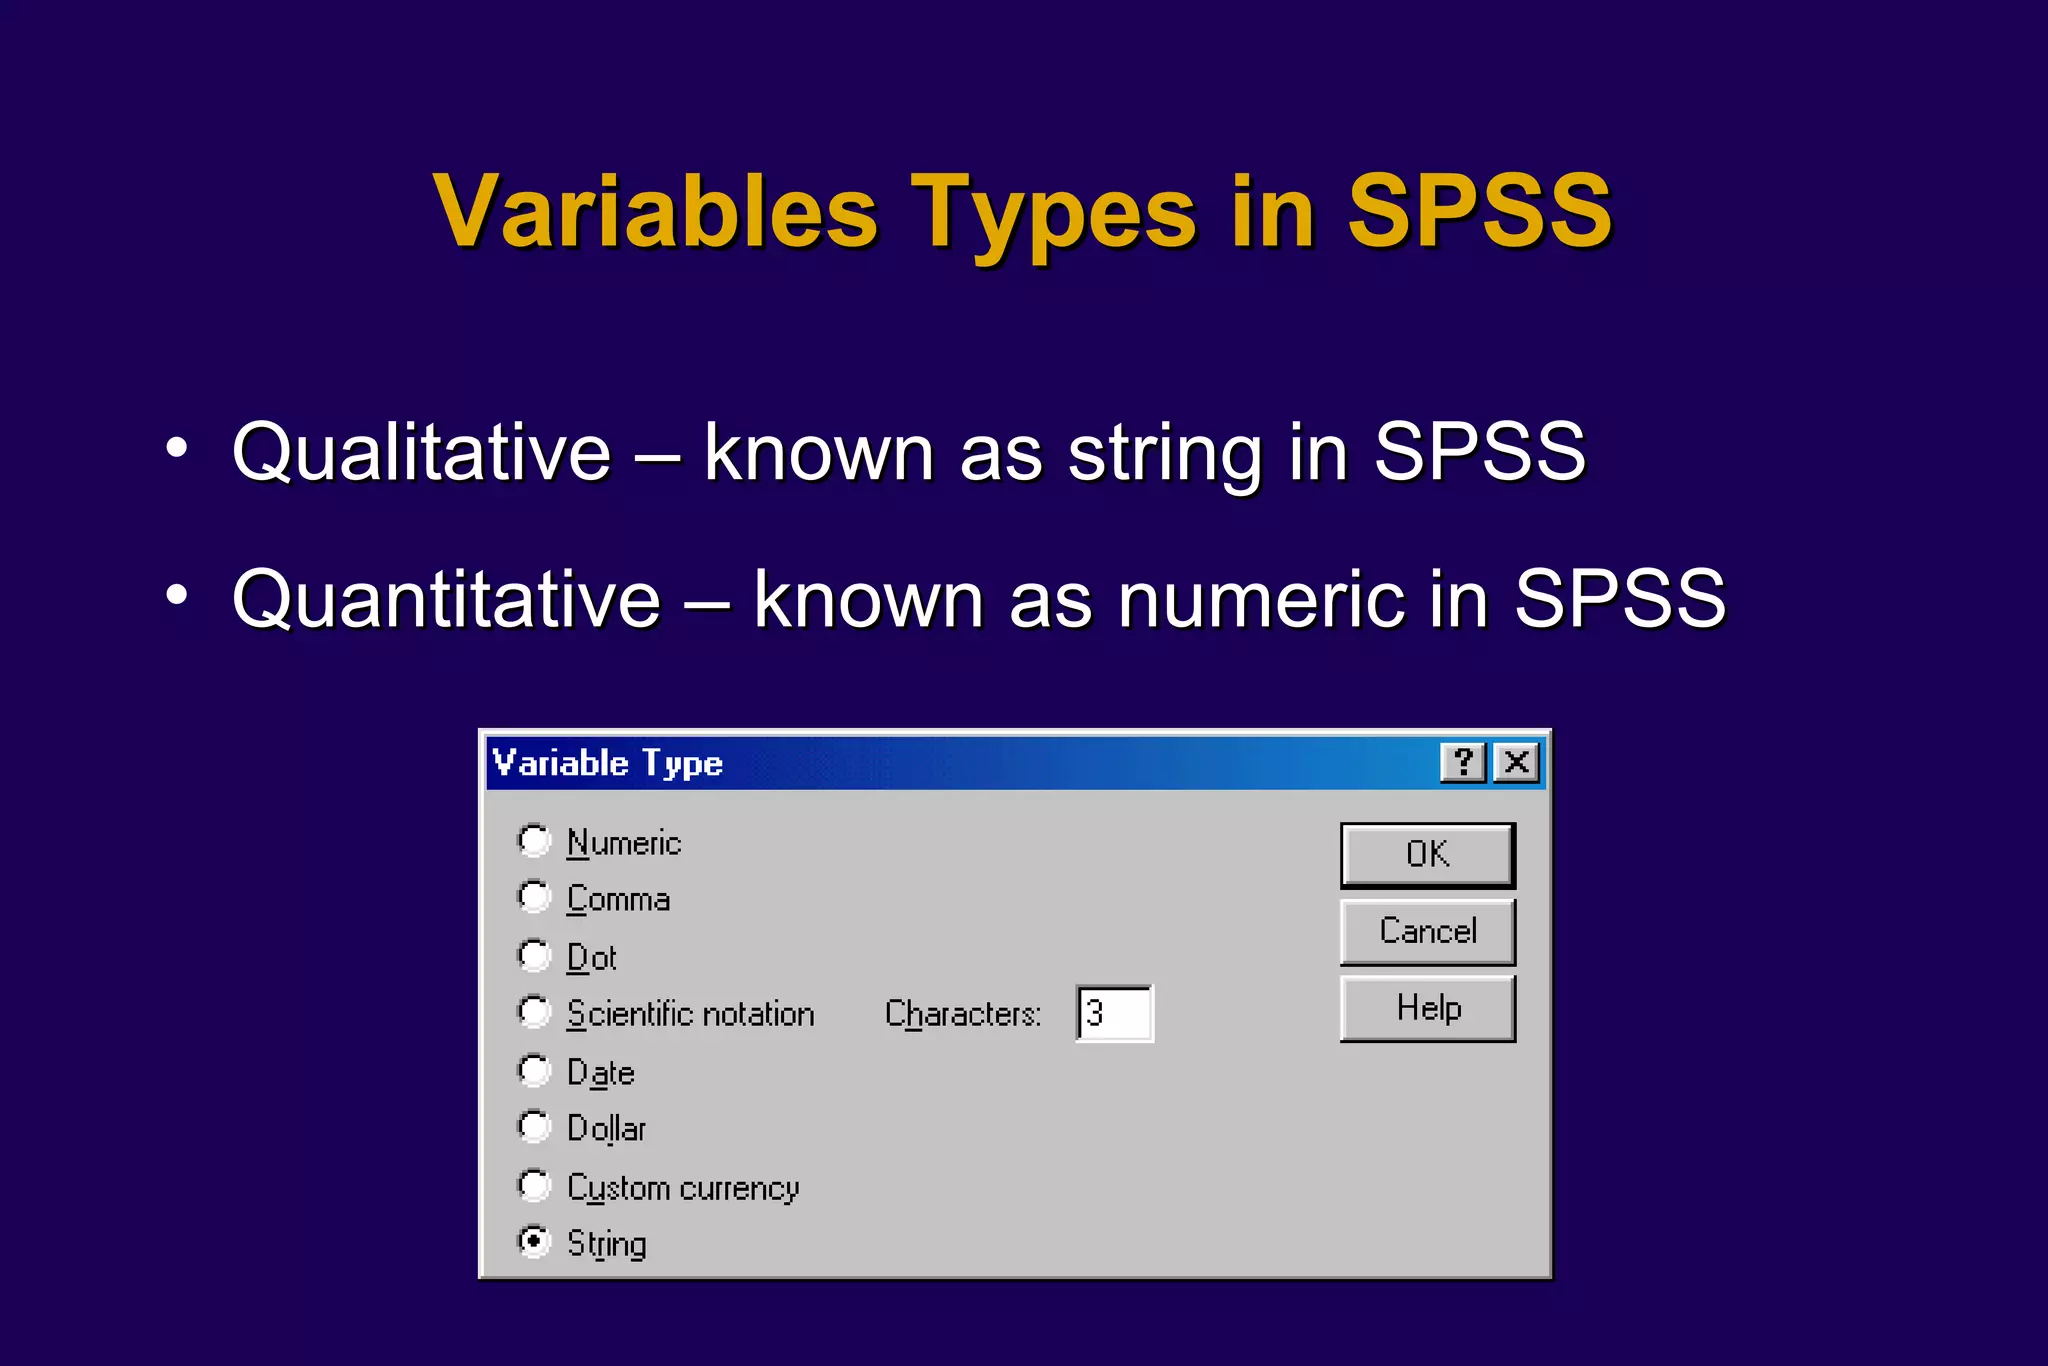
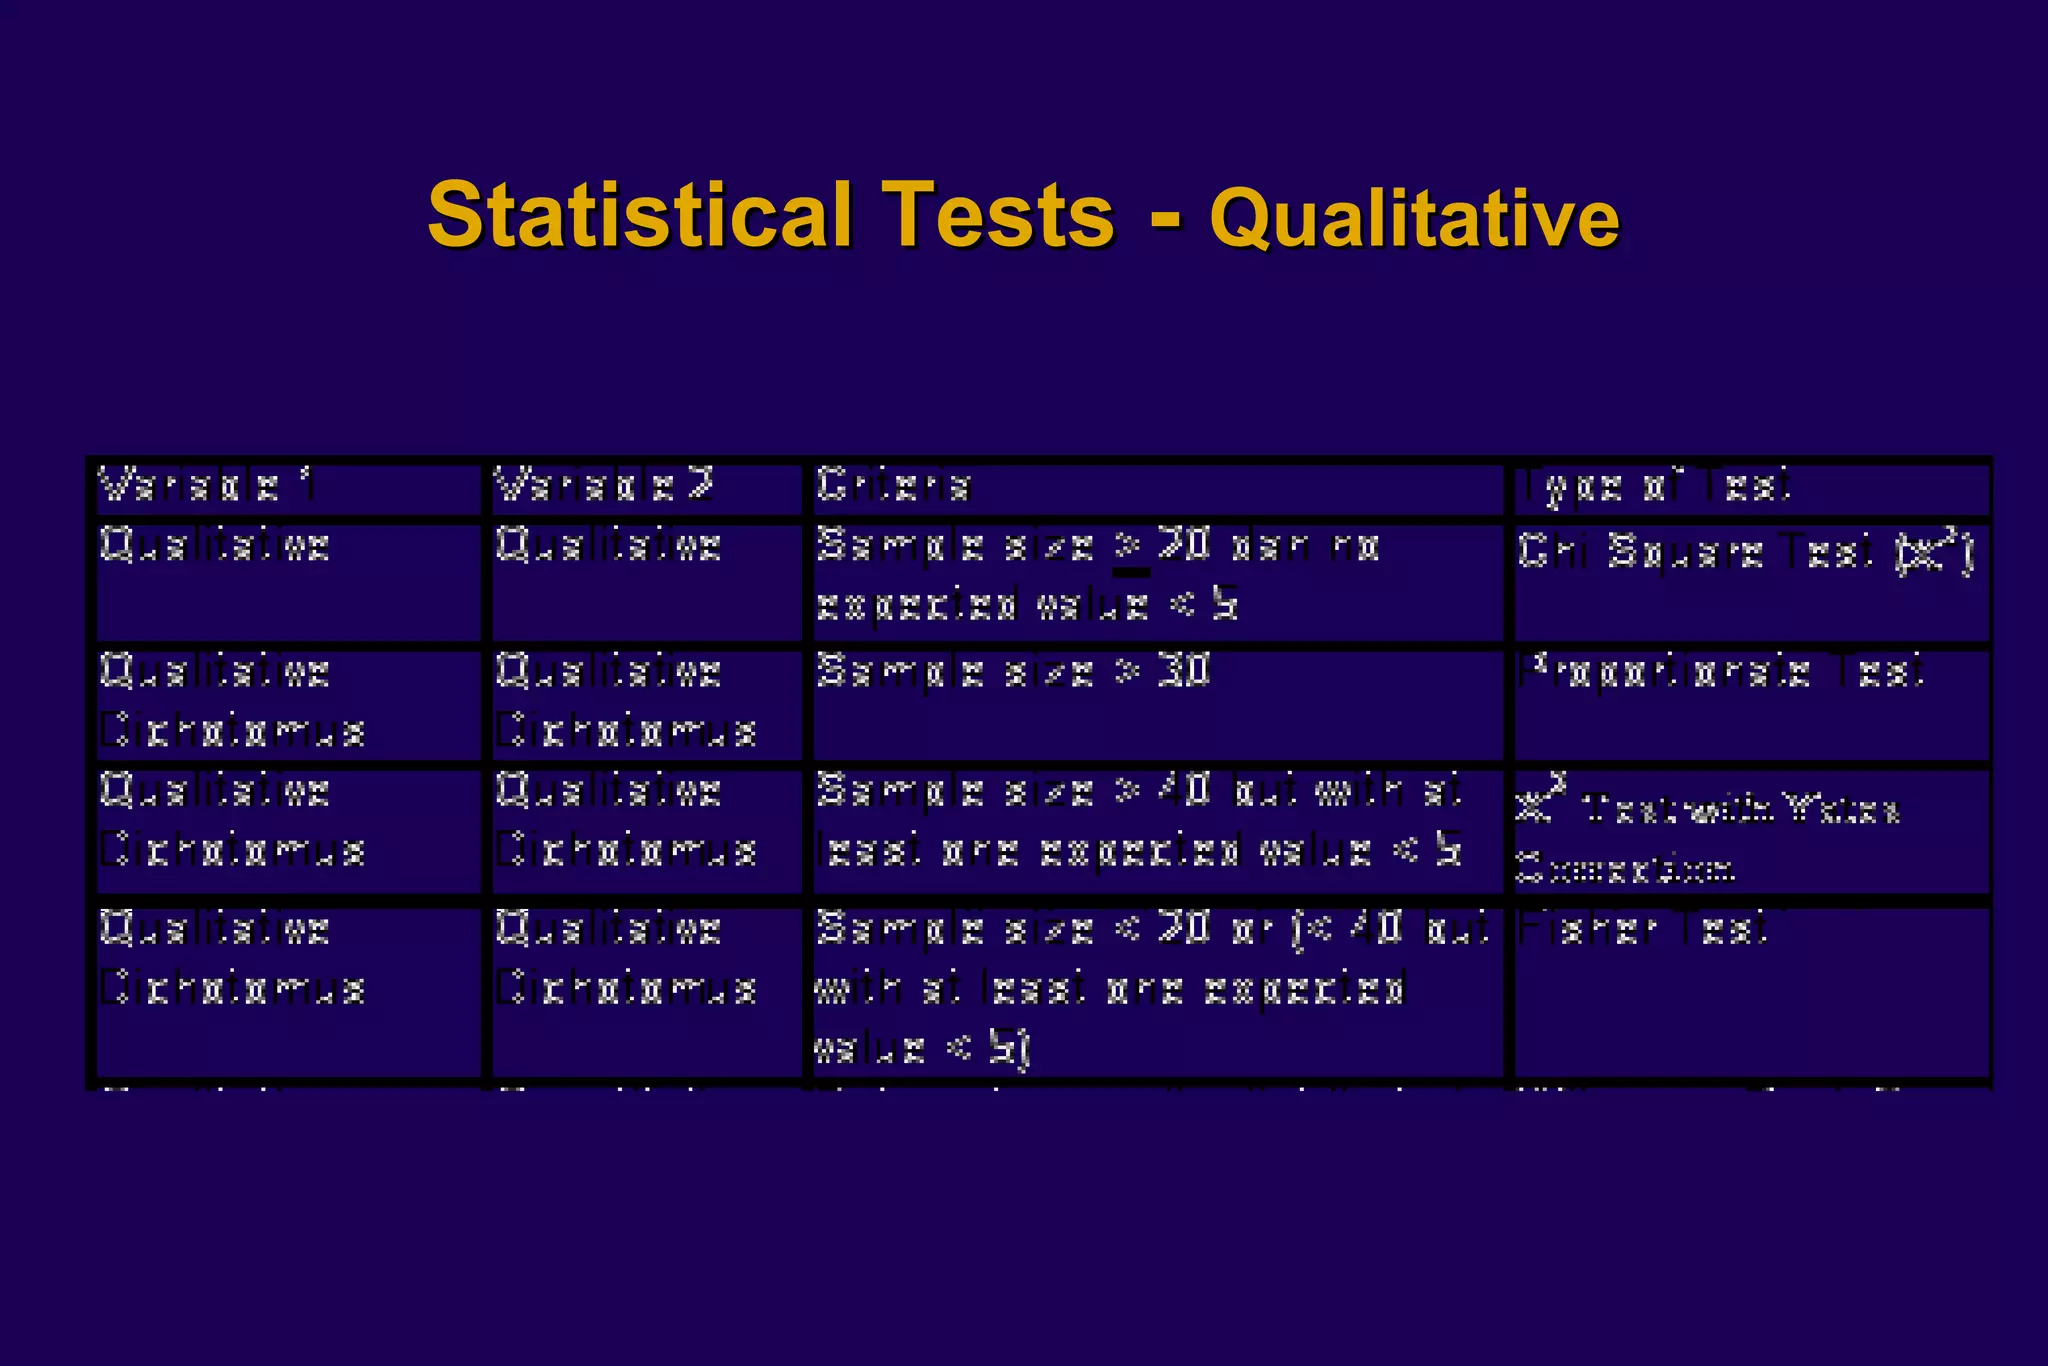
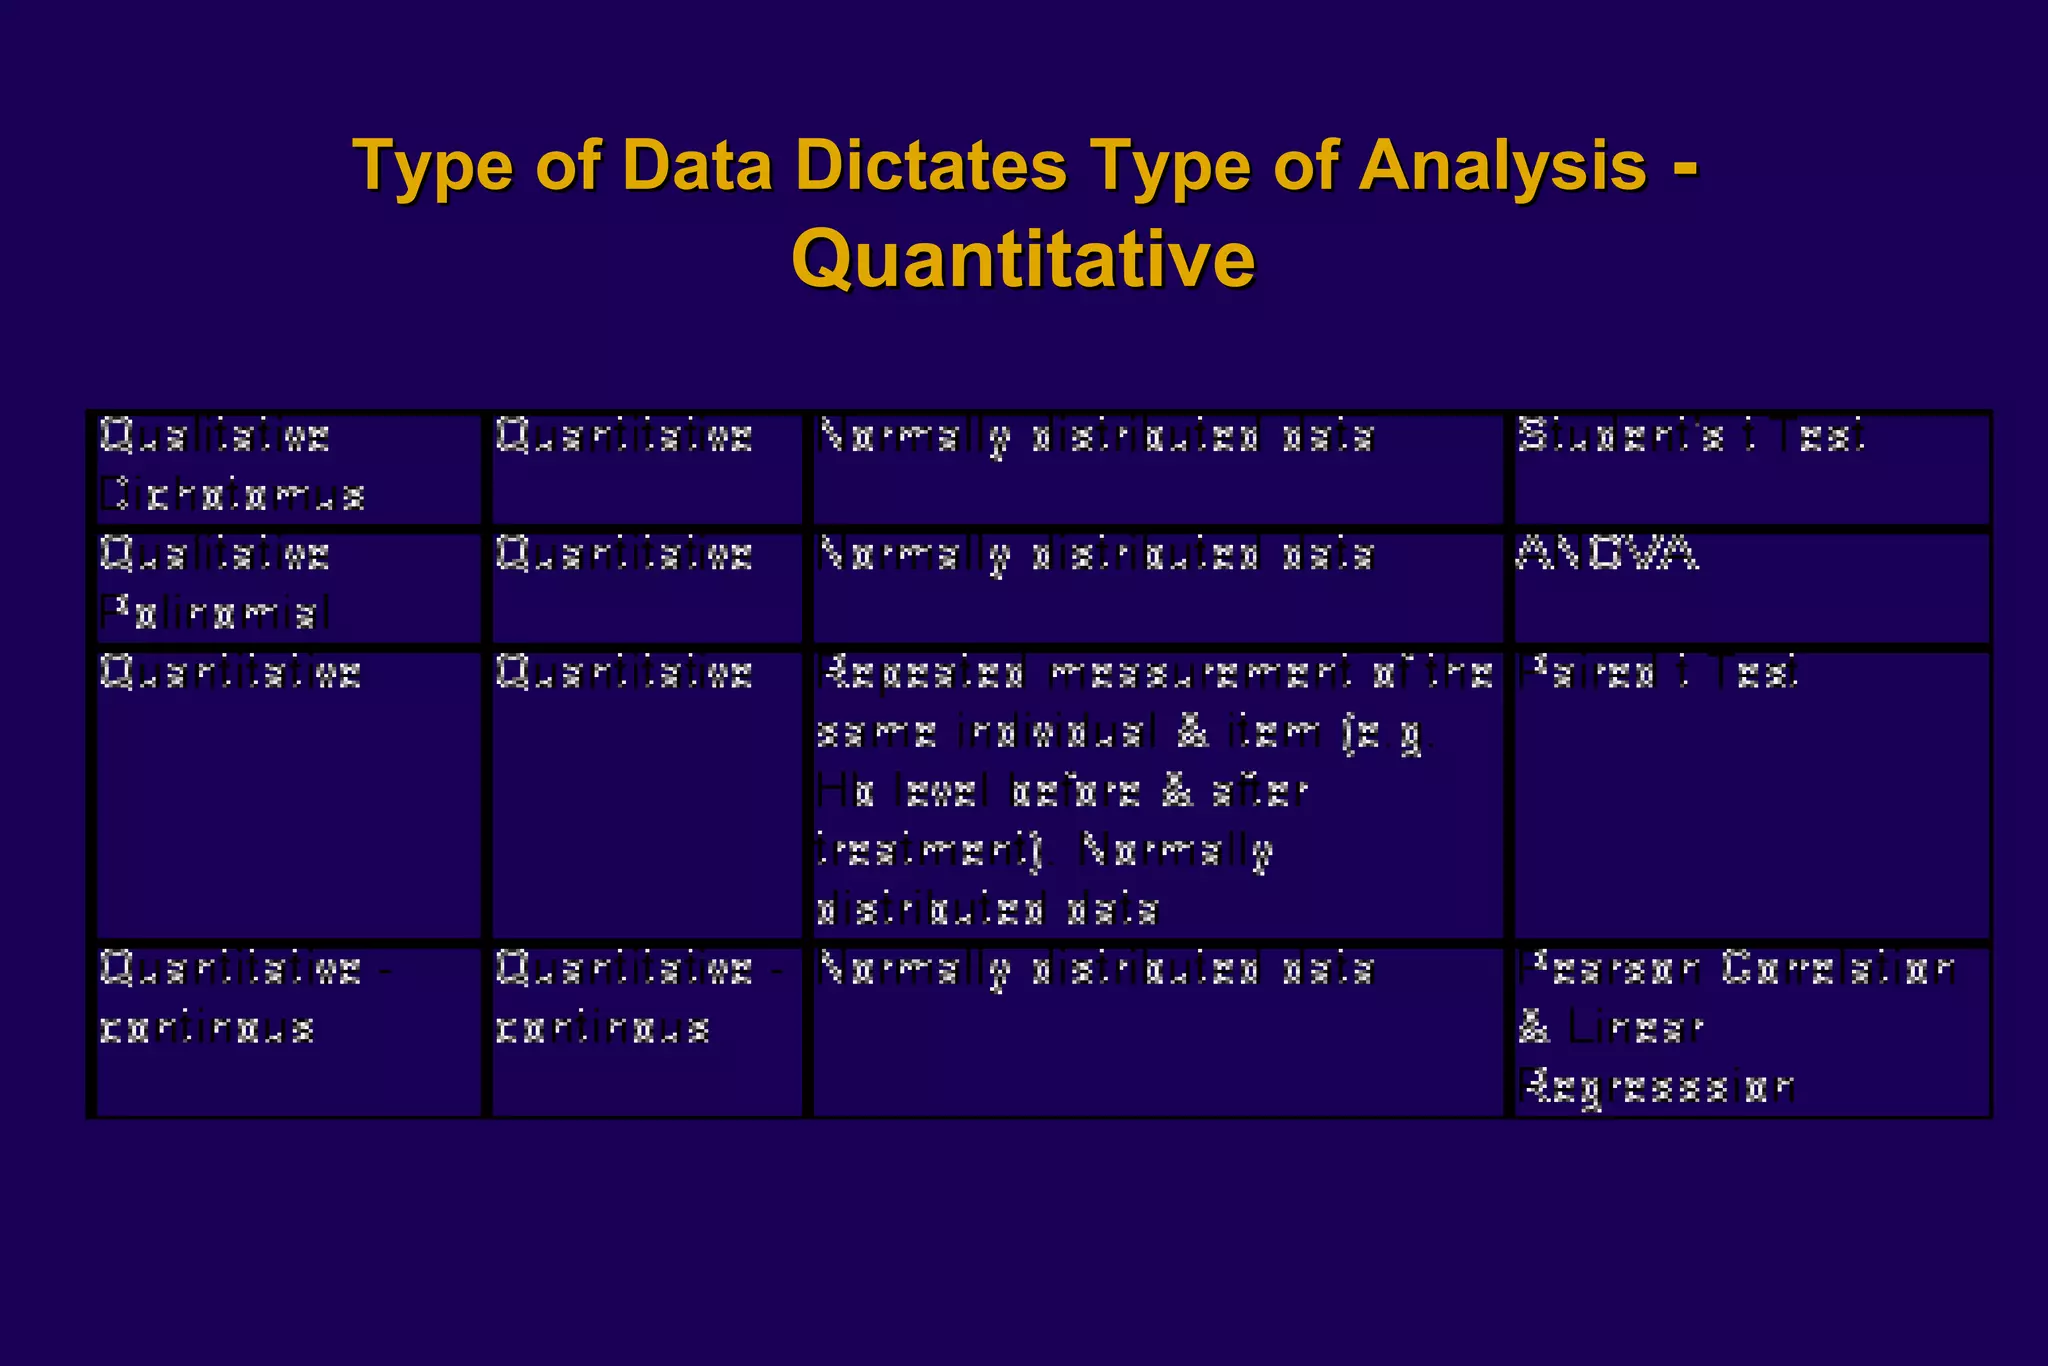
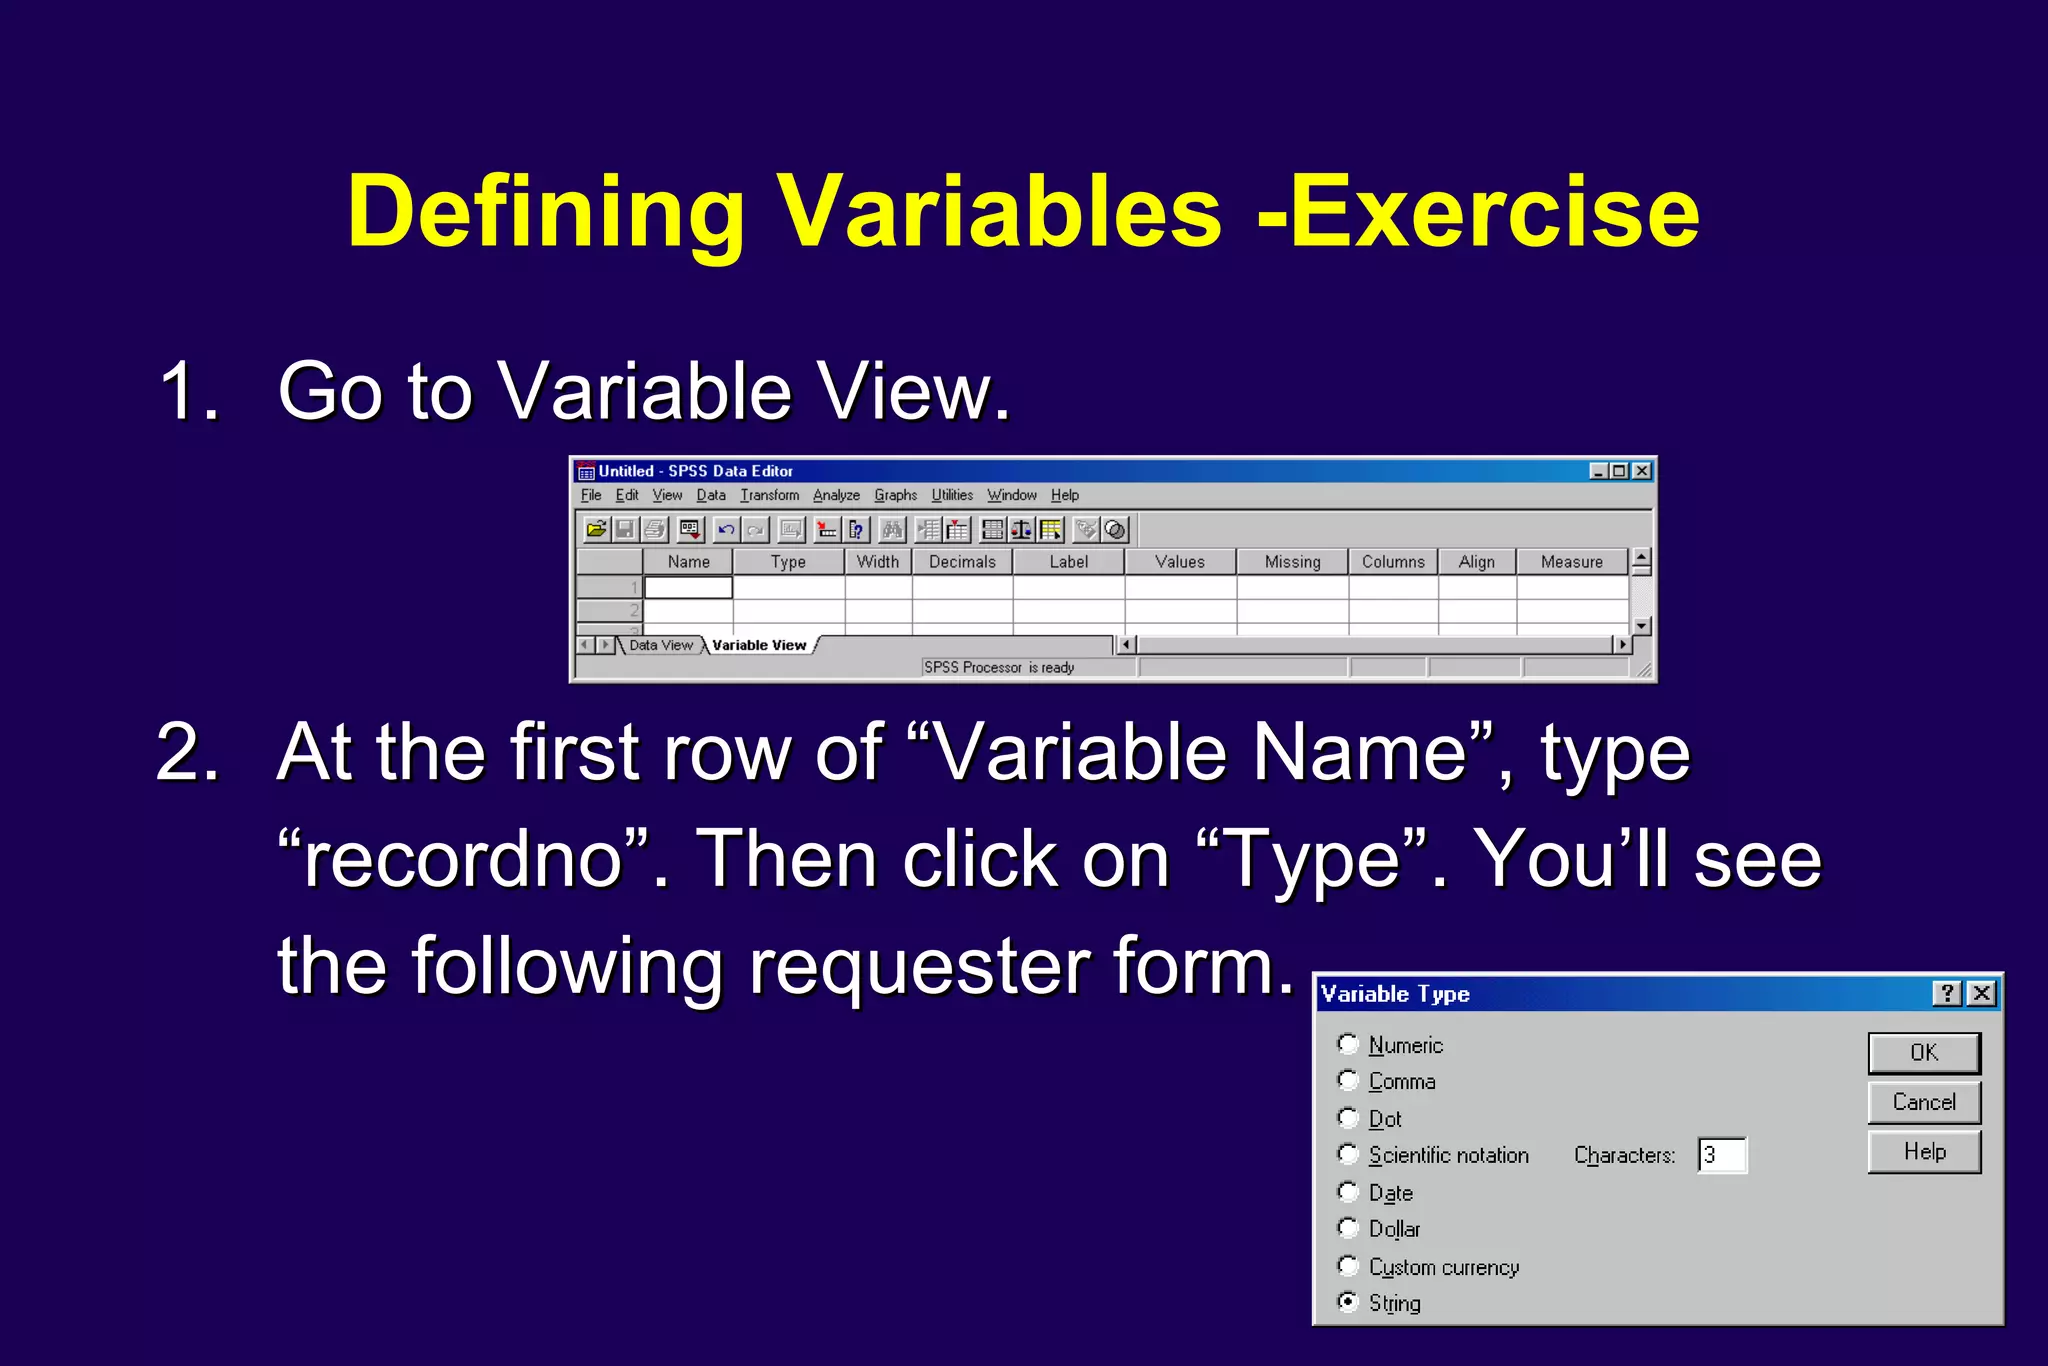
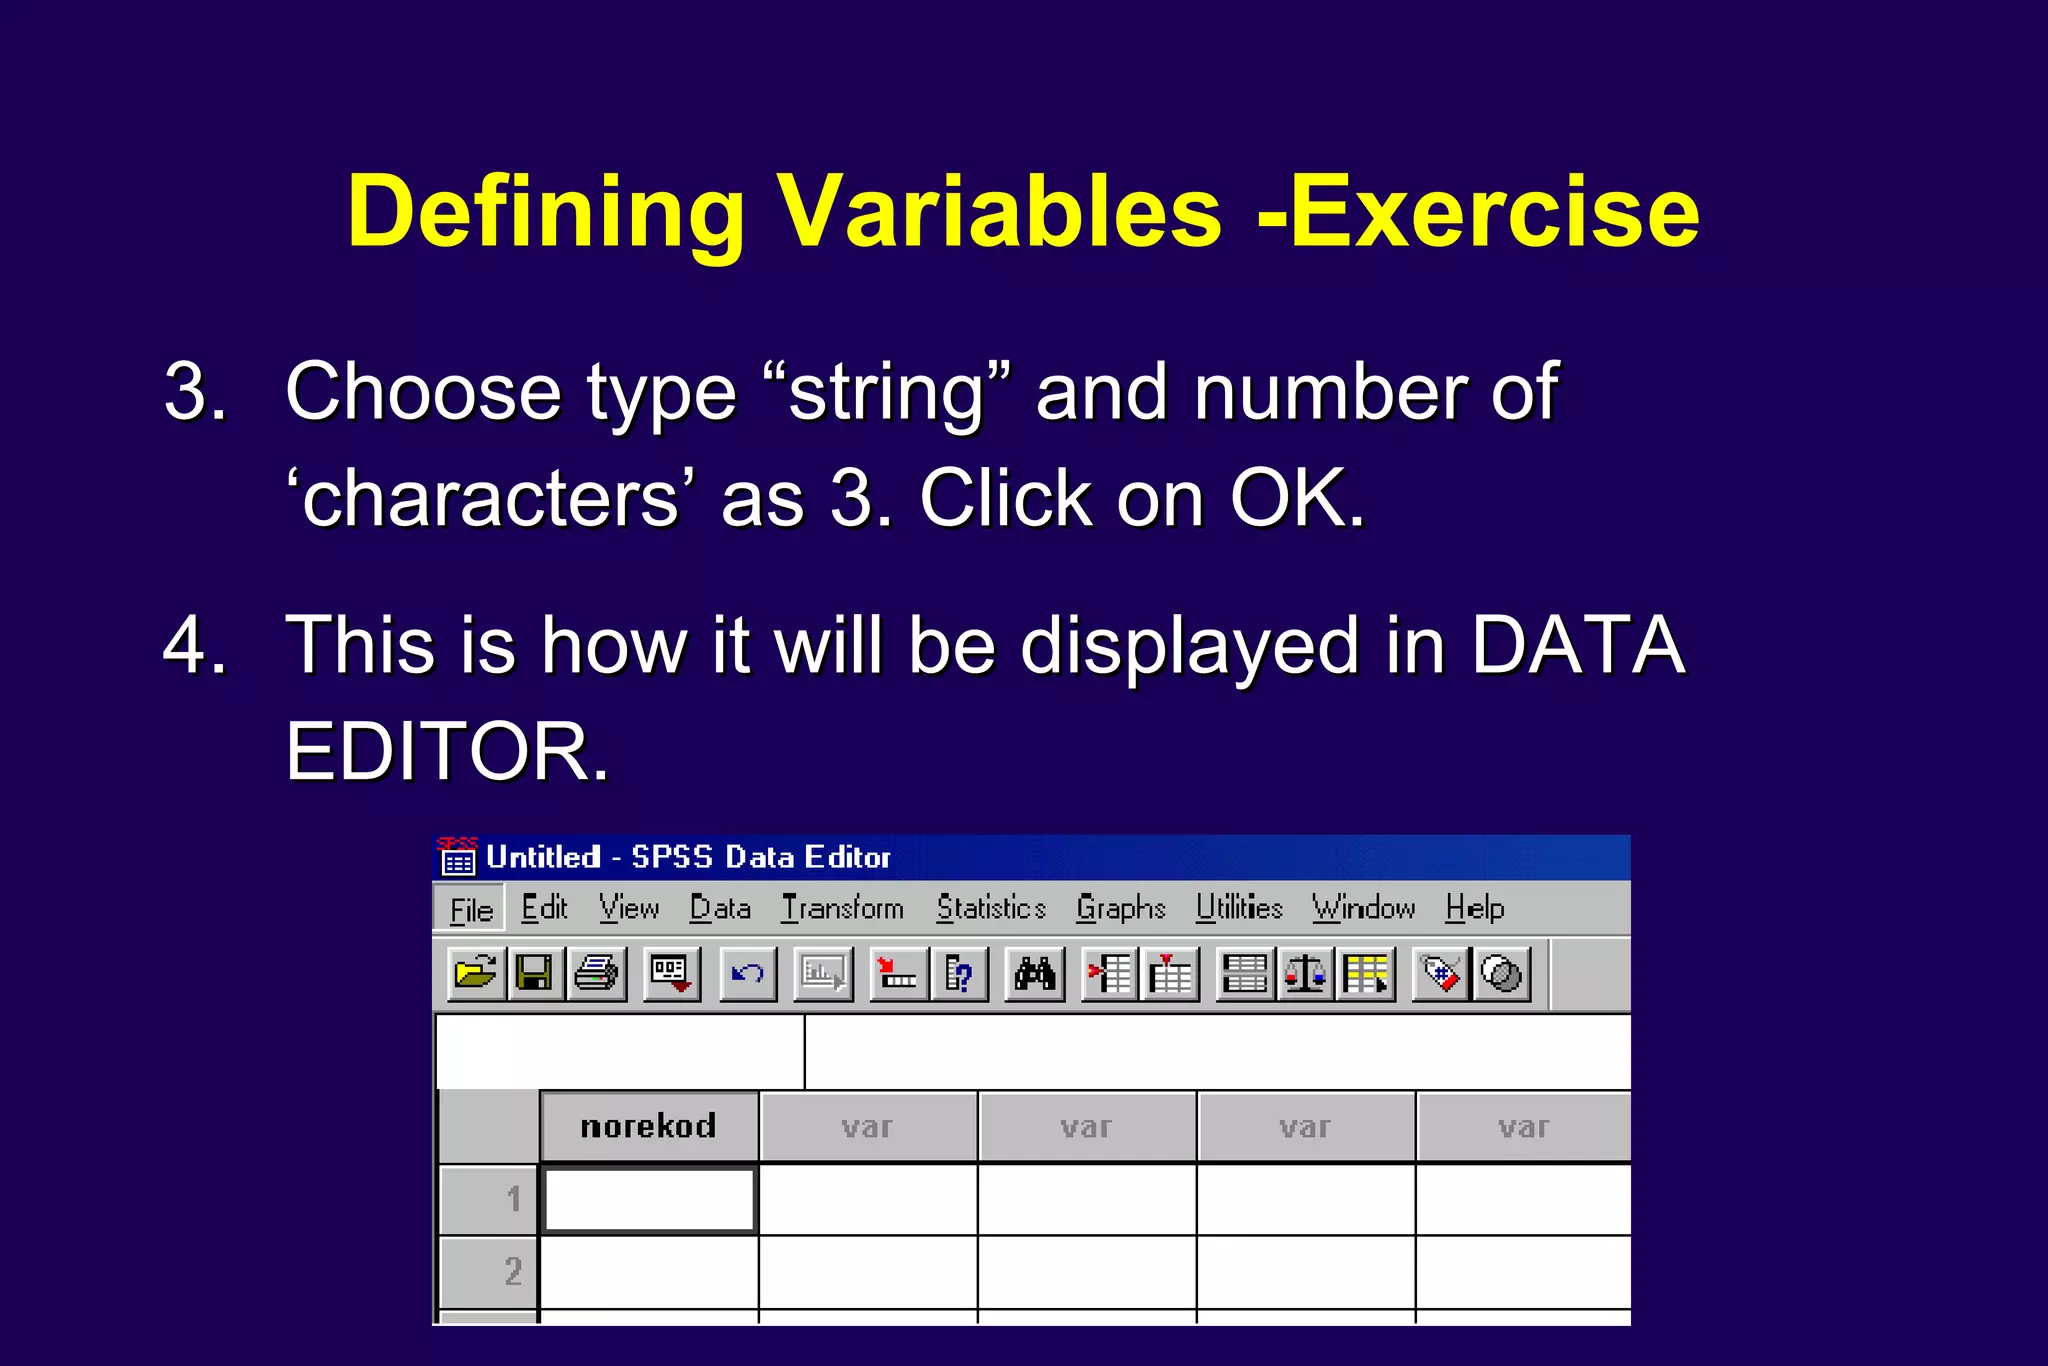
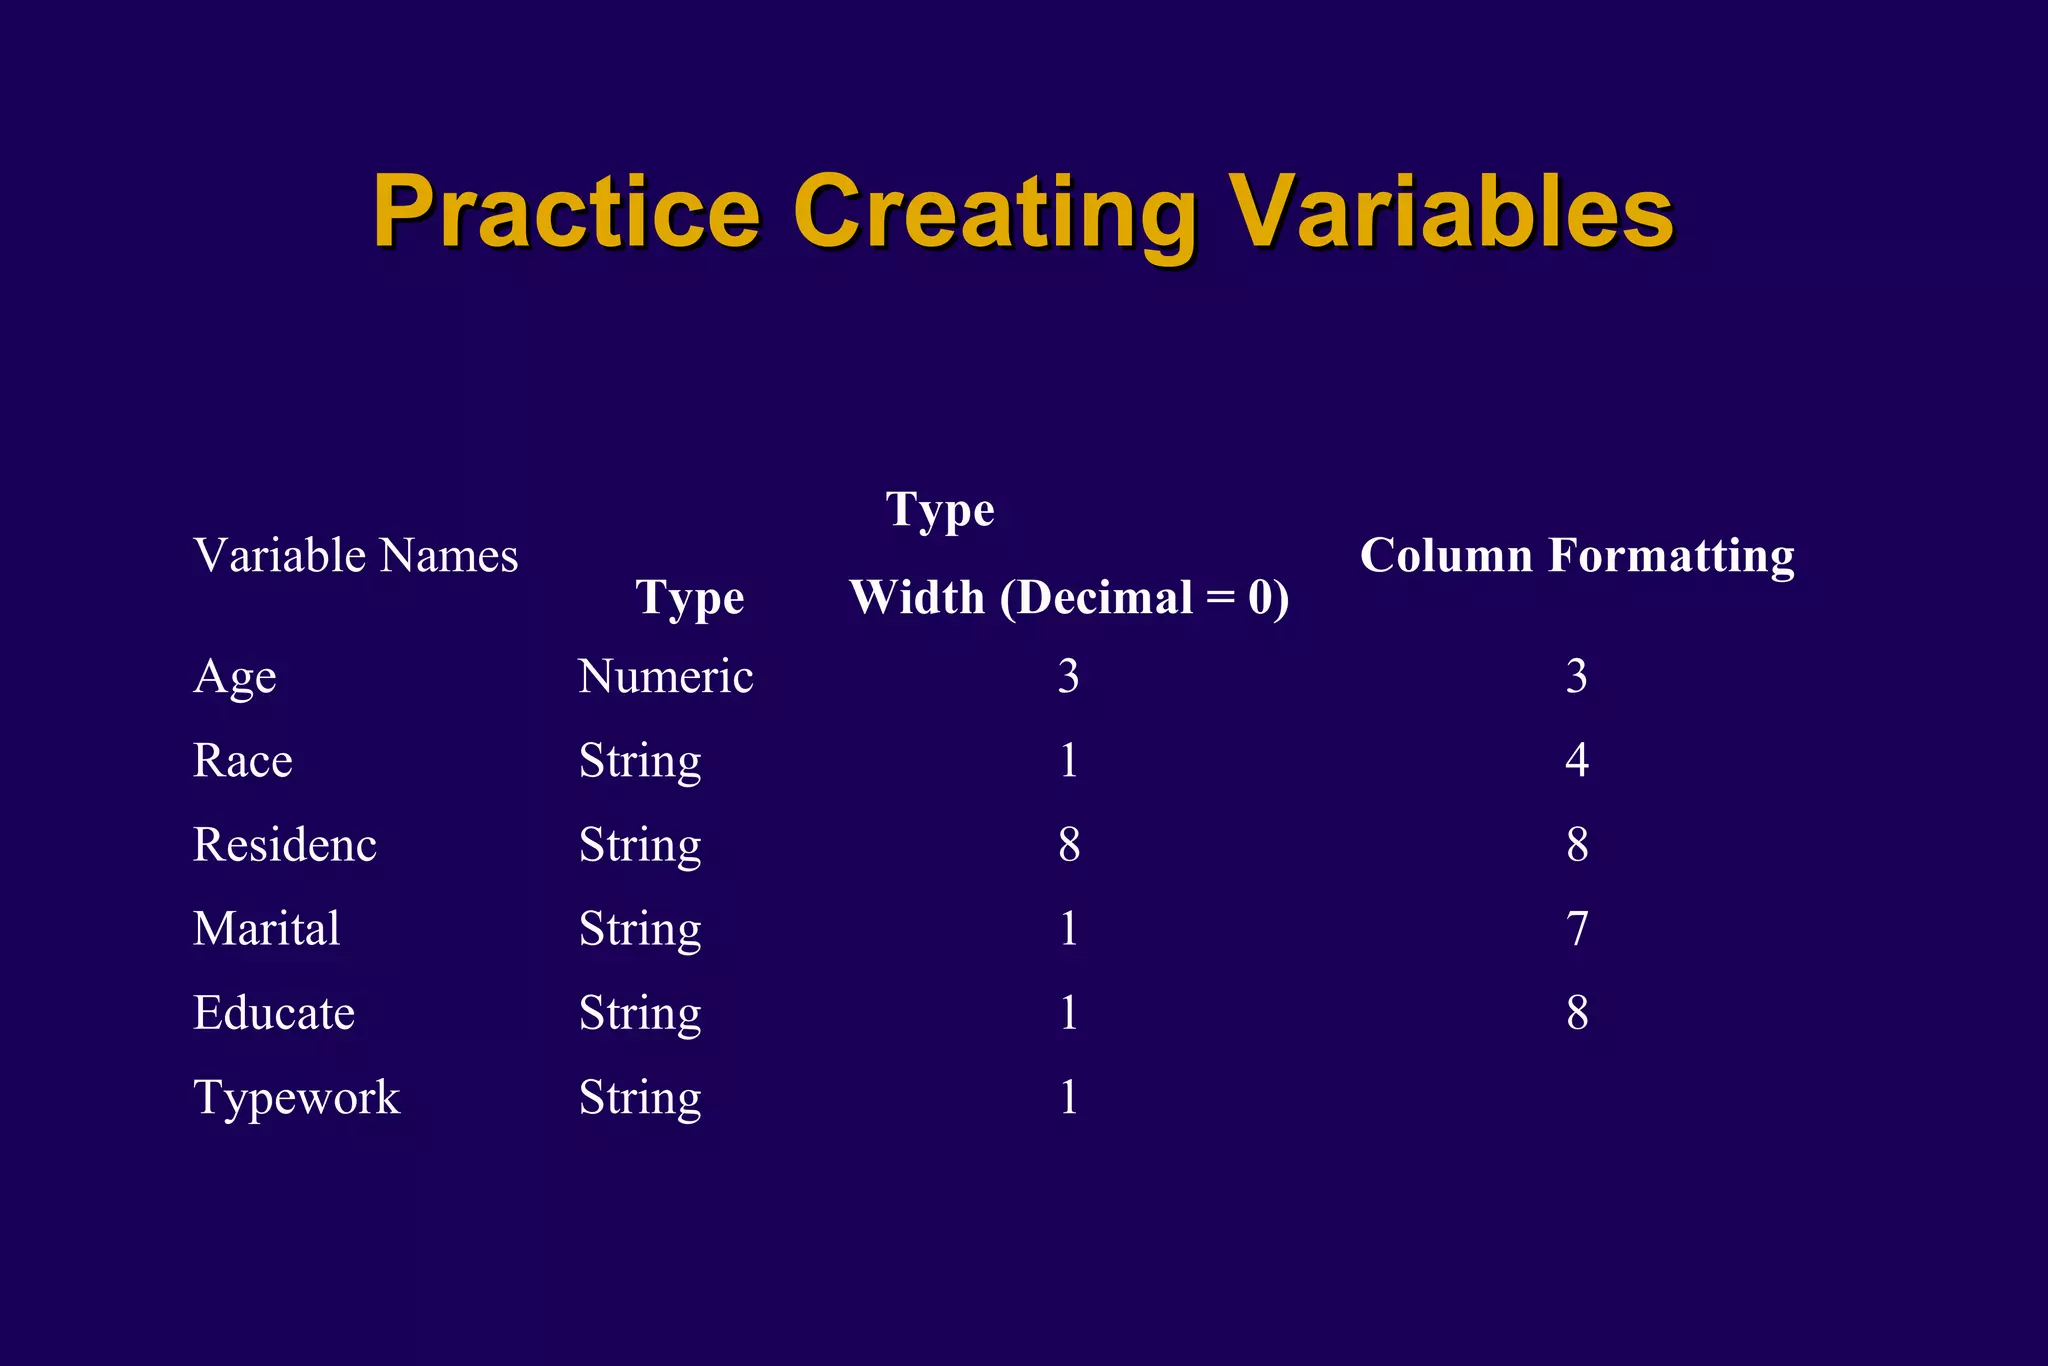
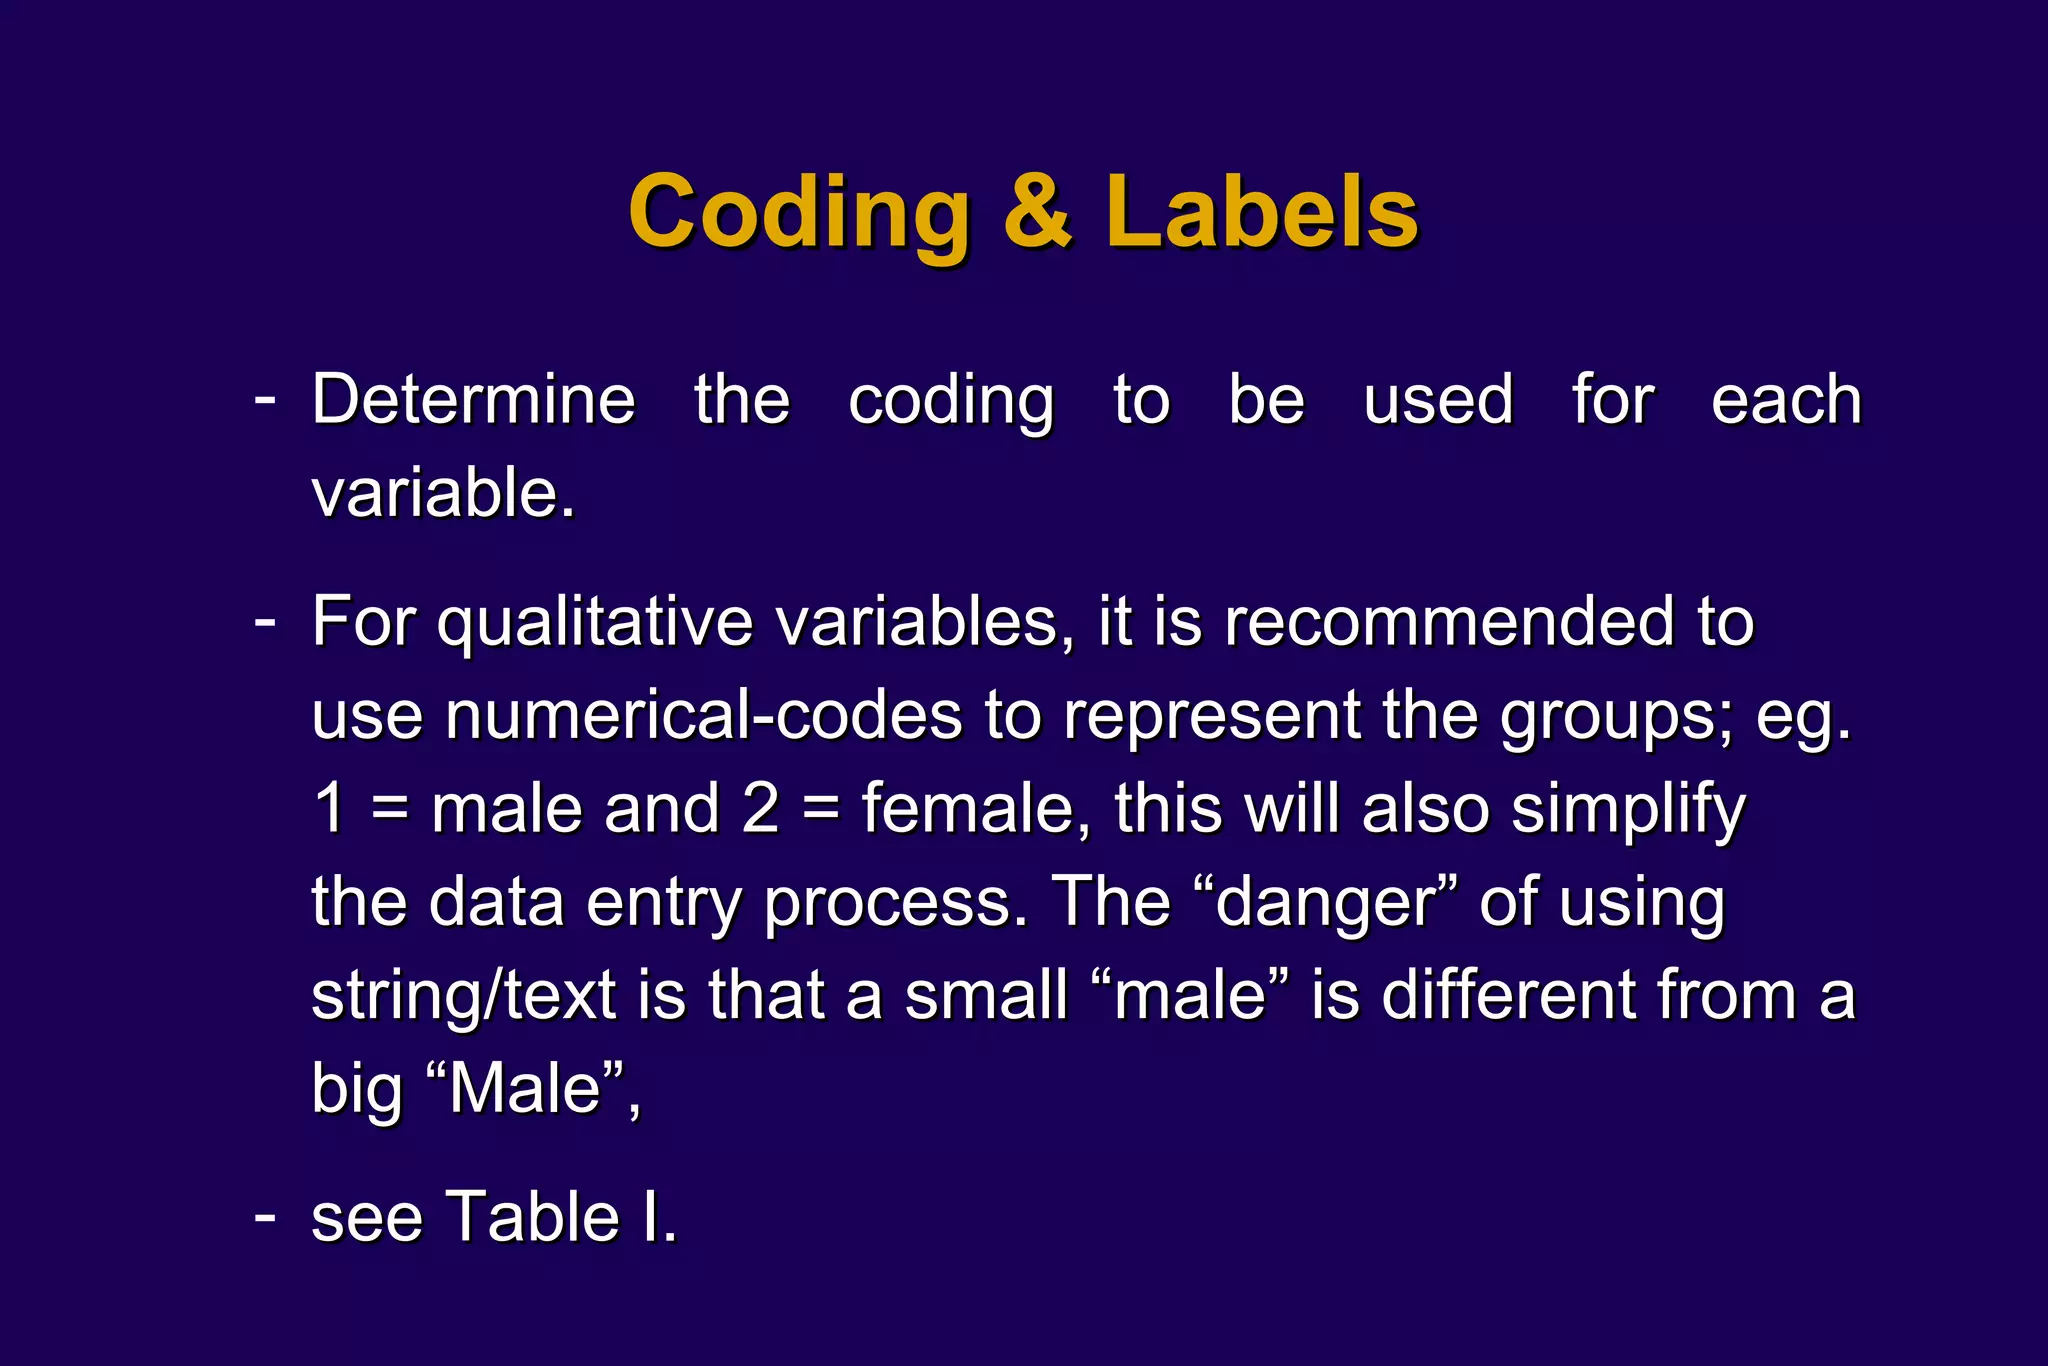
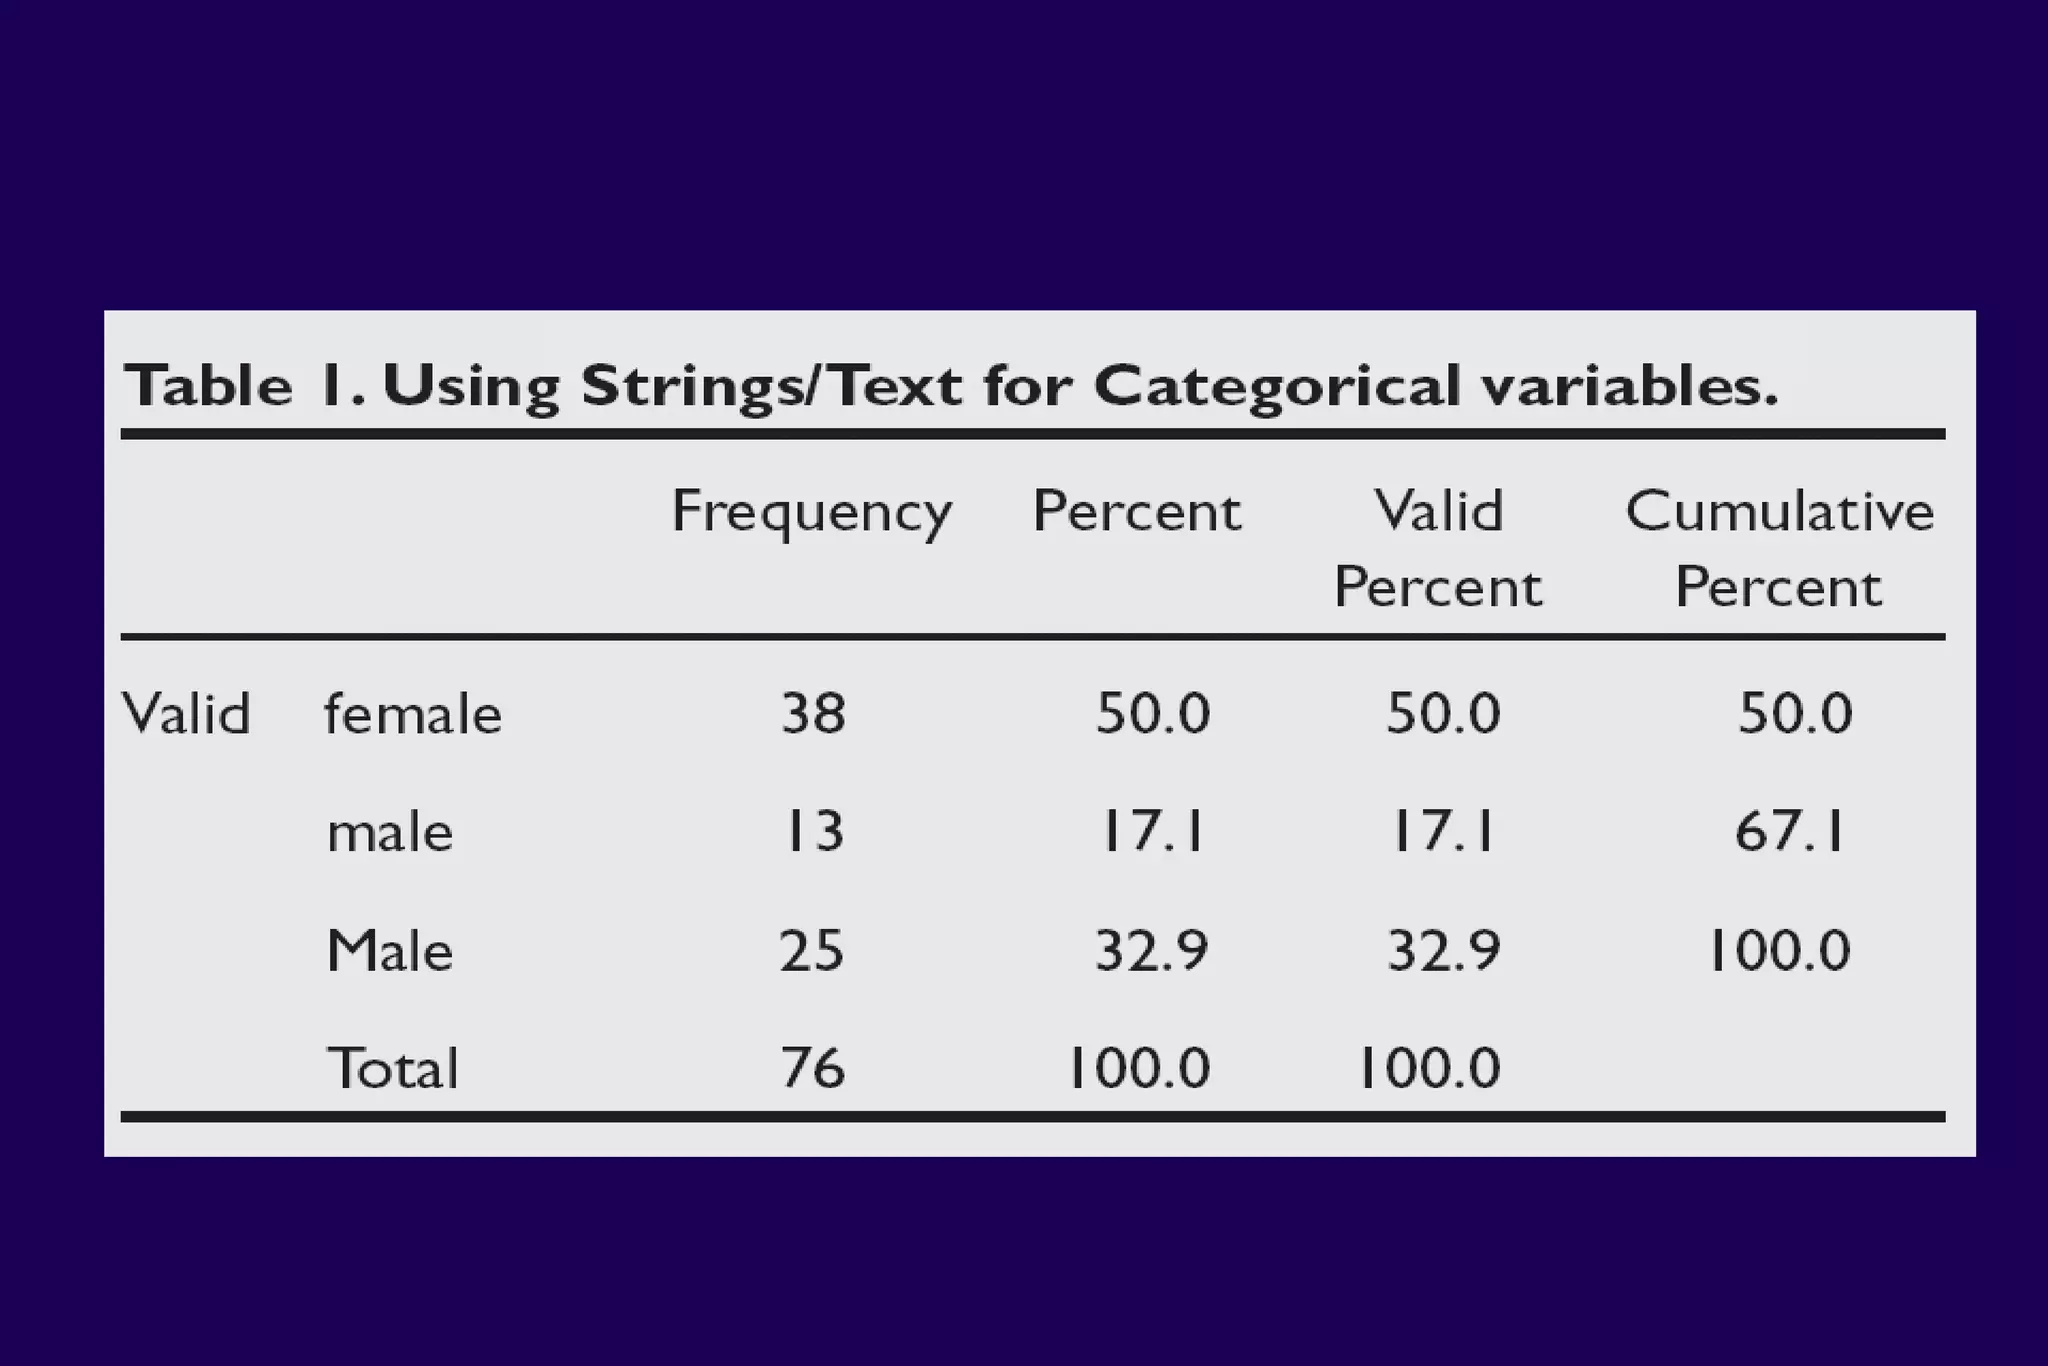
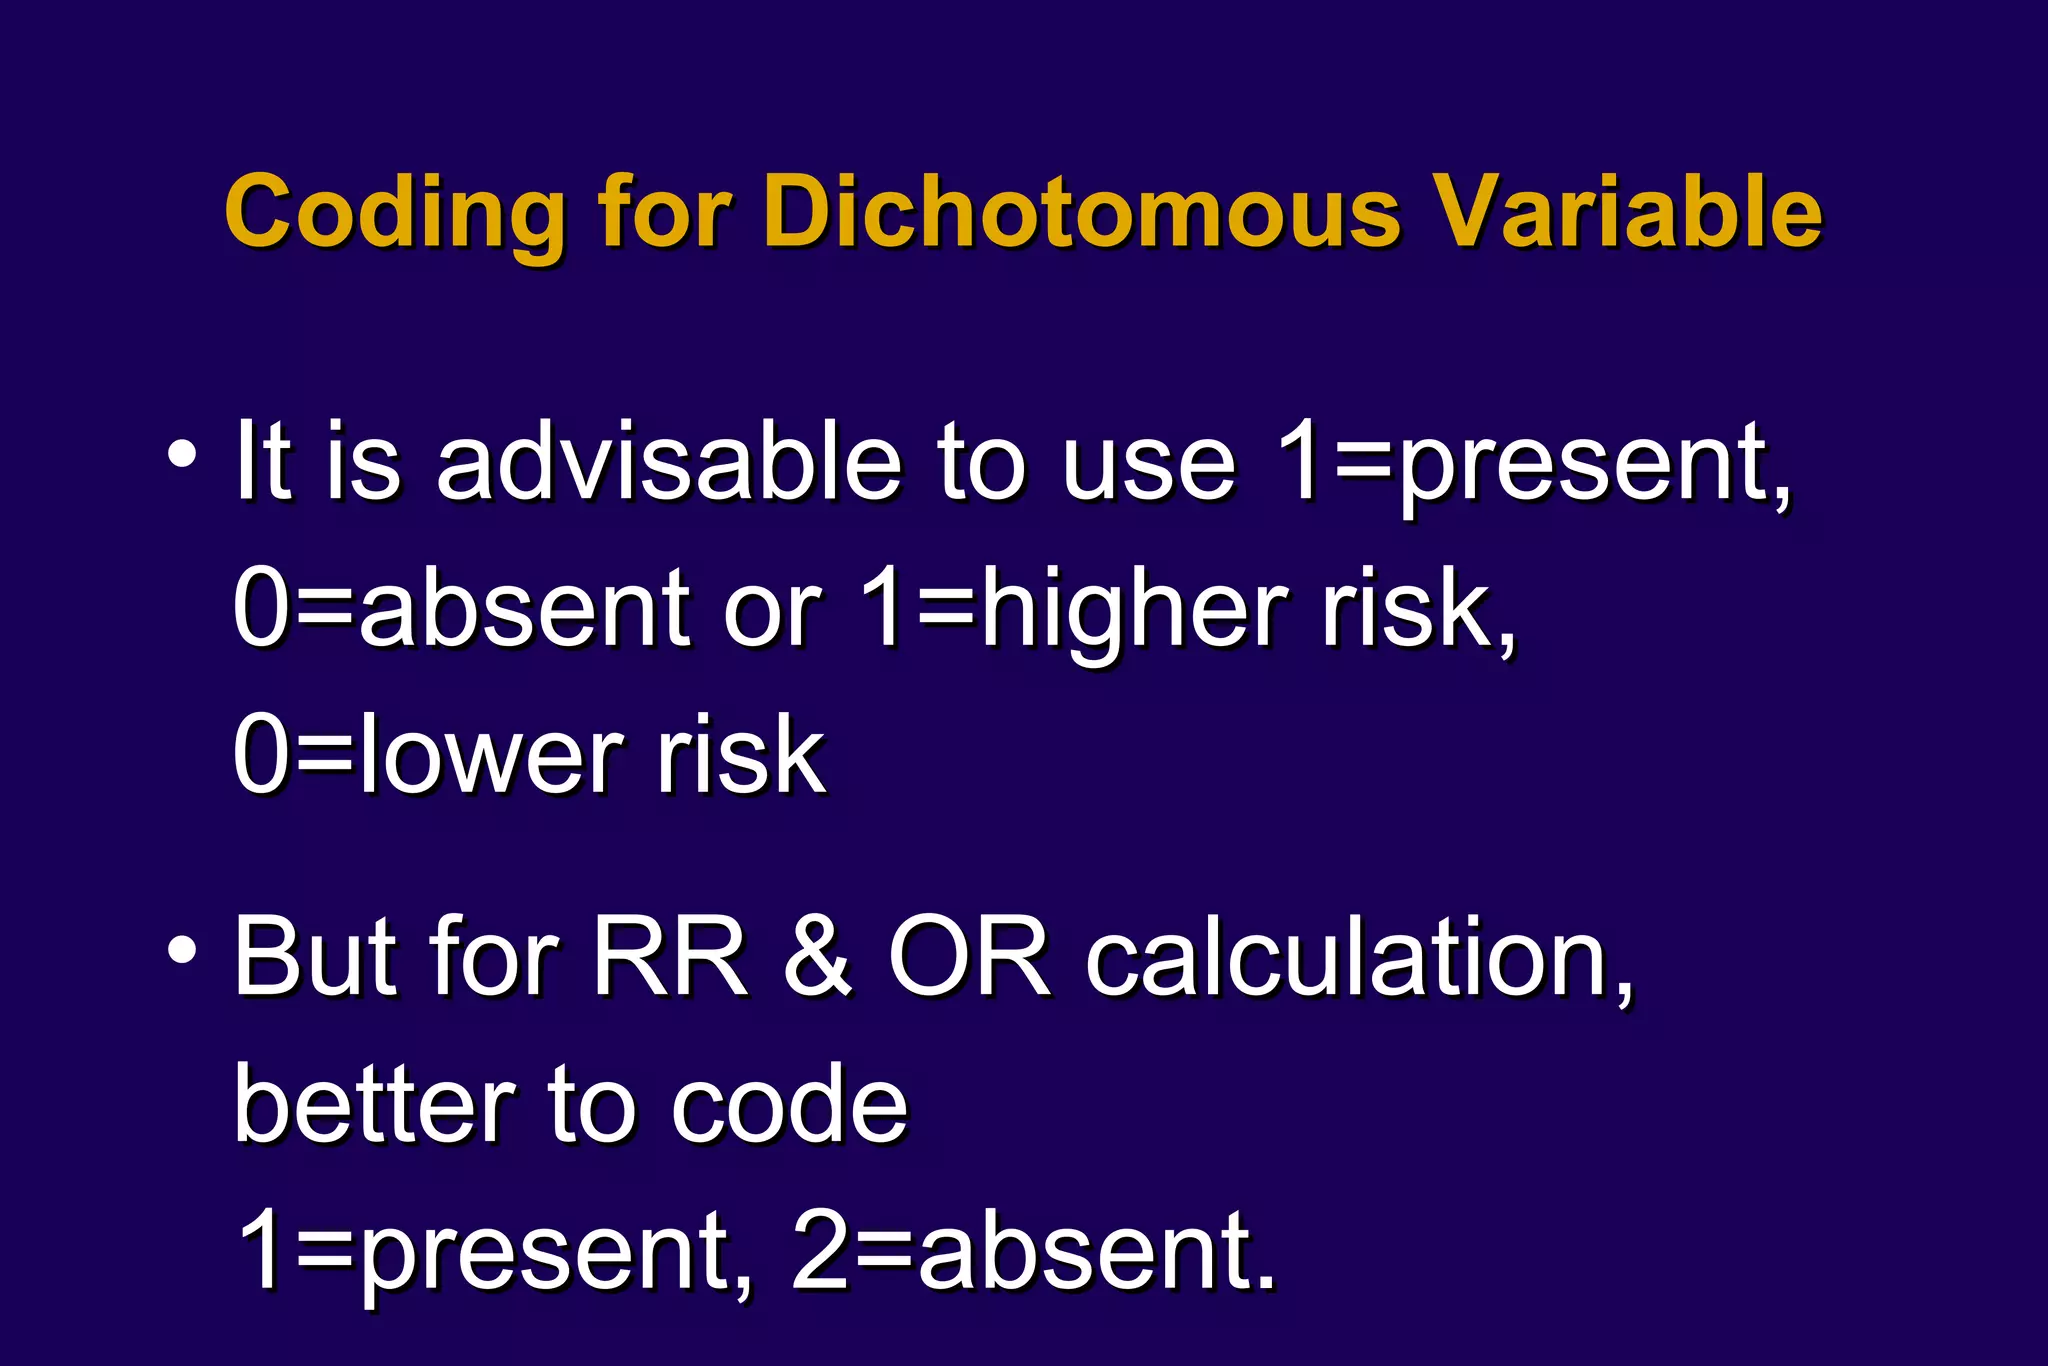
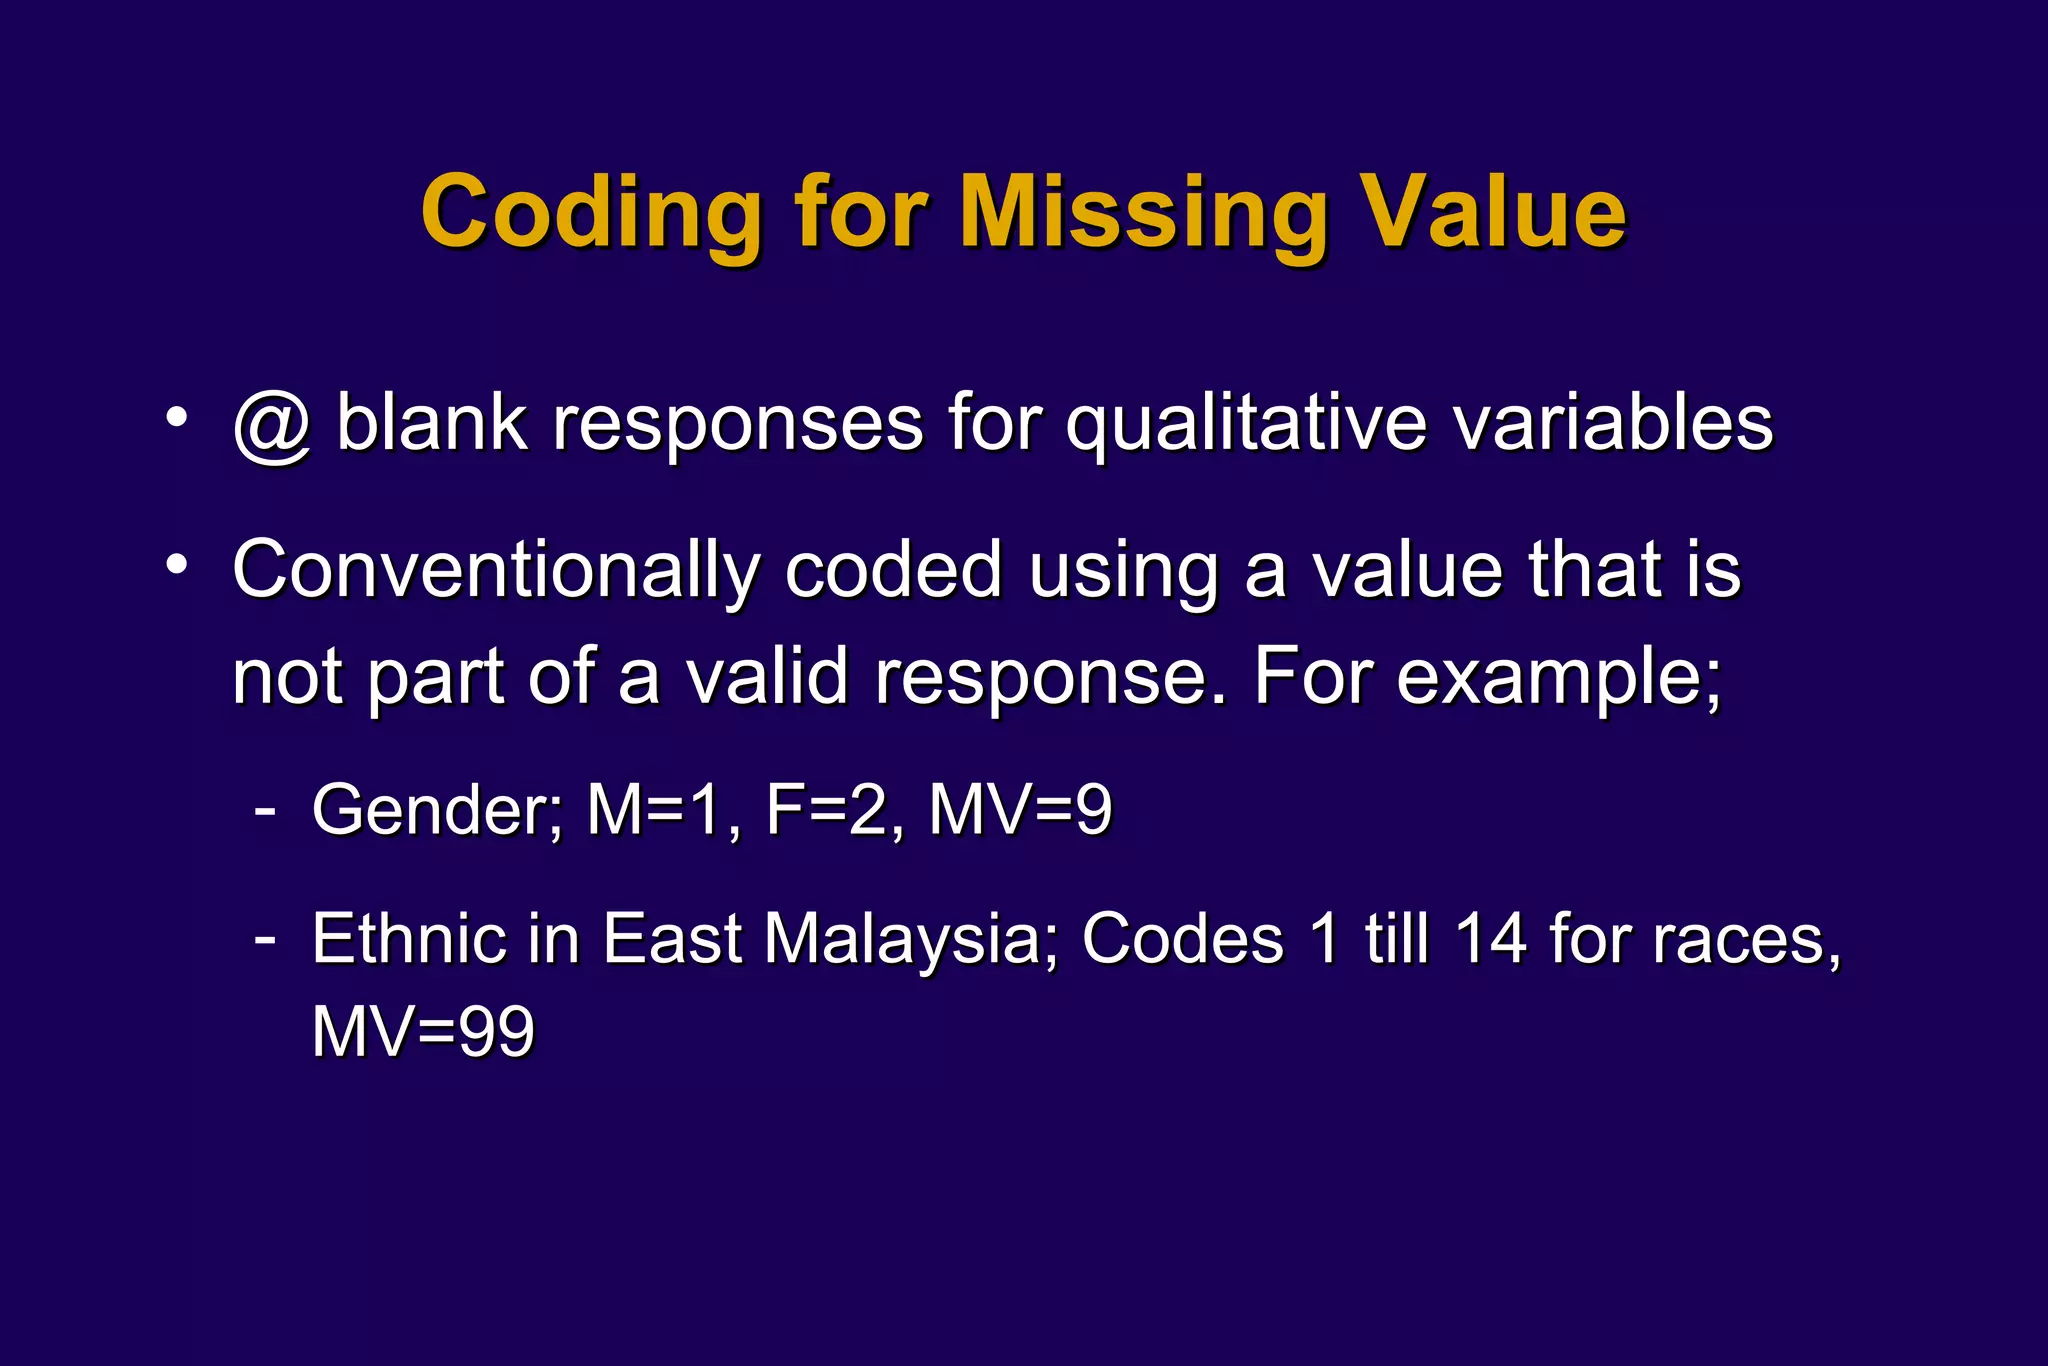

SPSS is a statistical software package used for analyzing data. It was developed in 1968 at Stanford University. SPSS stands for Statistical Package for the Social Sciences. The document discusses the types of variables in SPSS including qualitative (string) and quantitative (numeric) variables. It also covers defining variables such as variable name, type, width and labels to describe the values. Proper coding and labeling helps facilitate analysis and interpretation of results.