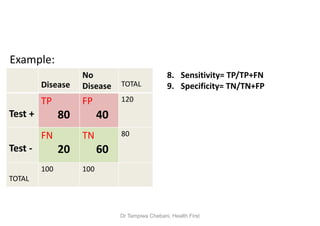
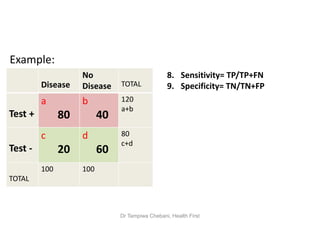
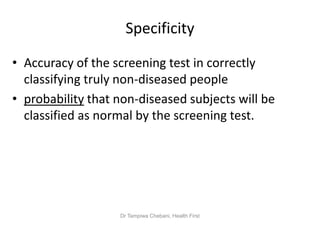
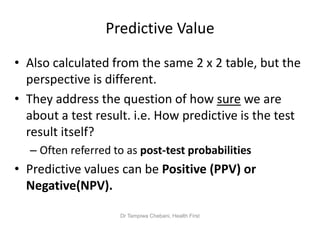
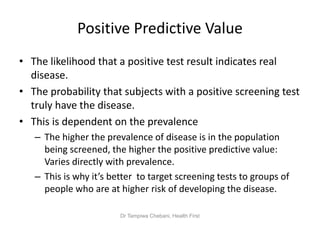
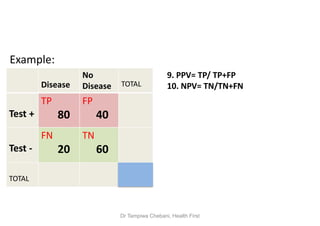
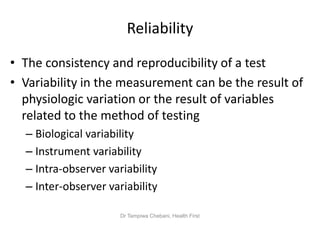
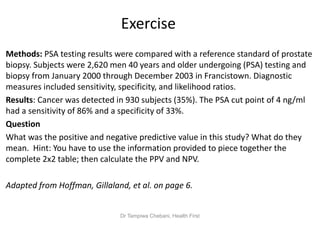
Screening and Screening test Validity
Dr. T. Chebani
drtampiwa@gmail.com
Dr Tampiwa Chebani, Health First
Learning Objectives
By the end of this lesson you should be able to:
• State reasons for disease screening.
• Discuss the potential harms of screening
• List the characteristics of a good screening test
• Define validity of a screening test
• Define reliability of a screening test
• Define, calculate, and interpret: sensitivity, specificity, positive
predictive value, and negative predictive value of a screening
test
• Explain how predictive value is influenced by prevalence
Dr Tampiwa Chebani, Health First
Screening Tests
• Screening is a strategy used in a population to
identify the possible presence of asymptomatic
disease in individuals.
• Forms a large part of secondary prevention.
Dr Tampiwa Chebani, Health First
Types of Screening
• Mass screening - screening of a whole population or
a subgroup. It is offered to all, irrespective of the
risk status of the individual.
• High risk or selective screening : High risk screening
is conducted among risk populations only.
Dr Tampiwa Chebani, Health First
Examples of Screening Tests
• Purified protein derivative (PPD) test to screen for
exposure to tuberculosis.
• Beck Depression Inventory to screen for depression
• Cancer screening
– Pap smear - precancerous cervical lesions
– Mammography to detect breast cancer
– Colonoscopy and faecal occult blood test to detect colorectal
cancer
Dr Tampiwa Chebani, Health First
Why do we Screen?
Recall Natural history of disease, Iceberg concept and
the preclinical phase of disease.
Dr Tampiwa Chebani, Health First
Disadvantages of Screening Tests
• Although screening may lead to an earlier diagnosis, not all
screening tests have been shown to be of benefit.
– There are problems associated with over-diagnosis and misdiagnosis.
• false positives
• false negatives
– e.g., gallstones, prostate-specific antigen
– Screening is inefficient if the prevalence is low
– Young women (20-30 years old) can get breast cancer, but the probability
is very low (and the sensitivity of mammography is low because younger
women have denser breast tissue) . Many of the false positives will be
subjected to extreme anxiety and worry. They may also undergo invasive
diagnostic tests such as needle biopsy and surgical excision unnecessarily.
Dr Tampiwa Chebani, Health First
...A Good Screening Test
1. The condition should be an important health problem.
2. There should be a treatment for the condition.
3. Facilities for diagnosis and treatment should be available.
4. Cheap
5. Easy to administer
6. Minimal discomfort for the patient.
7. Reliable (consistent)
8. Valid (distinguishes diseased & non-diseased people)
• But how good is a screening test at separating populations of
people with and without the disease in question?
Dr Tampiwa Chebani, Health First
...A Good Screening Test
But how do we determine how good a screening test
is at separating populations of people with and
without the disease in question?
• To address this question, we usually perform
validity tests on all screening tests before they are
widely accepted and used.
• We calculate measures of validity: Specificity and
sensitivity.
Dr Tampiwa Chebani, Health First
Validity of Screening tests
• Test validity is the ability of a screening test to accurately
identify diseased and non-diseased individuals.
• An ideal screening test is very sensitive (high probability
of detecting disease) and extremely specific (high
probability that those without the disease will screen
negative).
• This determination is made by comparing the screening
test to a "gold standard" that establishes the true disease
status.
• The gold standard is usually an expensive diagnostic test.
Dr Tampiwa Chebani, Health First
…Validity of Screening Tests
• It has 2 components:
- Sensitivity and Specificity
- these are often referred to as pre-test probabilities.
Dr Tampiwa Chebani, Health First
The Contingency (2x2) Table
• A 2 x 2 table is used when determining sensitivity
and specificity.
• But note that this is a different contingency table
than the ones used for cohort studies, clinical trials
and case-control studies.
Dr Tampiwa Chebani, Health First
Disease
No
Disease TOTAL
Test + 80 40
Test - 20 60
TOTAL
…The Contingency (2x2) Table
Example: 1. Complete the table by writing the
row and column totals
2. The blue rectangle should have the
table total.
3. The total for the column labelled
disease divided by the table
total(blue rectangle) X 100 gives the
prevalence of disease.
4. Patients who have disease and test
positive by screening test are called
TP(True Positive)=80
5. Patients who have disease and test
Negative by screening test are
called FN(False Negative)= 20
Dr Tampiwa Chebani, Health First
Disease
No
Disease TOTAL
Test + 80 40
Test - 20 60
TOTAL
…The Contingency (2x2) Table
Example:
6. Patients who don’t have disease
and test positive by screening test
are called FP(False Positive)= 40
7. Patients who don’t have disease
and test negative by screening test
are called TN(True Negative)= 60
Dr Tampiwa Chebani, Health First
Disease
No
Disease TOTAL
Test +
TP
80
FP
40
120
Test -
FN
20
TN
60
80
TOTAL
100 100
…The Contingency (2x2) Table
Example:
8. Sensitivity= TP/TP+FN
9. Specificity= TN/TN+FP
Dr Tampiwa Chebani, Health First
Disease
No
Disease TOTAL
Test +
a
80
b
40
120
a+b
Test -
c
20
d
60
80
c+d
TOTAL
100 100
…The Contingency (2x2) Table
Example:
8. Sensitivity= TP/TP+FN
9. Specificity= TN/TN+FP
Dr Tampiwa Chebani, Health First
Sensitivity
• How accurate the screening test is at identifying
disease in people who truly have the disease.
• probability that the test will correctly identify
diseased subjects.
Dr Tampiwa Chebani, Health First
Specificity
• Accuracy of the screening test in correctly
classifying truly non-diseased people
• probability that non-diseased subjects will be
classified as normal by the screening test.
Dr Tampiwa Chebani, Health First
Predictive Value
• Also calculated from the same 2 x 2 table, but the
perspective is different.
• They address the question of how sure we are
about a test result. i.e. How predictive is the test
result itself?
– Often referred to as post-test probabilities
• Predictive values can be Positive (PPV) or
Negative(NPV).
Dr Tampiwa Chebani, Health First
Positive Predictive Value
• The likelihood that a positive test result indicates real
disease.
• The probability that subjects with a positive screening test
truly have the disease.
• This is dependent on the prevalence
– The higher the prevalence of disease is in the population
being screened, the higher the positive predictive value:
Varies directly with prevalence.
– This is why it’s better to target screening tests to groups of
people who are at higher risk of developing the disease.
Dr Tampiwa Chebani, Health First
Negative Predictive Value
• The likelihood that a negative test result
indicates no disease.
• The probability that subjects with a negative
screening test truly don't have the disease.
• Varies inversely with prevalence.
Dr Tampiwa Chebani, Health First
Disease
No
Disease TOTAL
Test +
TP
80
FP
40
Test -
FN
20
TN
60
TOTAL
…The Contingency (2x2) Table
Example:
9. PPV= TP/ TP+FP
10. NPV= TN/TN+FN
Dr Tampiwa Chebani, Health First
Reliability
• The consistency and reproducibility of a test
• Variability in the measurement can be the result of
physiologic variation or the result of variables
related to the method of testing
– Biological variability
– Instrument variability
– Intra-observer variability
– Inter-observer variability
Dr Tampiwa Chebani, Health First
Exercise
Methods: PSA testing results were compared with a reference standard of prostate
biopsy. Subjects were 2,620 men 40 years and older undergoing (PSA) testing and
biopsy from January 2000 through December 2003 in Francistown. Diagnostic
measures included sensitivity, specificity, and likelihood ratios.
Results: Cancer was detected in 930 subjects (35%). The PSA cut point of 4 ng/ml
had a sensitivity of 86% and a specificity of 33%.
Question
What was the positive and negative predictive value in this study? What do they
mean. Hint: You have to use the information provided to piece together the
complete 2x2 table; then calculate the PPV and NPV.
Adapted from Hoffman, Gillaland, et al. on page 6.
Dr Tampiwa Chebani, Health First

Disease screening and screening test validity

  • 1.
    Screening and Screeningtest Validity Dr. T. Chebani drtampiwa@gmail.com Dr Tampiwa Chebani, Health First
  • 2.
    Learning Objectives By theend of this lesson you should be able to: • State reasons for disease screening. • Discuss the potential harms of screening • List the characteristics of a good screening test • Define validity of a screening test • Define reliability of a screening test • Define, calculate, and interpret: sensitivity, specificity, positive predictive value, and negative predictive value of a screening test • Explain how predictive value is influenced by prevalence Dr Tampiwa Chebani, Health First
  • 3.
    Screening Tests • Screeningis a strategy used in a population to identify the possible presence of asymptomatic disease in individuals. • Forms a large part of secondary prevention. Dr Tampiwa Chebani, Health First
  • 4.
    Types of Screening •Mass screening - screening of a whole population or a subgroup. It is offered to all, irrespective of the risk status of the individual. • High risk or selective screening : High risk screening is conducted among risk populations only. Dr Tampiwa Chebani, Health First
  • 5.
    Examples of ScreeningTests • Purified protein derivative (PPD) test to screen for exposure to tuberculosis. • Beck Depression Inventory to screen for depression • Cancer screening – Pap smear - precancerous cervical lesions – Mammography to detect breast cancer – Colonoscopy and faecal occult blood test to detect colorectal cancer Dr Tampiwa Chebani, Health First
  • 6.
    Why do weScreen? Recall Natural history of disease, Iceberg concept and the preclinical phase of disease. Dr Tampiwa Chebani, Health First
  • 7.
    Disadvantages of ScreeningTests • Although screening may lead to an earlier diagnosis, not all screening tests have been shown to be of benefit. – There are problems associated with over-diagnosis and misdiagnosis. • false positives • false negatives – e.g., gallstones, prostate-specific antigen – Screening is inefficient if the prevalence is low – Young women (20-30 years old) can get breast cancer, but the probability is very low (and the sensitivity of mammography is low because younger women have denser breast tissue) . Many of the false positives will be subjected to extreme anxiety and worry. They may also undergo invasive diagnostic tests such as needle biopsy and surgical excision unnecessarily. Dr Tampiwa Chebani, Health First
  • 8.
    ...A Good ScreeningTest 1. The condition should be an important health problem. 2. There should be a treatment for the condition. 3. Facilities for diagnosis and treatment should be available. 4. Cheap 5. Easy to administer 6. Minimal discomfort for the patient. 7. Reliable (consistent) 8. Valid (distinguishes diseased & non-diseased people) • But how good is a screening test at separating populations of people with and without the disease in question? Dr Tampiwa Chebani, Health First
  • 9.
    ...A Good ScreeningTest But how do we determine how good a screening test is at separating populations of people with and without the disease in question? • To address this question, we usually perform validity tests on all screening tests before they are widely accepted and used. • We calculate measures of validity: Specificity and sensitivity. Dr Tampiwa Chebani, Health First
  • 10.
    Validity of Screeningtests • Test validity is the ability of a screening test to accurately identify diseased and non-diseased individuals. • An ideal screening test is very sensitive (high probability of detecting disease) and extremely specific (high probability that those without the disease will screen negative). • This determination is made by comparing the screening test to a "gold standard" that establishes the true disease status. • The gold standard is usually an expensive diagnostic test. Dr Tampiwa Chebani, Health First
  • 11.
    …Validity of ScreeningTests • It has 2 components: - Sensitivity and Specificity - these are often referred to as pre-test probabilities. Dr Tampiwa Chebani, Health First
  • 12.
    The Contingency (2x2)Table • A 2 x 2 table is used when determining sensitivity and specificity. • But note that this is a different contingency table than the ones used for cohort studies, clinical trials and case-control studies. Dr Tampiwa Chebani, Health First
  • 13.
    Disease No Disease TOTAL Test +80 40 Test - 20 60 TOTAL …The Contingency (2x2) Table Example: 1. Complete the table by writing the row and column totals 2. The blue rectangle should have the table total. 3. The total for the column labelled disease divided by the table total(blue rectangle) X 100 gives the prevalence of disease. 4. Patients who have disease and test positive by screening test are called TP(True Positive)=80 5. Patients who have disease and test Negative by screening test are called FN(False Negative)= 20 Dr Tampiwa Chebani, Health First
  • 14.
    Disease No Disease TOTAL Test +80 40 Test - 20 60 TOTAL …The Contingency (2x2) Table Example: 6. Patients who don’t have disease and test positive by screening test are called FP(False Positive)= 40 7. Patients who don’t have disease and test negative by screening test are called TN(True Negative)= 60 Dr Tampiwa Chebani, Health First
  • 15.
    Disease No Disease TOTAL Test + TP 80 FP 40 120 Test- FN 20 TN 60 80 TOTAL 100 100 …The Contingency (2x2) Table Example: 8. Sensitivity= TP/TP+FN 9. Specificity= TN/TN+FP Dr Tampiwa Chebani, Health First
  • 16.
    Disease No Disease TOTAL Test + a 80 b 40 120 a+b Test- c 20 d 60 80 c+d TOTAL 100 100 …The Contingency (2x2) Table Example: 8. Sensitivity= TP/TP+FN 9. Specificity= TN/TN+FP Dr Tampiwa Chebani, Health First
  • 17.
    Sensitivity • How accuratethe screening test is at identifying disease in people who truly have the disease. • probability that the test will correctly identify diseased subjects. Dr Tampiwa Chebani, Health First
  • 18.
    Specificity • Accuracy ofthe screening test in correctly classifying truly non-diseased people • probability that non-diseased subjects will be classified as normal by the screening test. Dr Tampiwa Chebani, Health First
  • 19.
    Predictive Value • Alsocalculated from the same 2 x 2 table, but the perspective is different. • They address the question of how sure we are about a test result. i.e. How predictive is the test result itself? – Often referred to as post-test probabilities • Predictive values can be Positive (PPV) or Negative(NPV). Dr Tampiwa Chebani, Health First
  • 20.
    Positive Predictive Value •The likelihood that a positive test result indicates real disease. • The probability that subjects with a positive screening test truly have the disease. • This is dependent on the prevalence – The higher the prevalence of disease is in the population being screened, the higher the positive predictive value: Varies directly with prevalence. – This is why it’s better to target screening tests to groups of people who are at higher risk of developing the disease. Dr Tampiwa Chebani, Health First
  • 21.
    Negative Predictive Value •The likelihood that a negative test result indicates no disease. • The probability that subjects with a negative screening test truly don't have the disease. • Varies inversely with prevalence. Dr Tampiwa Chebani, Health First
  • 22.
    Disease No Disease TOTAL Test + TP 80 FP 40 Test- FN 20 TN 60 TOTAL …The Contingency (2x2) Table Example: 9. PPV= TP/ TP+FP 10. NPV= TN/TN+FN Dr Tampiwa Chebani, Health First
  • 23.
    Dr Tampiwa Chebani,Health First
  • 24.
    Reliability • The consistencyand reproducibility of a test • Variability in the measurement can be the result of physiologic variation or the result of variables related to the method of testing – Biological variability – Instrument variability – Intra-observer variability – Inter-observer variability Dr Tampiwa Chebani, Health First
  • 25.
    Exercise Methods: PSA testingresults were compared with a reference standard of prostate biopsy. Subjects were 2,620 men 40 years and older undergoing (PSA) testing and biopsy from January 2000 through December 2003 in Francistown. Diagnostic measures included sensitivity, specificity, and likelihood ratios. Results: Cancer was detected in 930 subjects (35%). The PSA cut point of 4 ng/ml had a sensitivity of 86% and a specificity of 33%. Question What was the positive and negative predictive value in this study? What do they mean. Hint: You have to use the information provided to piece together the complete 2x2 table; then calculate the PPV and NPV. Adapted from Hoffman, Gillaland, et al. on page 6. Dr Tampiwa Chebani, Health First