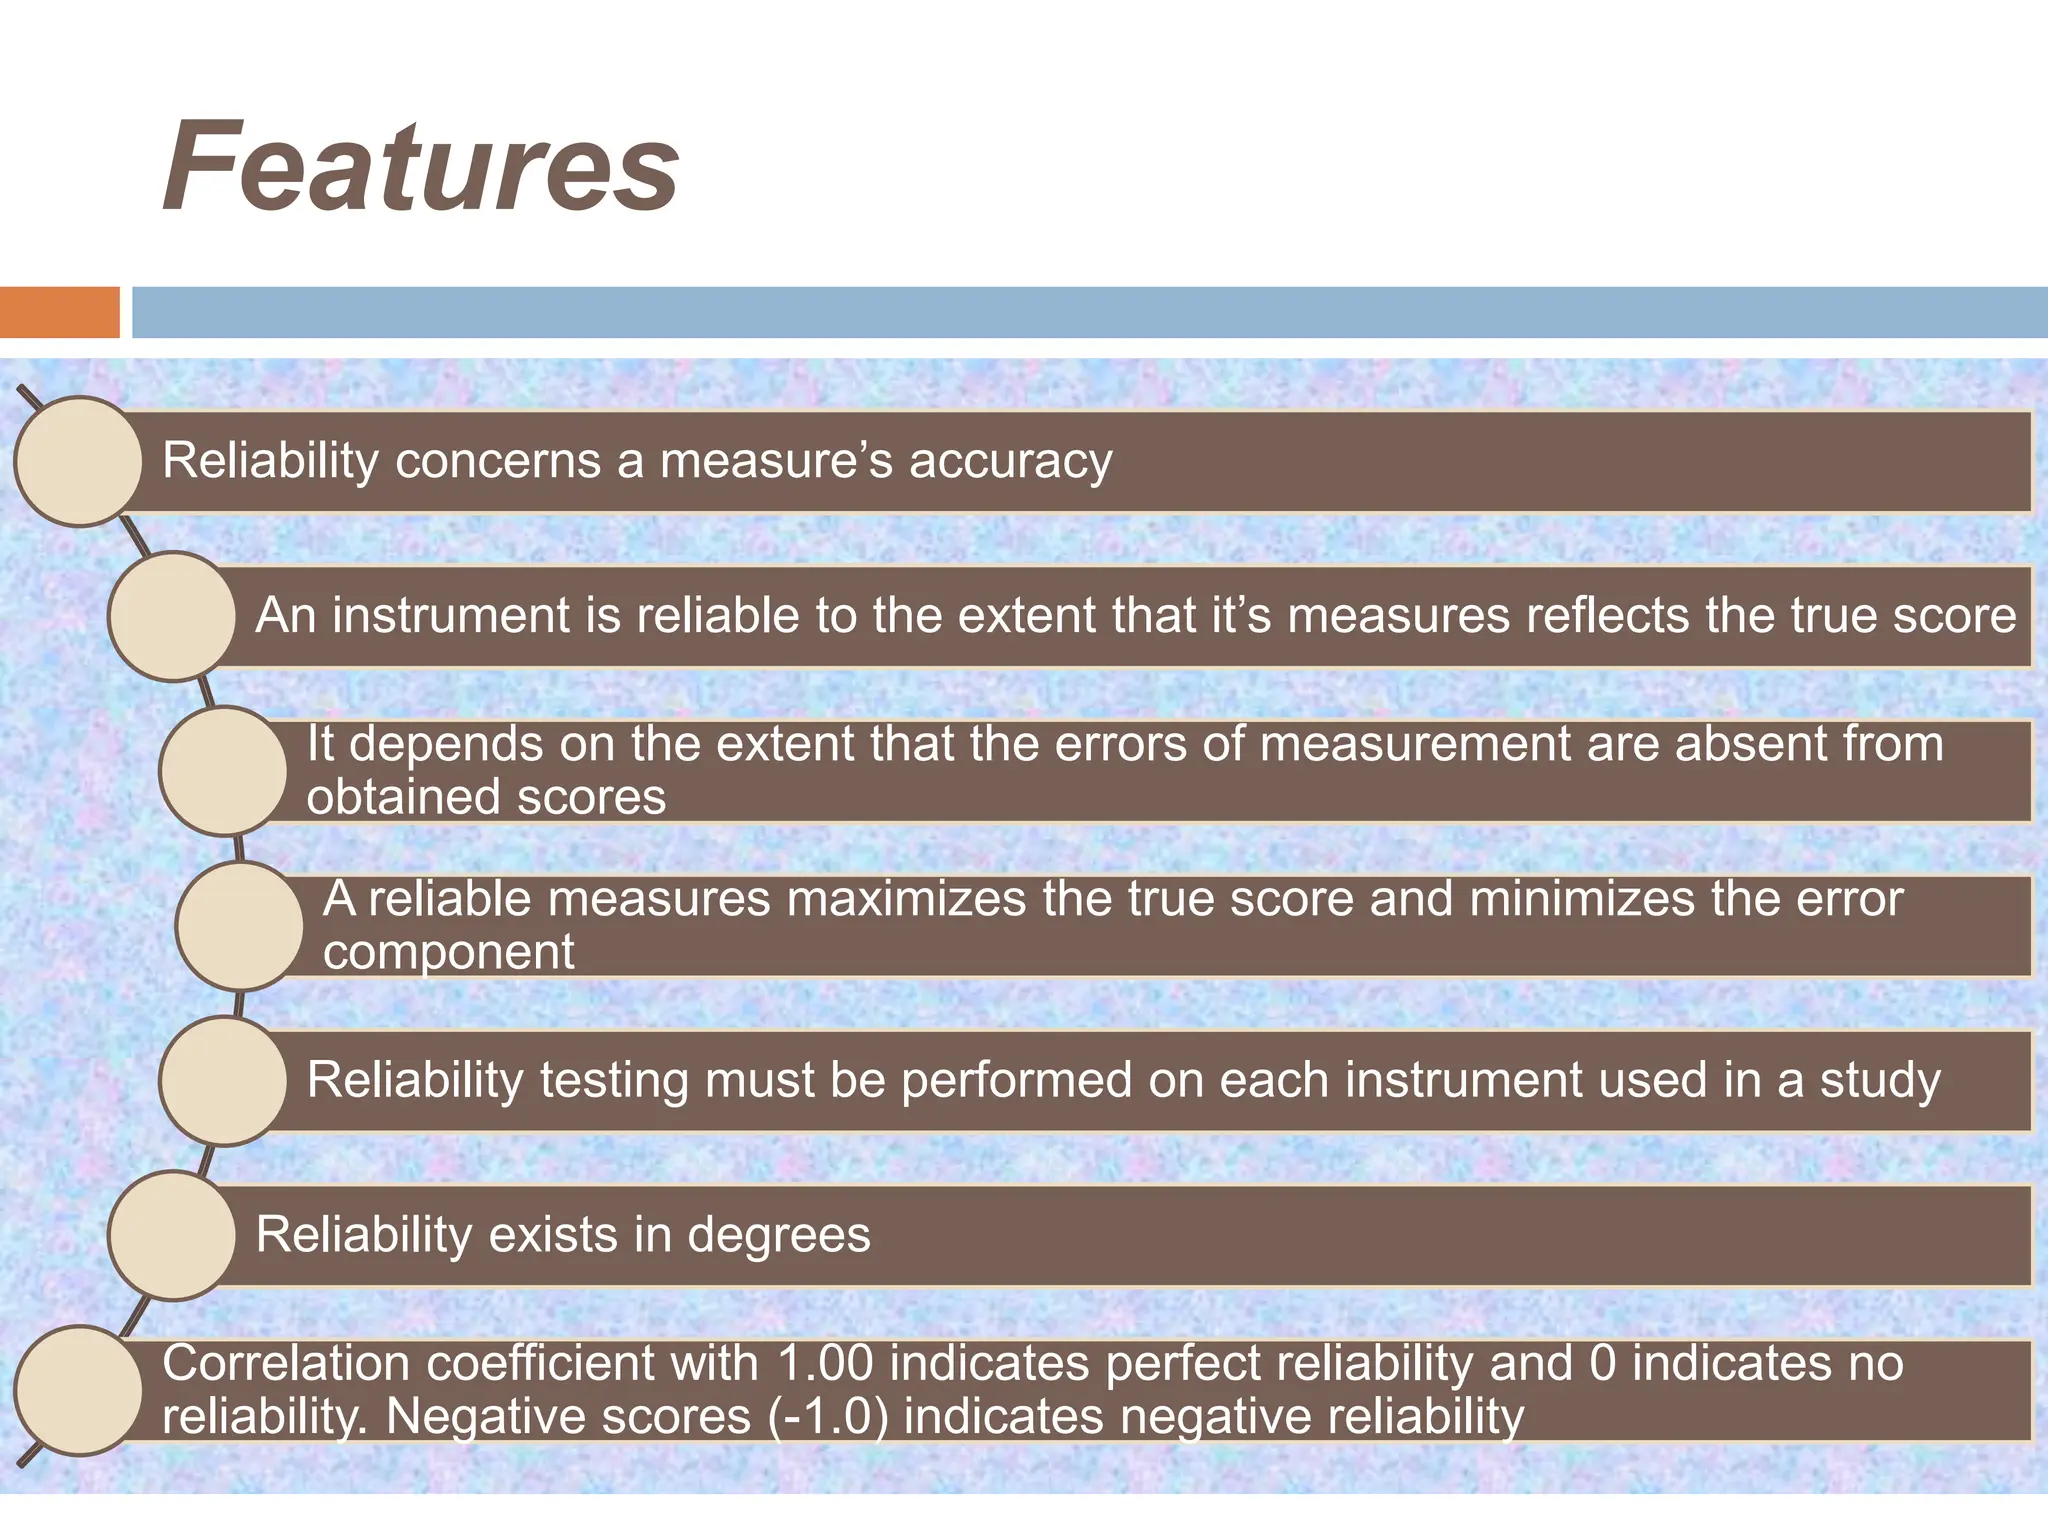
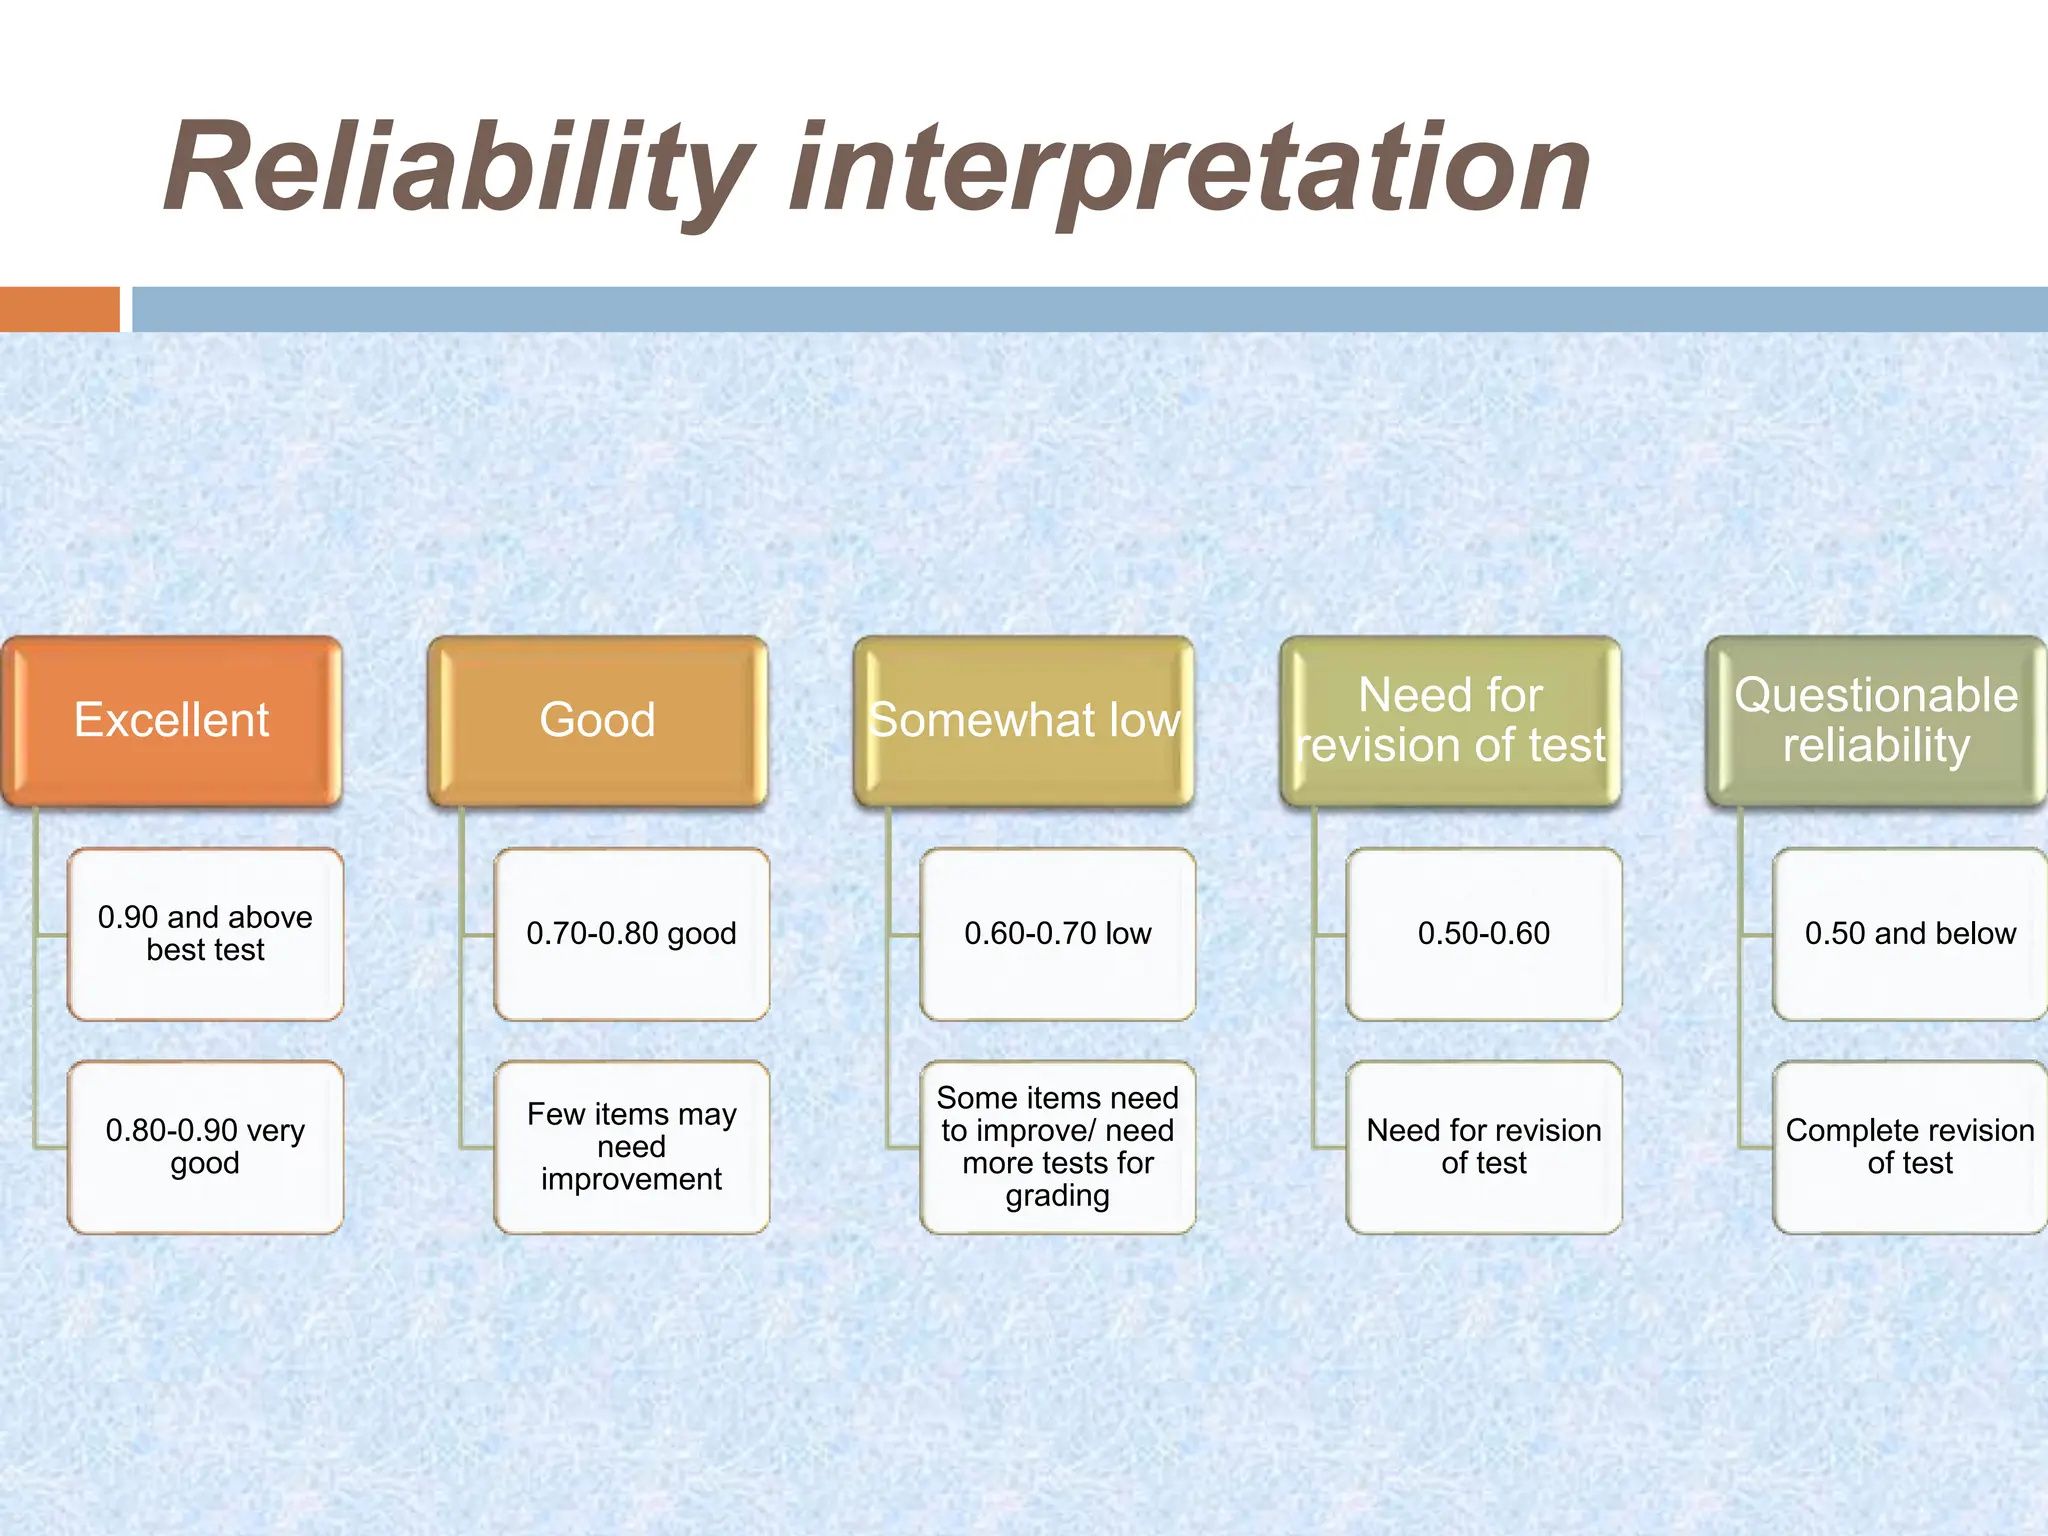
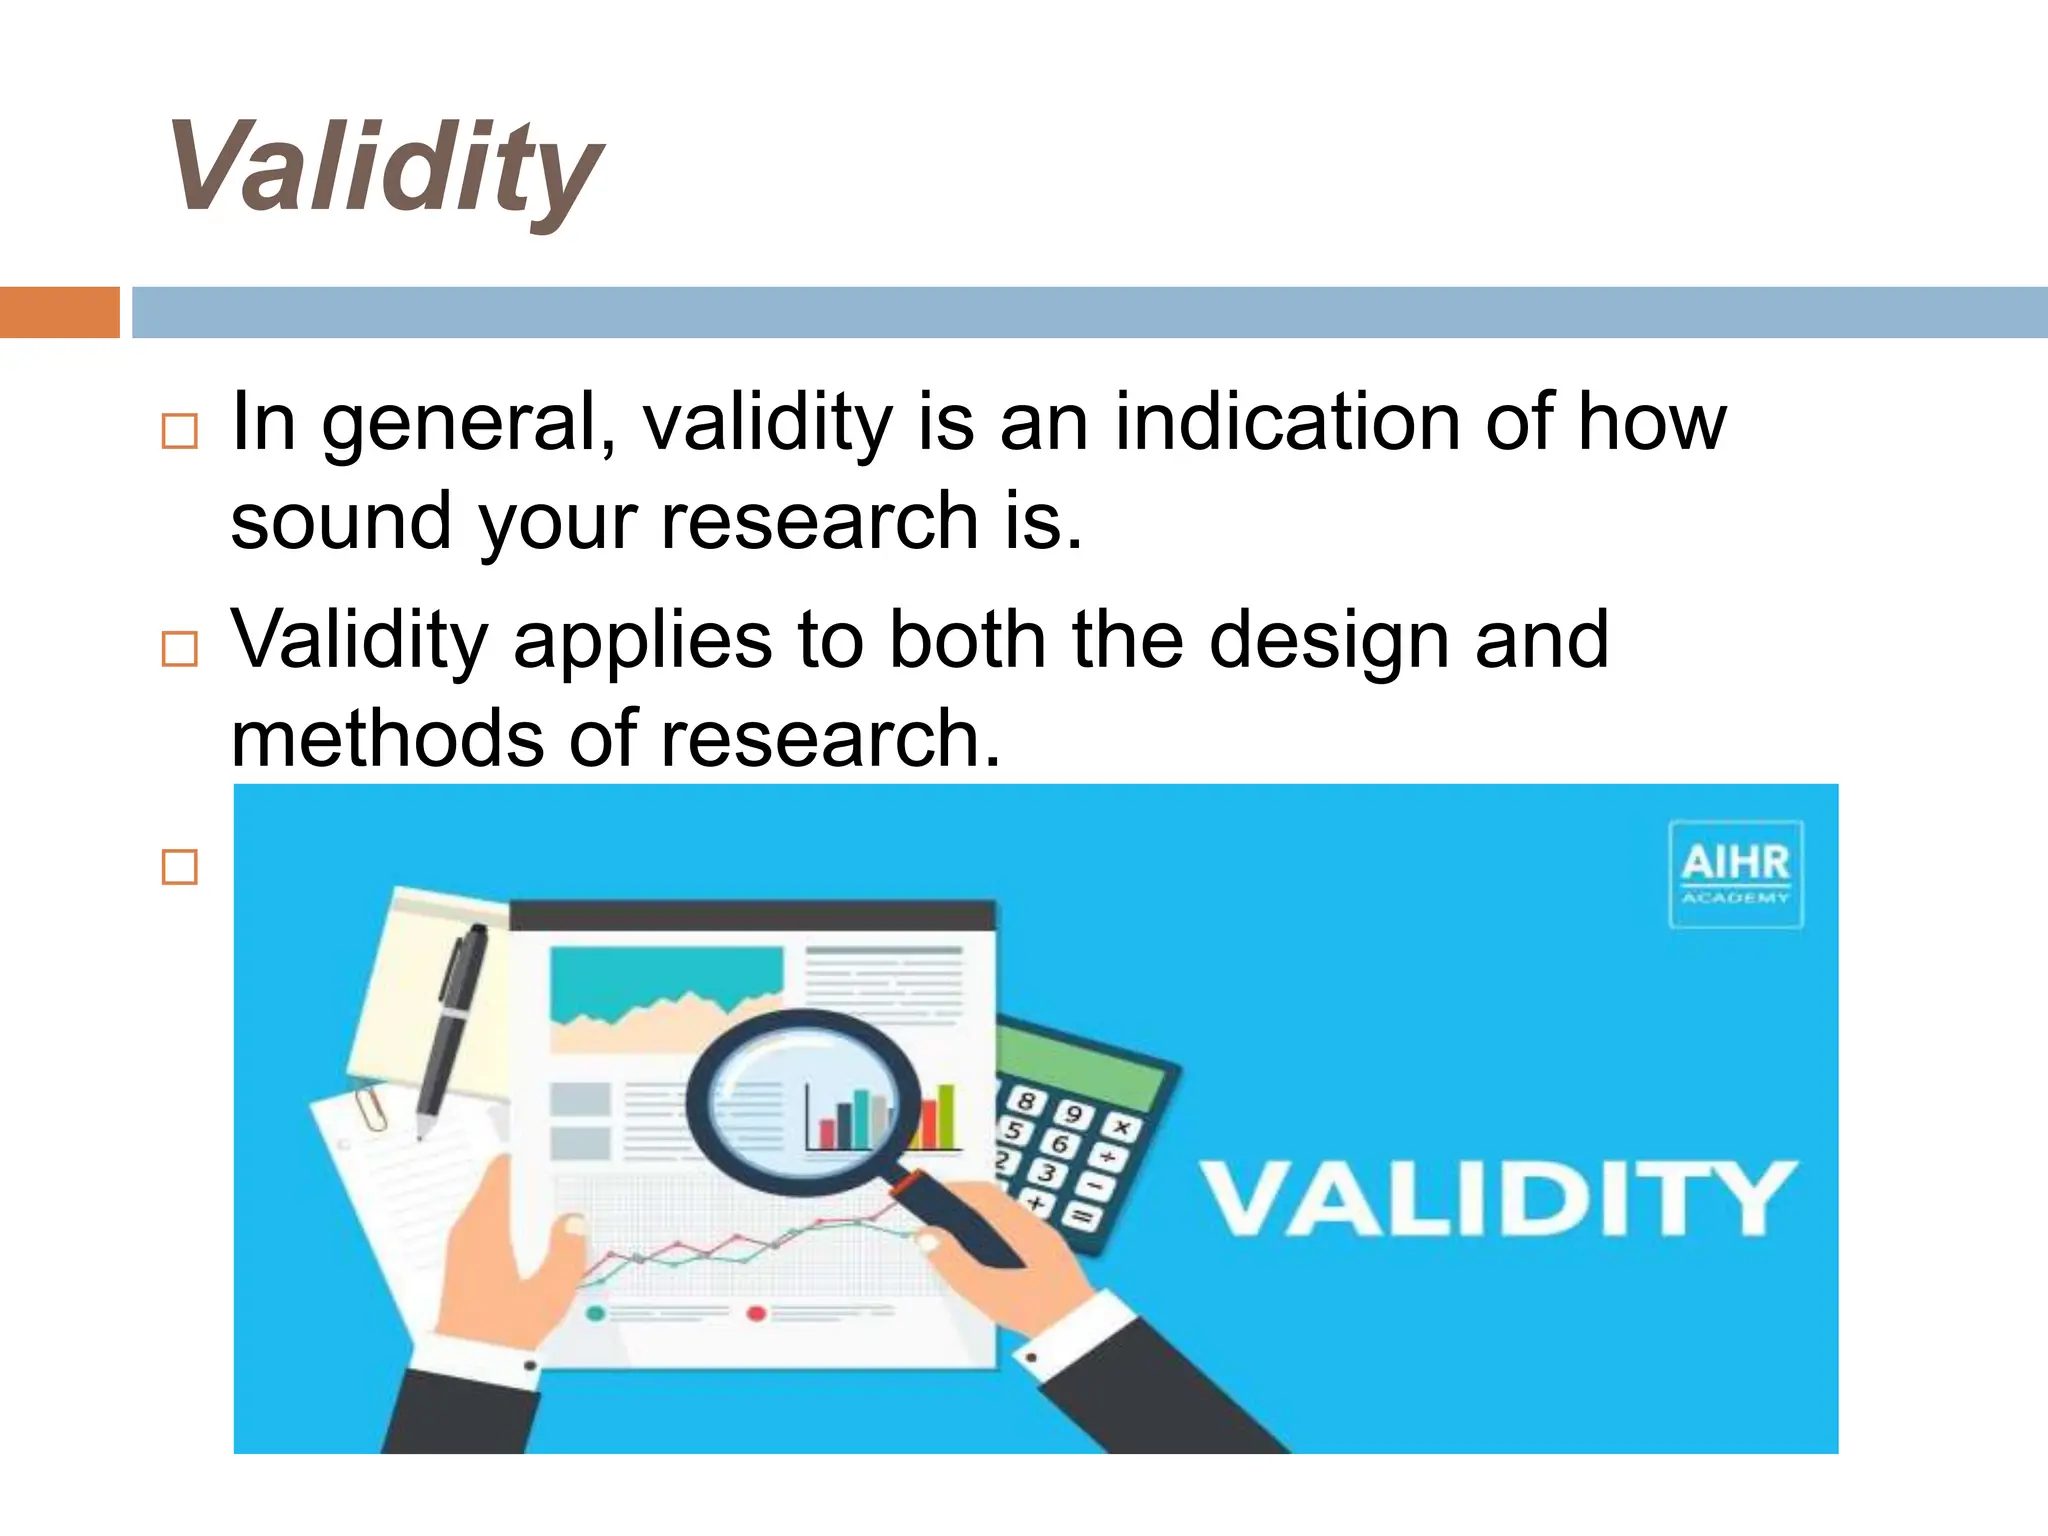
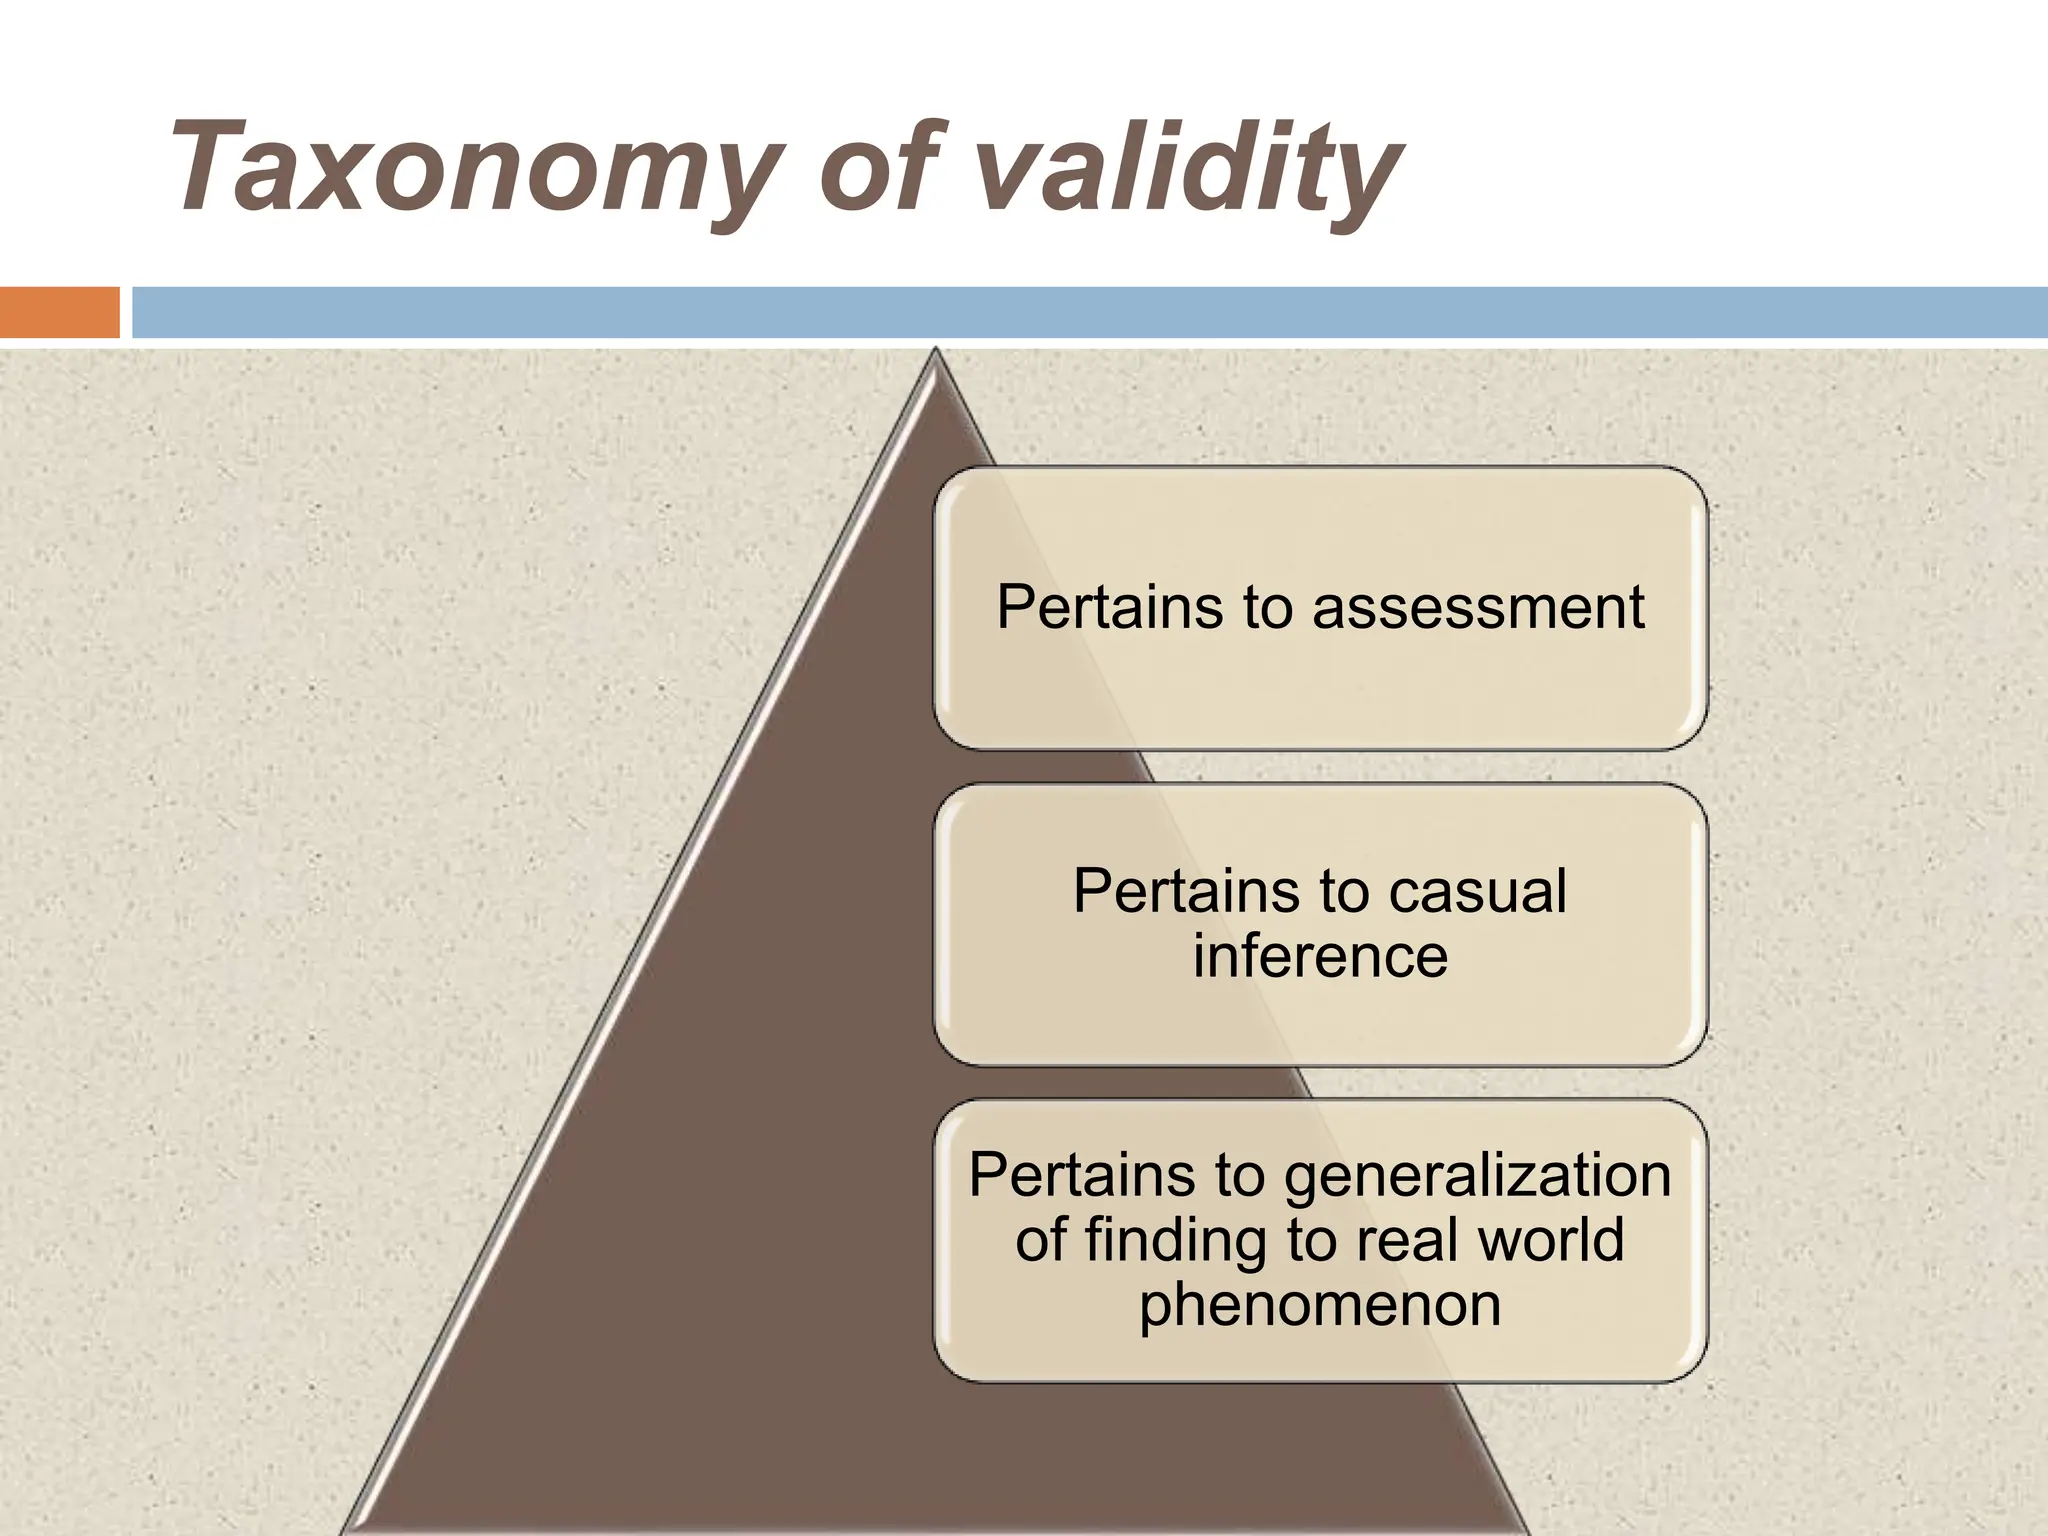
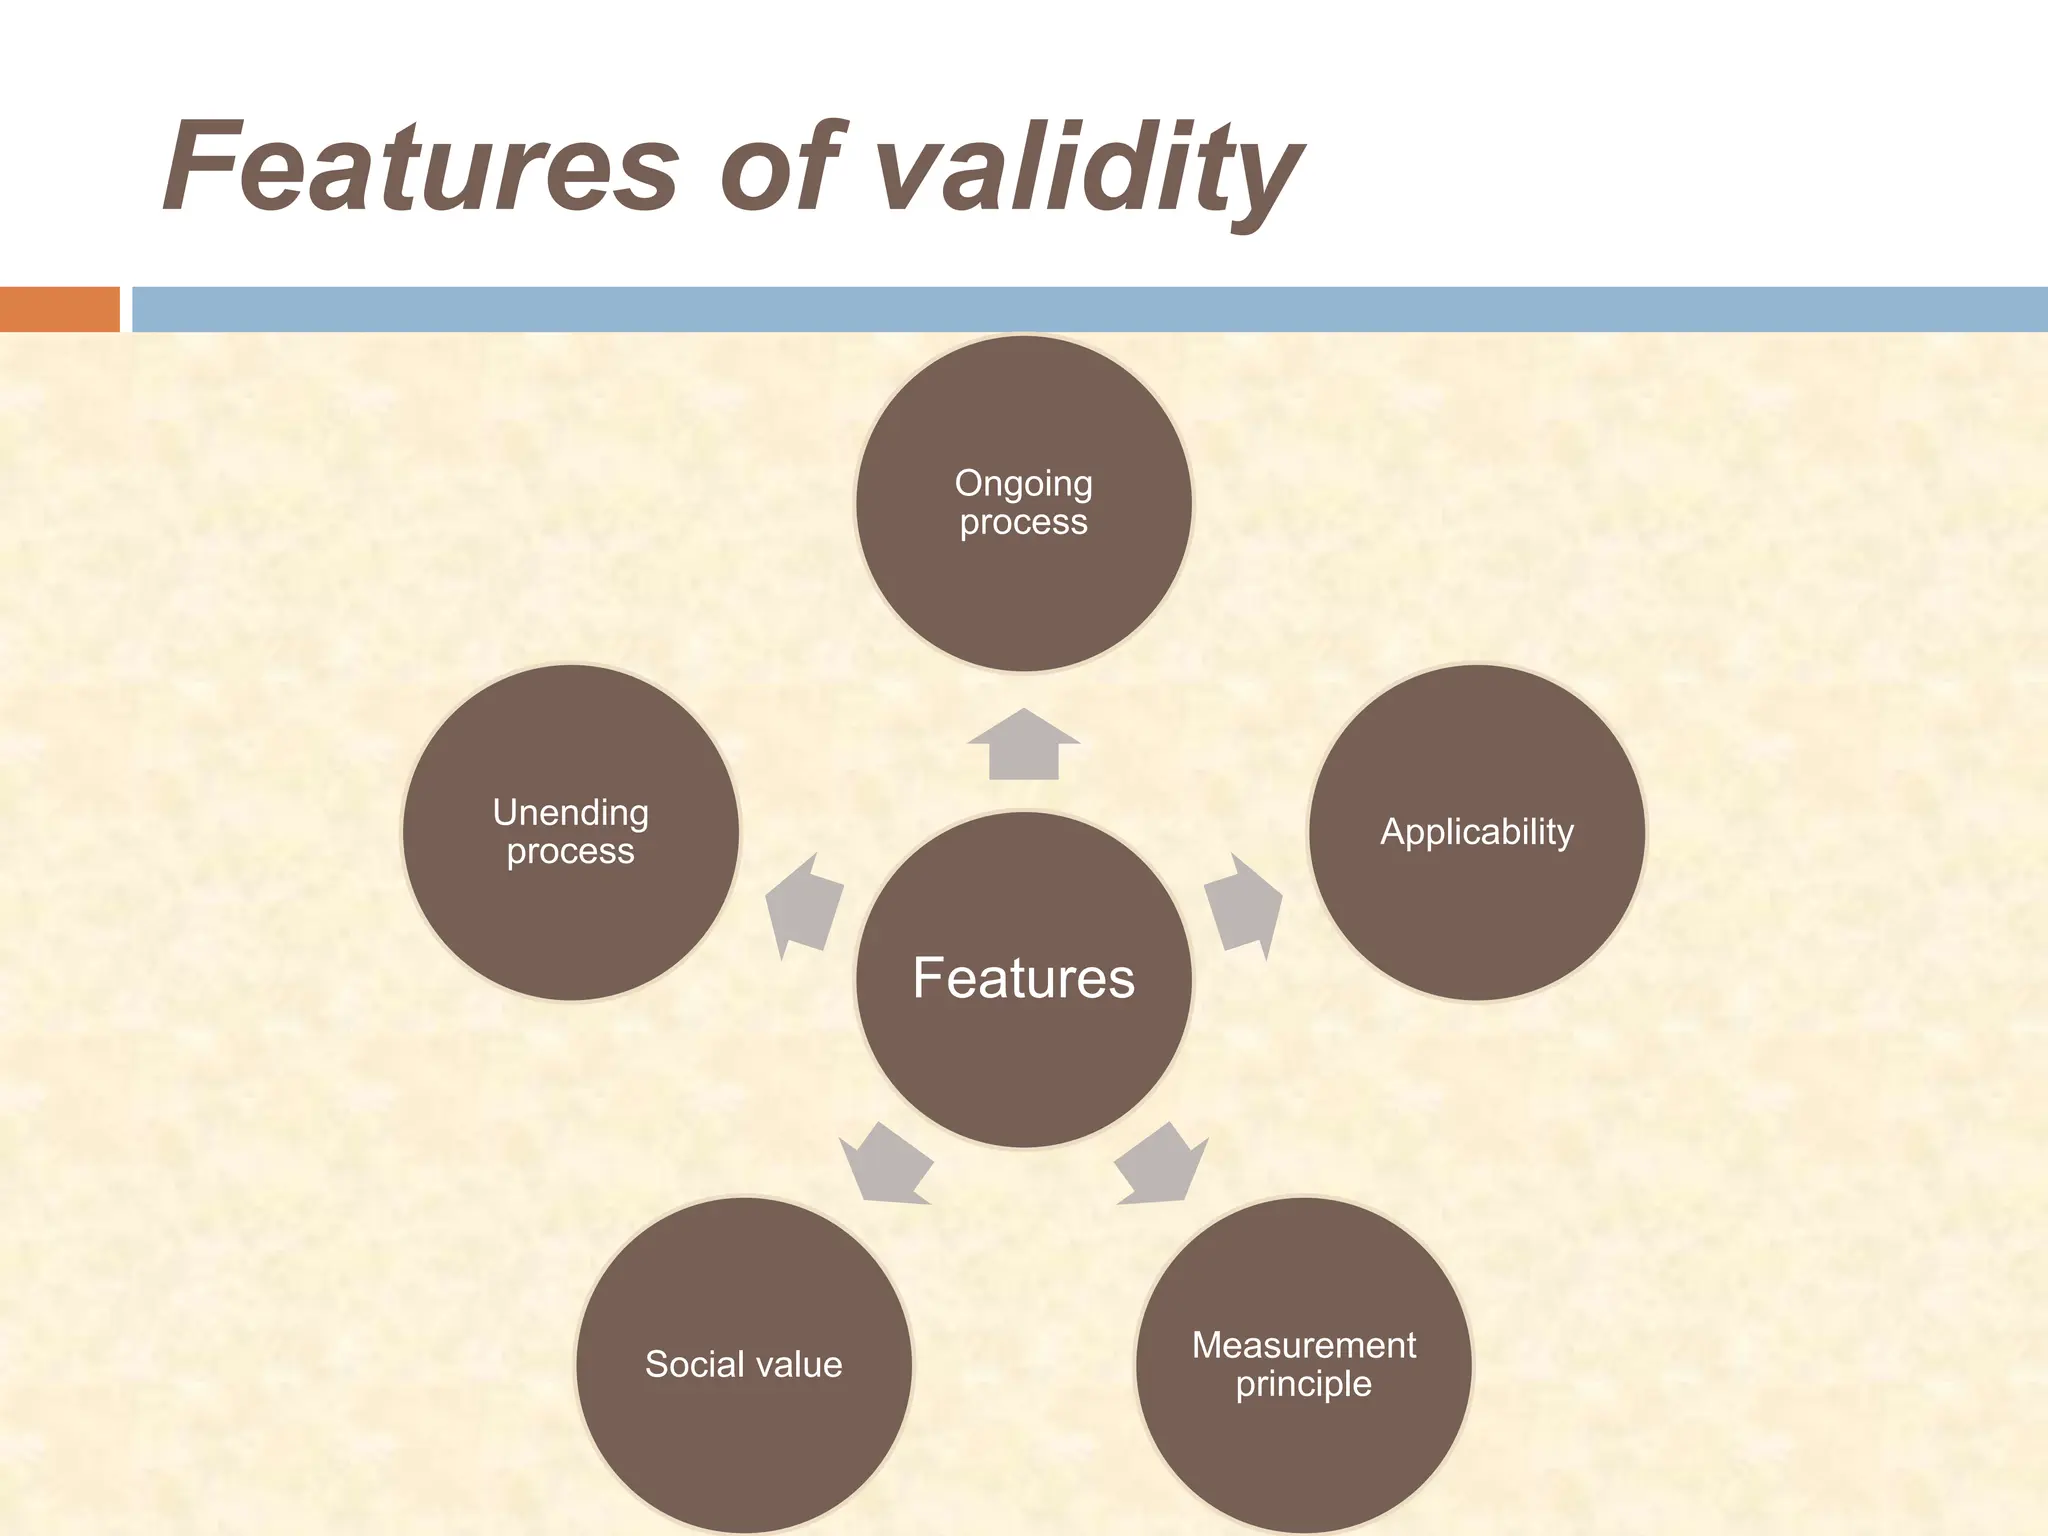
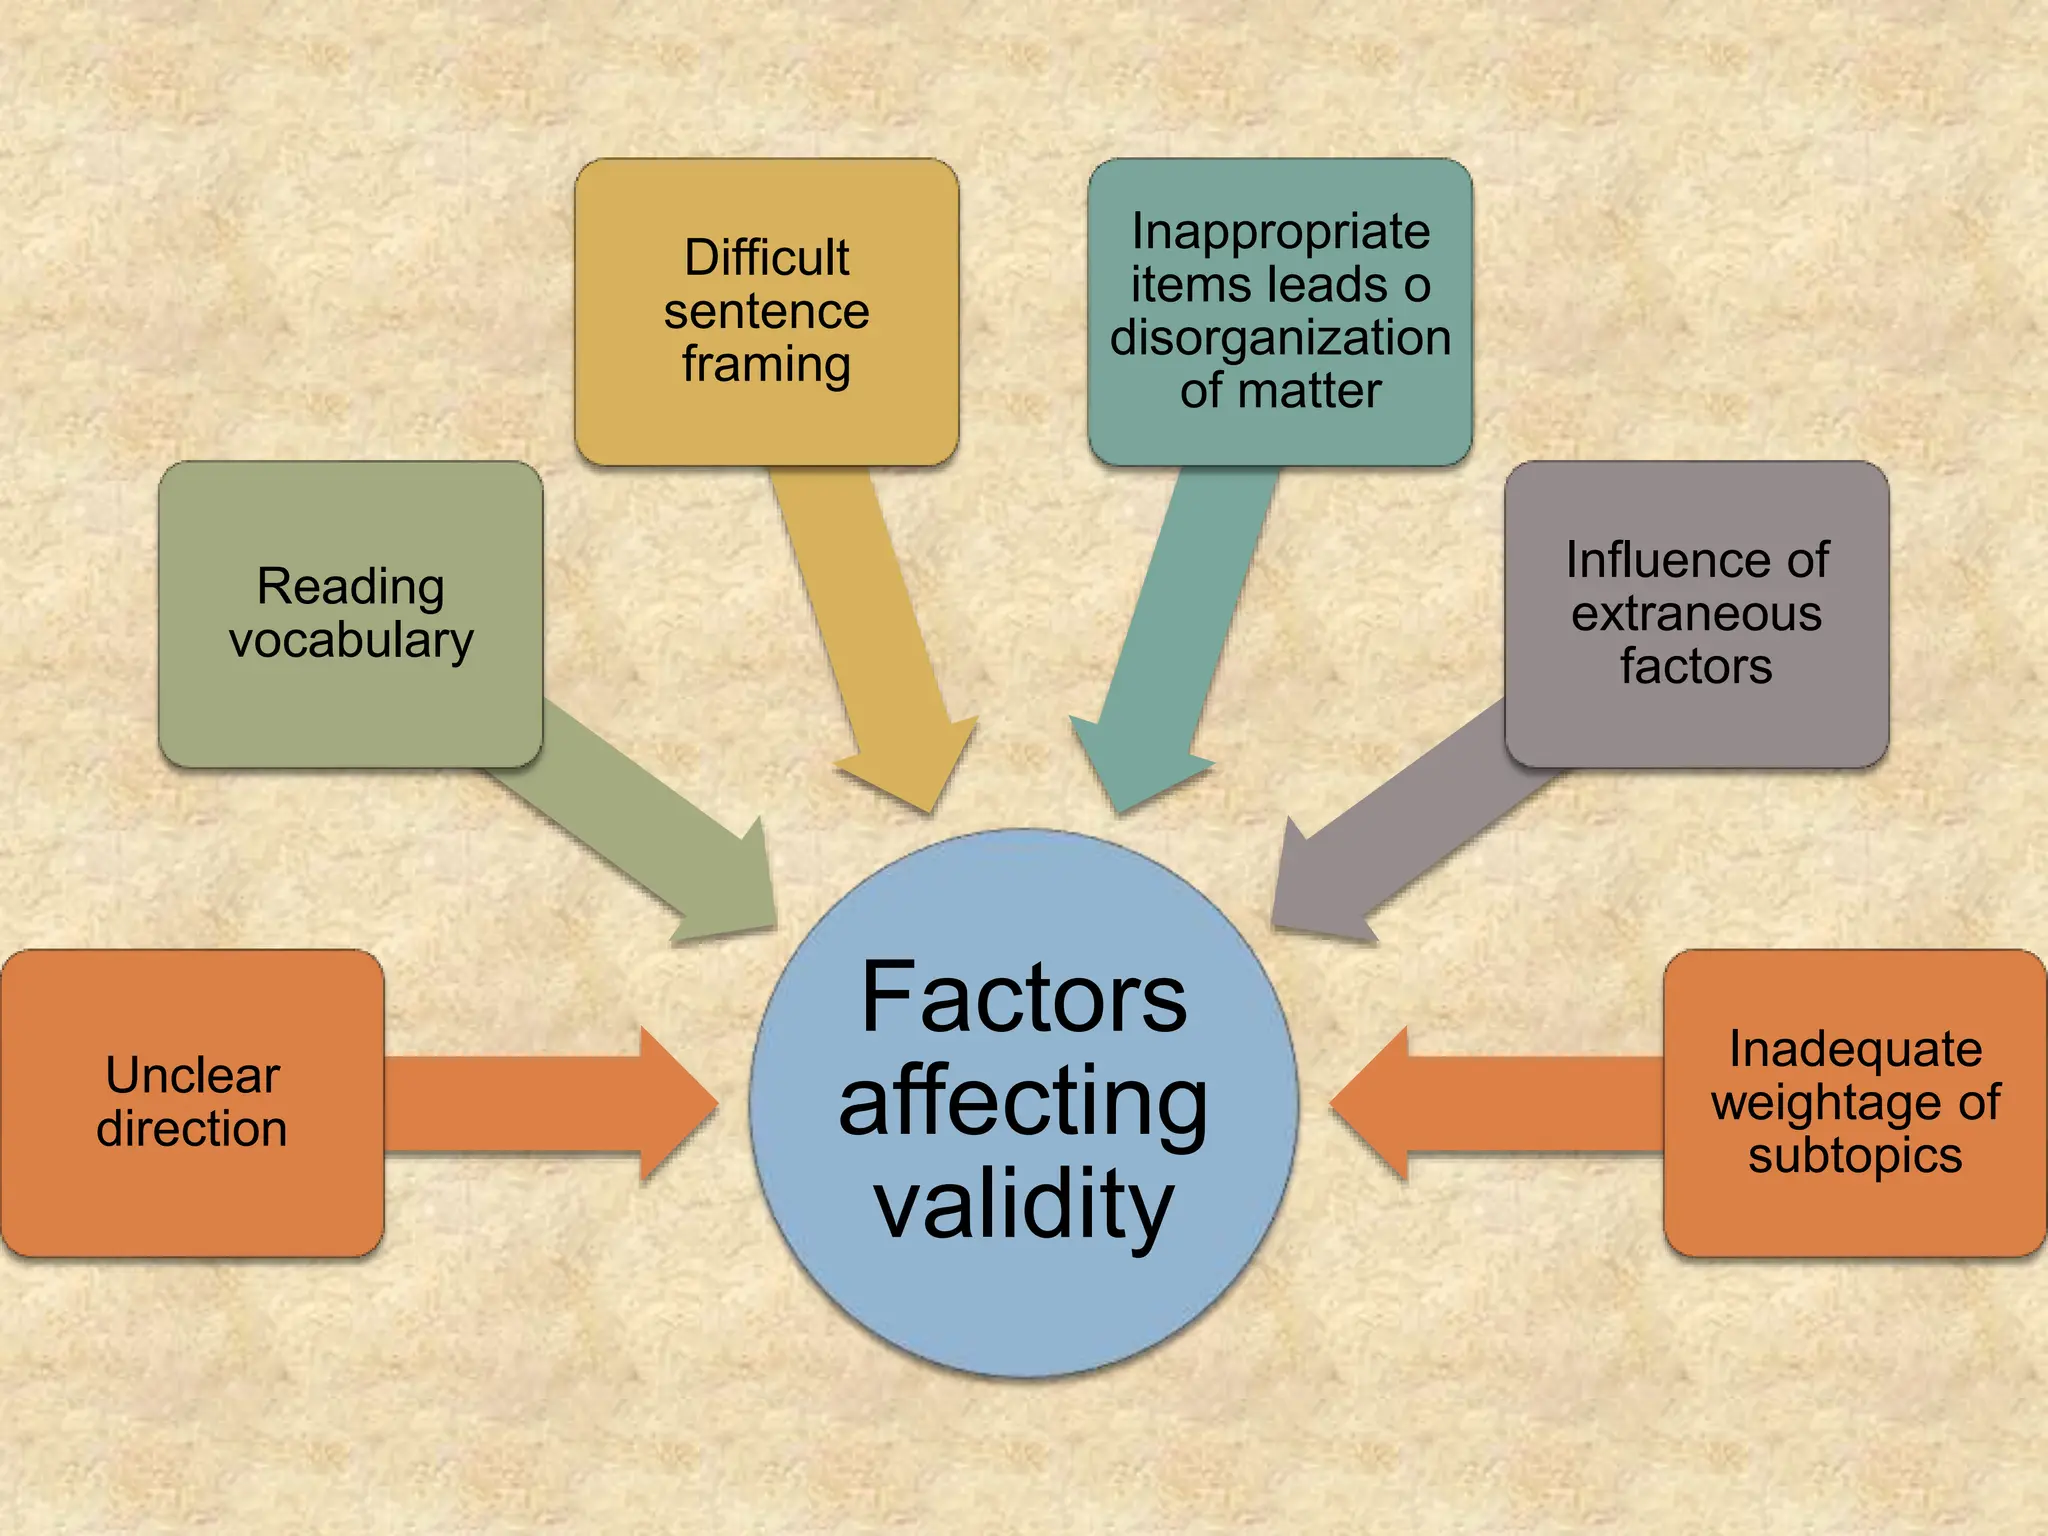
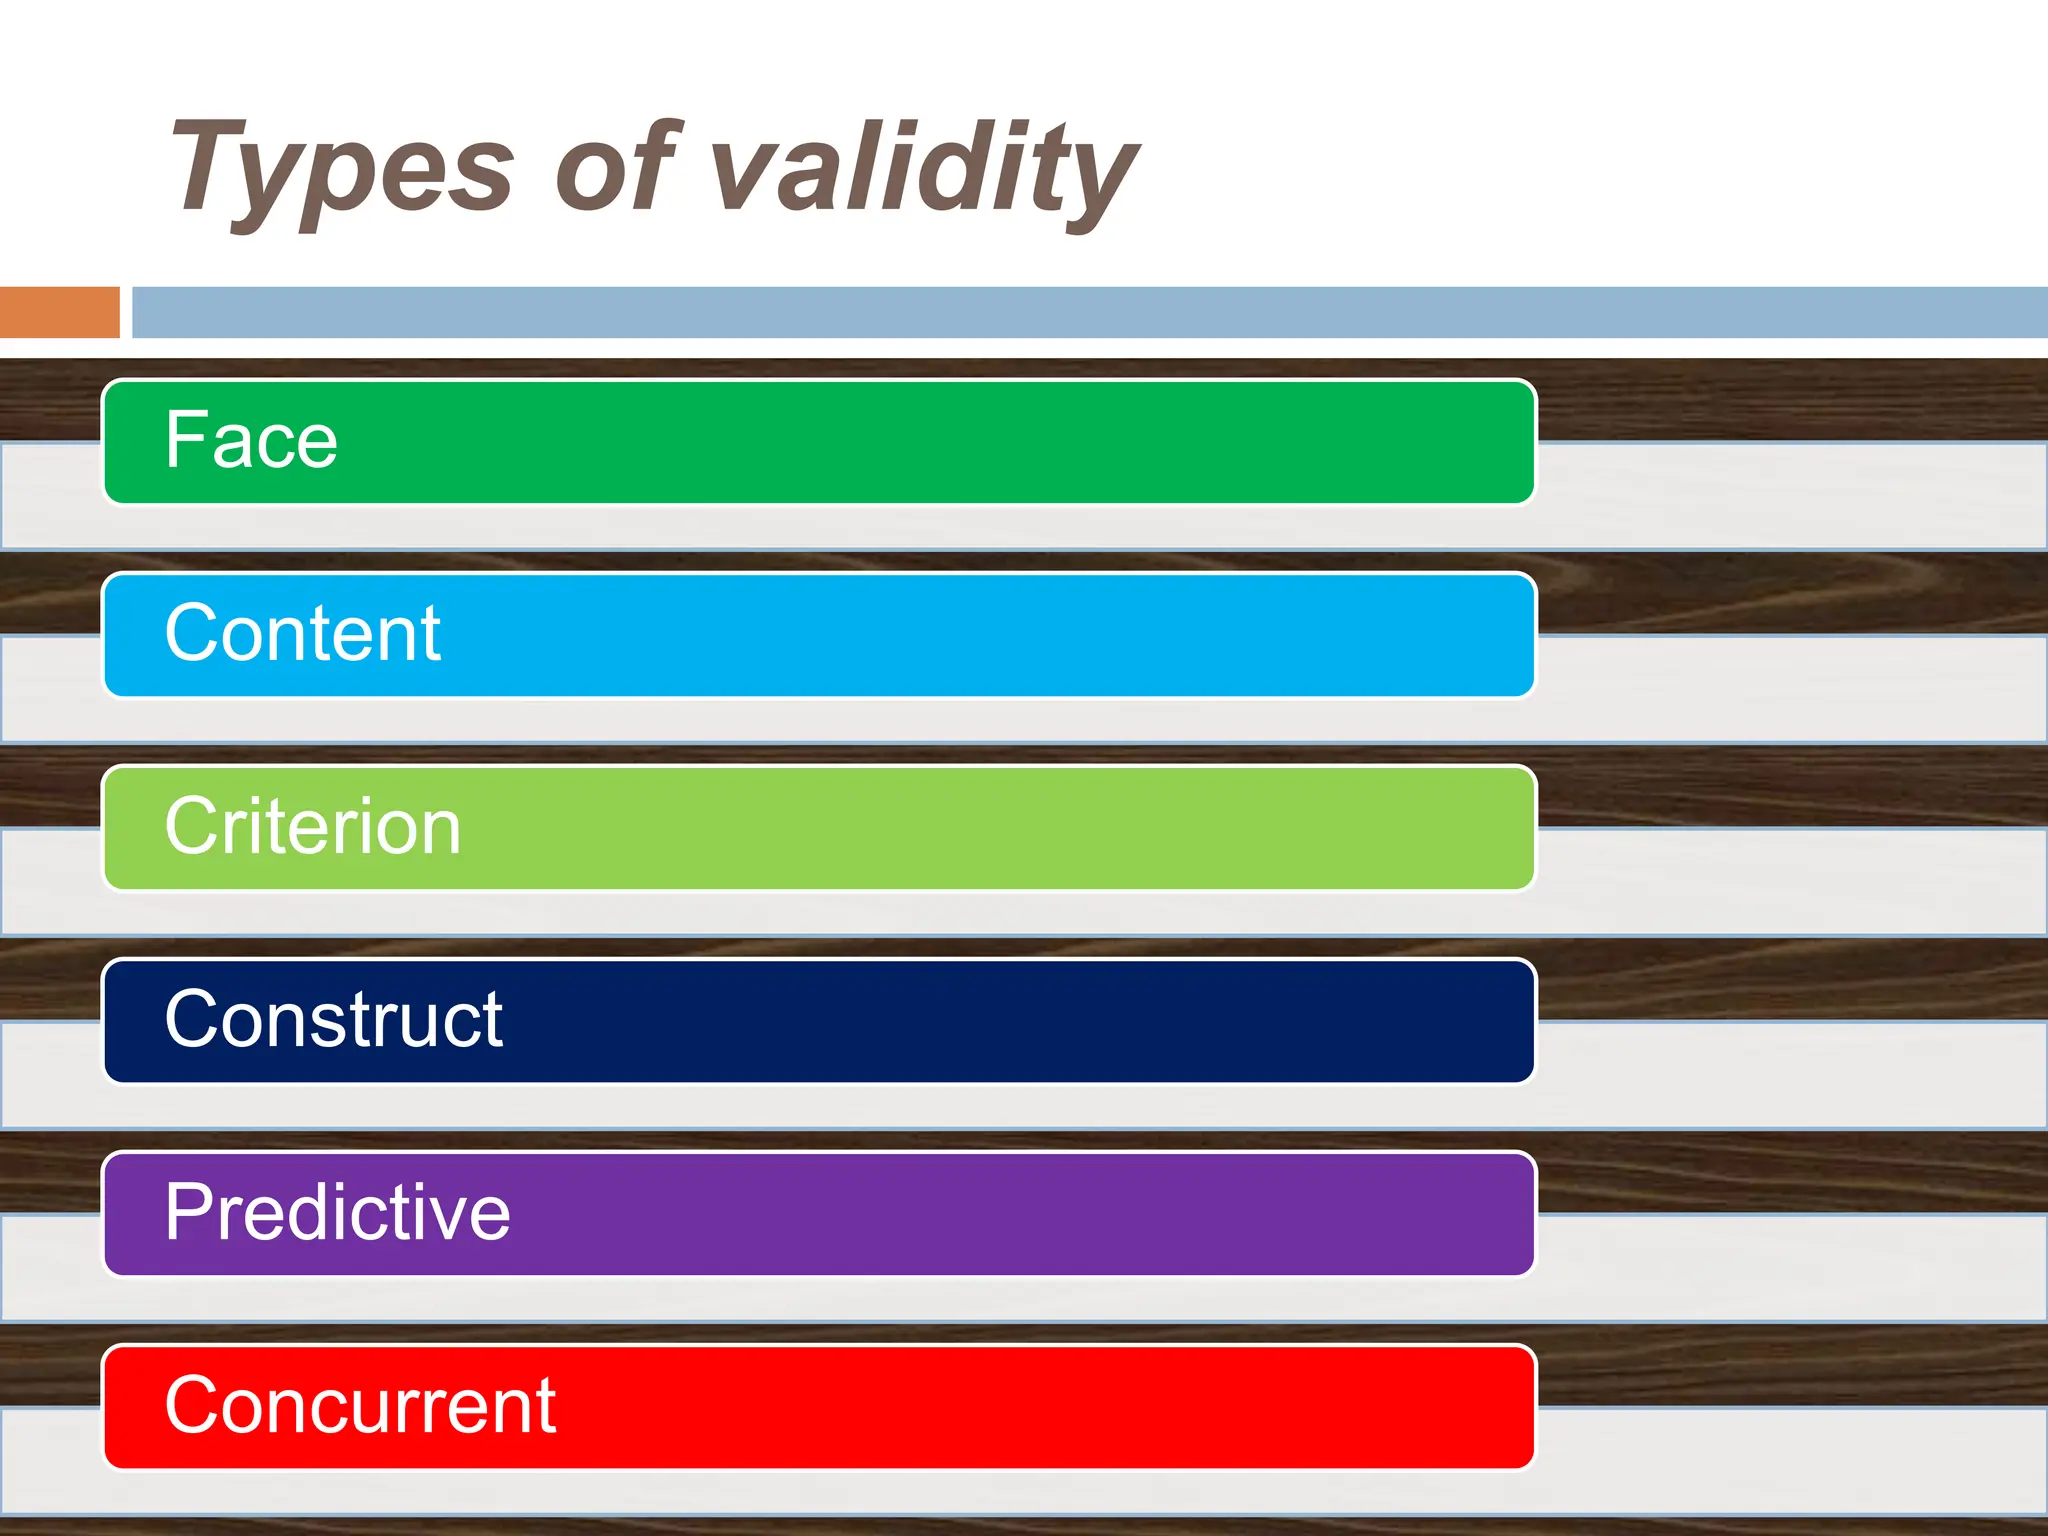
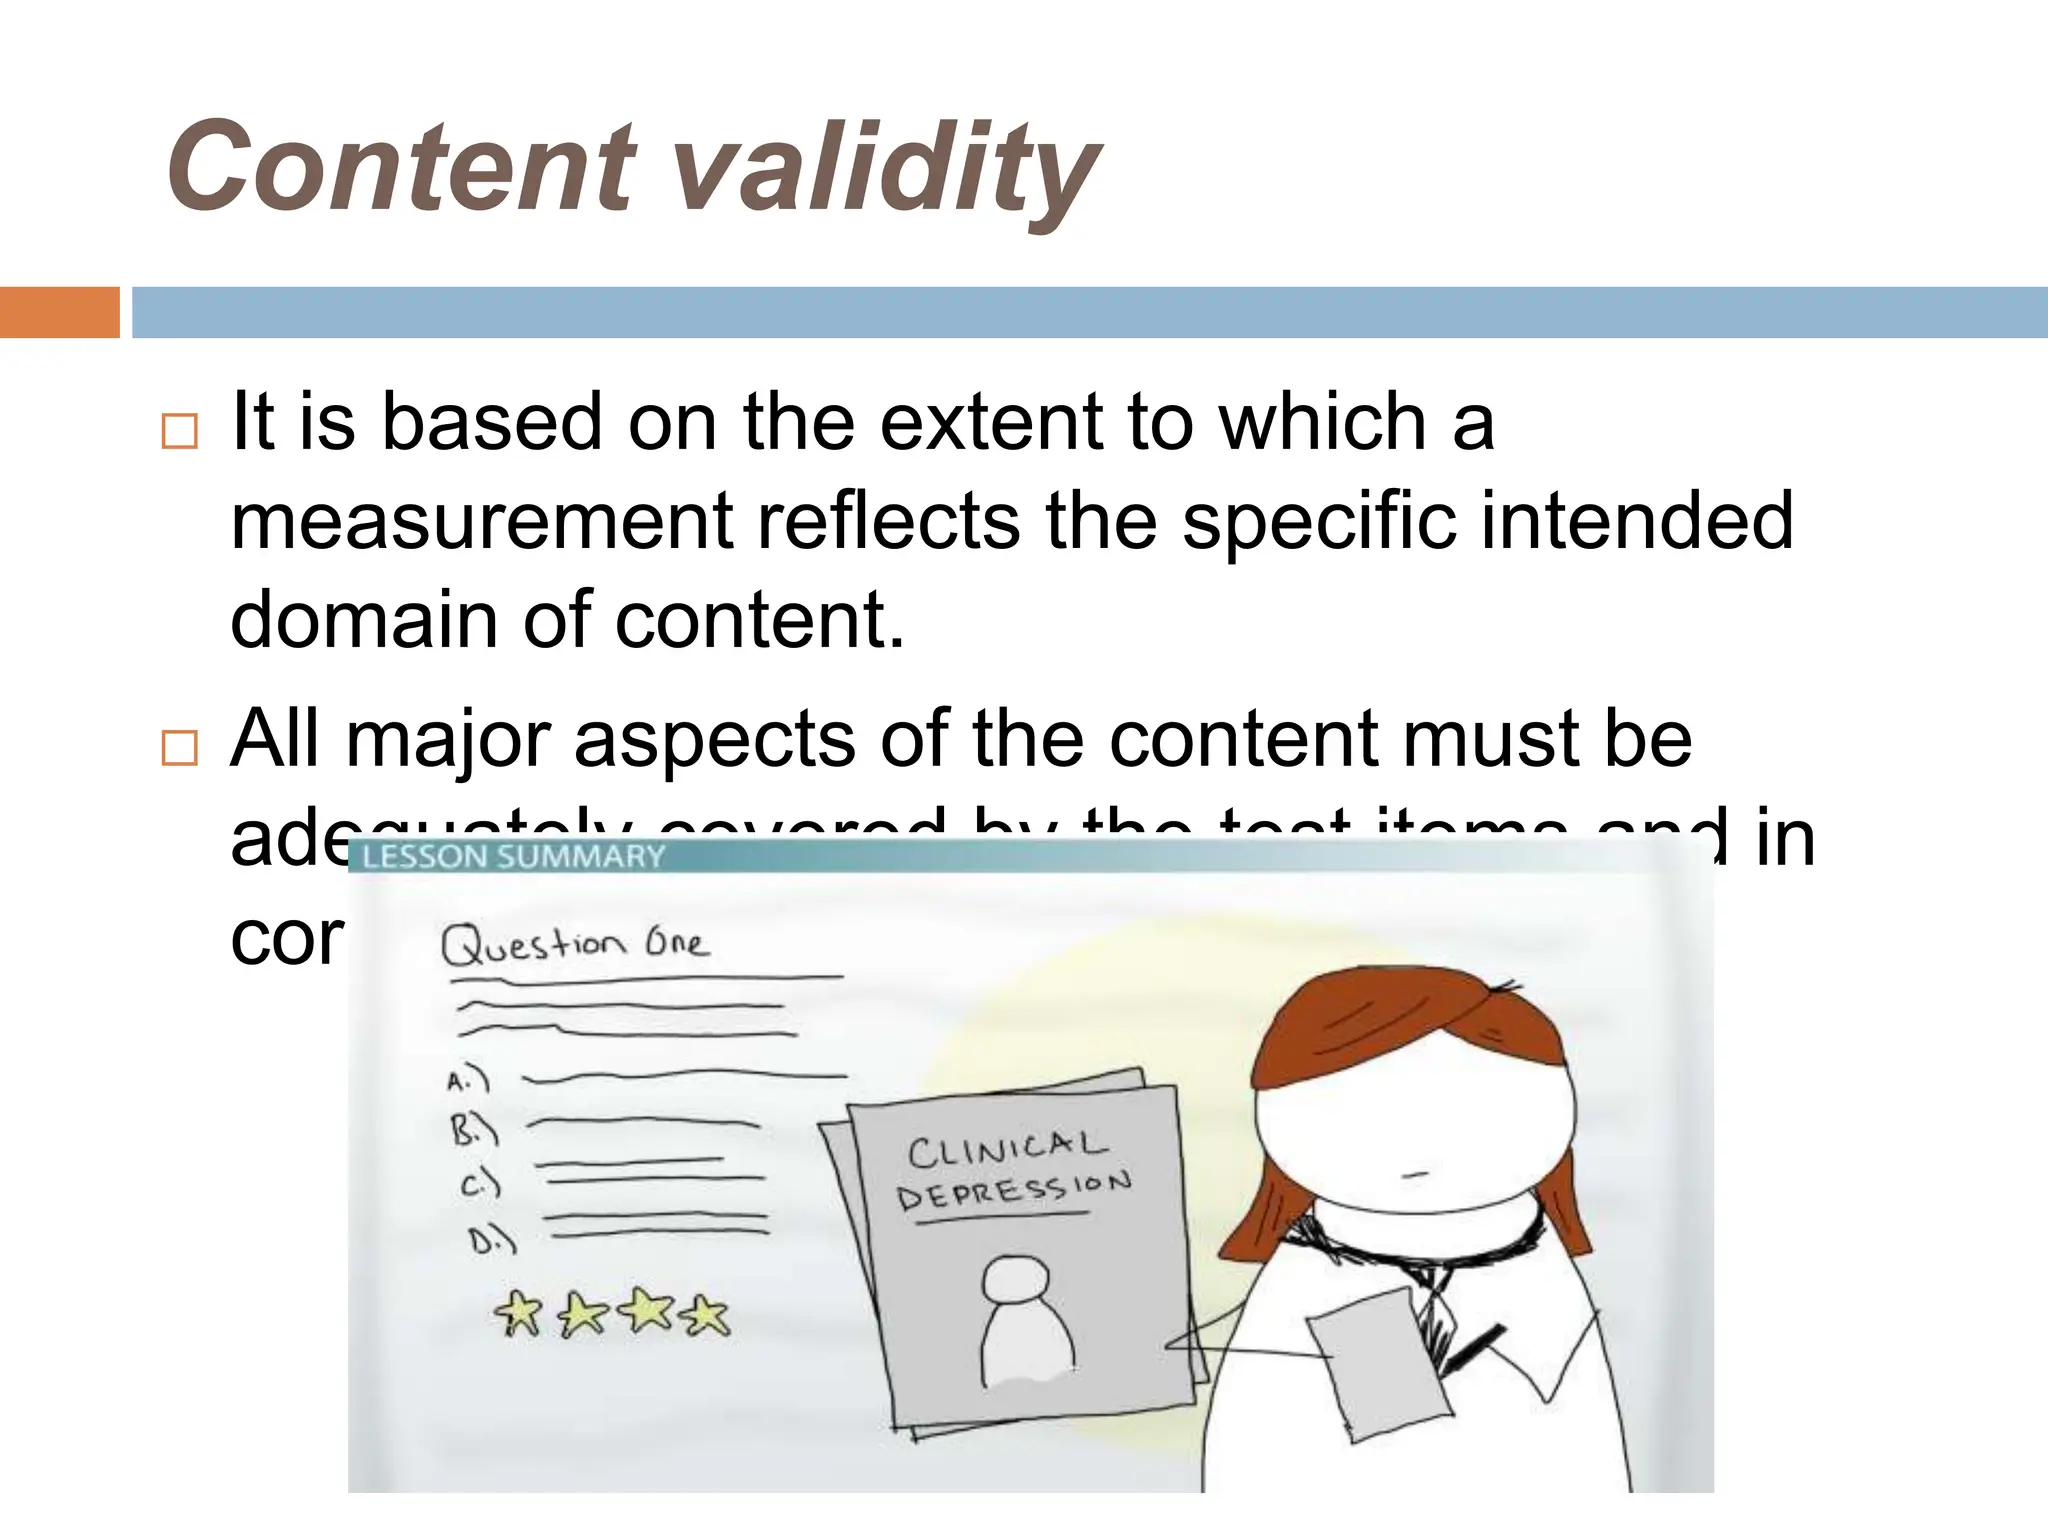
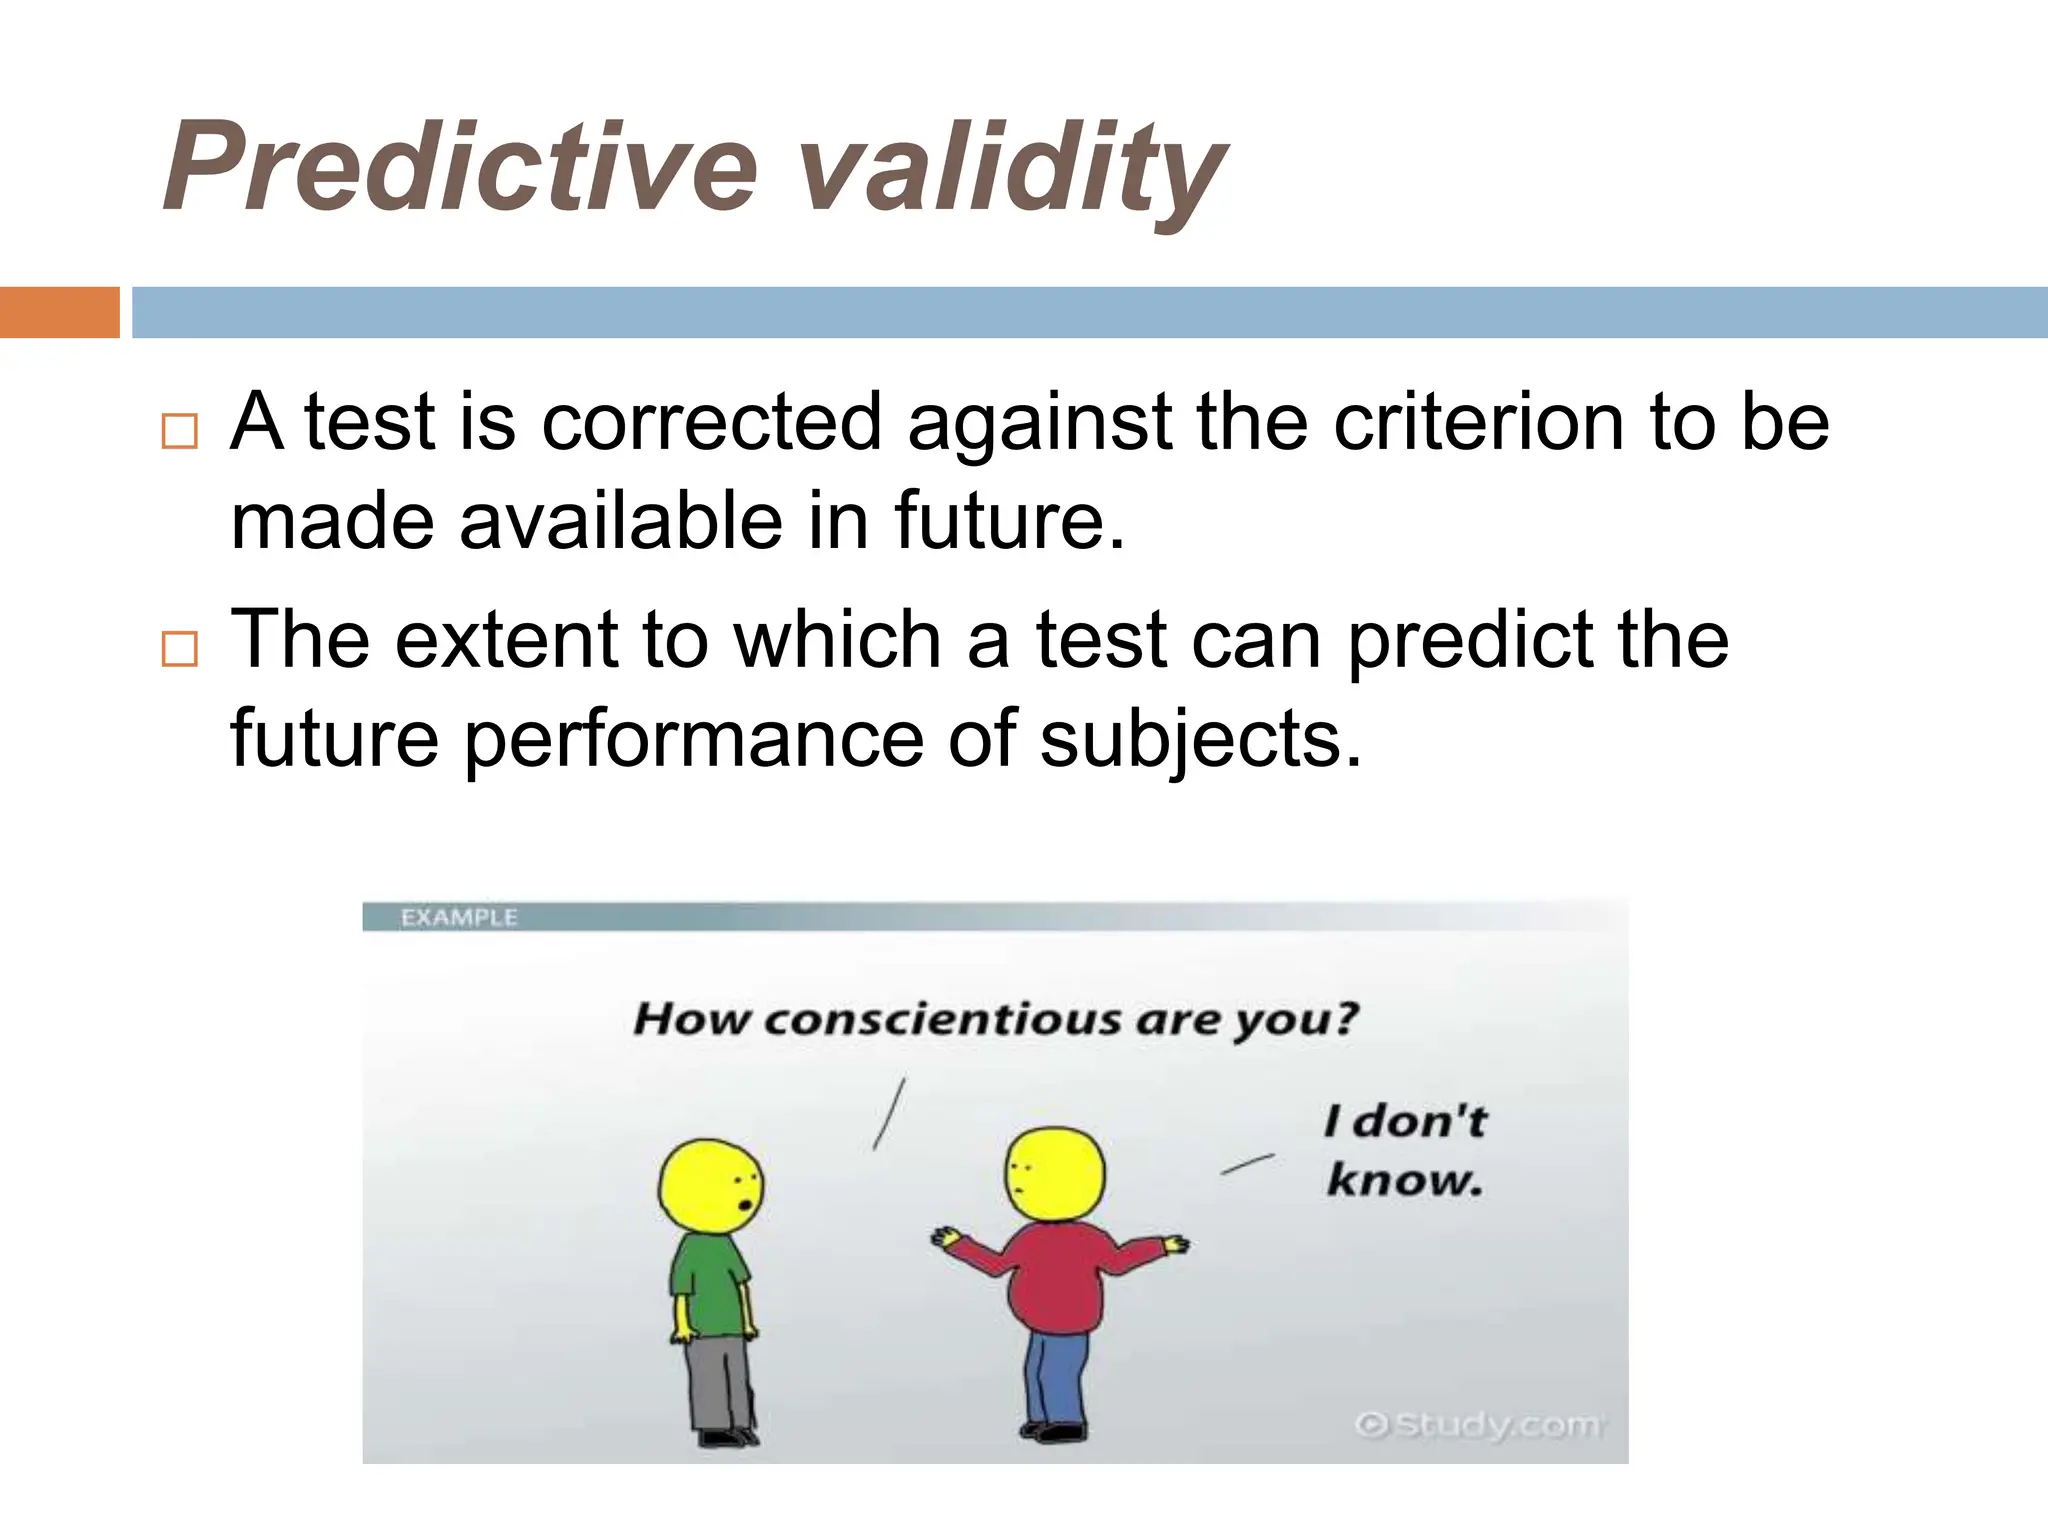
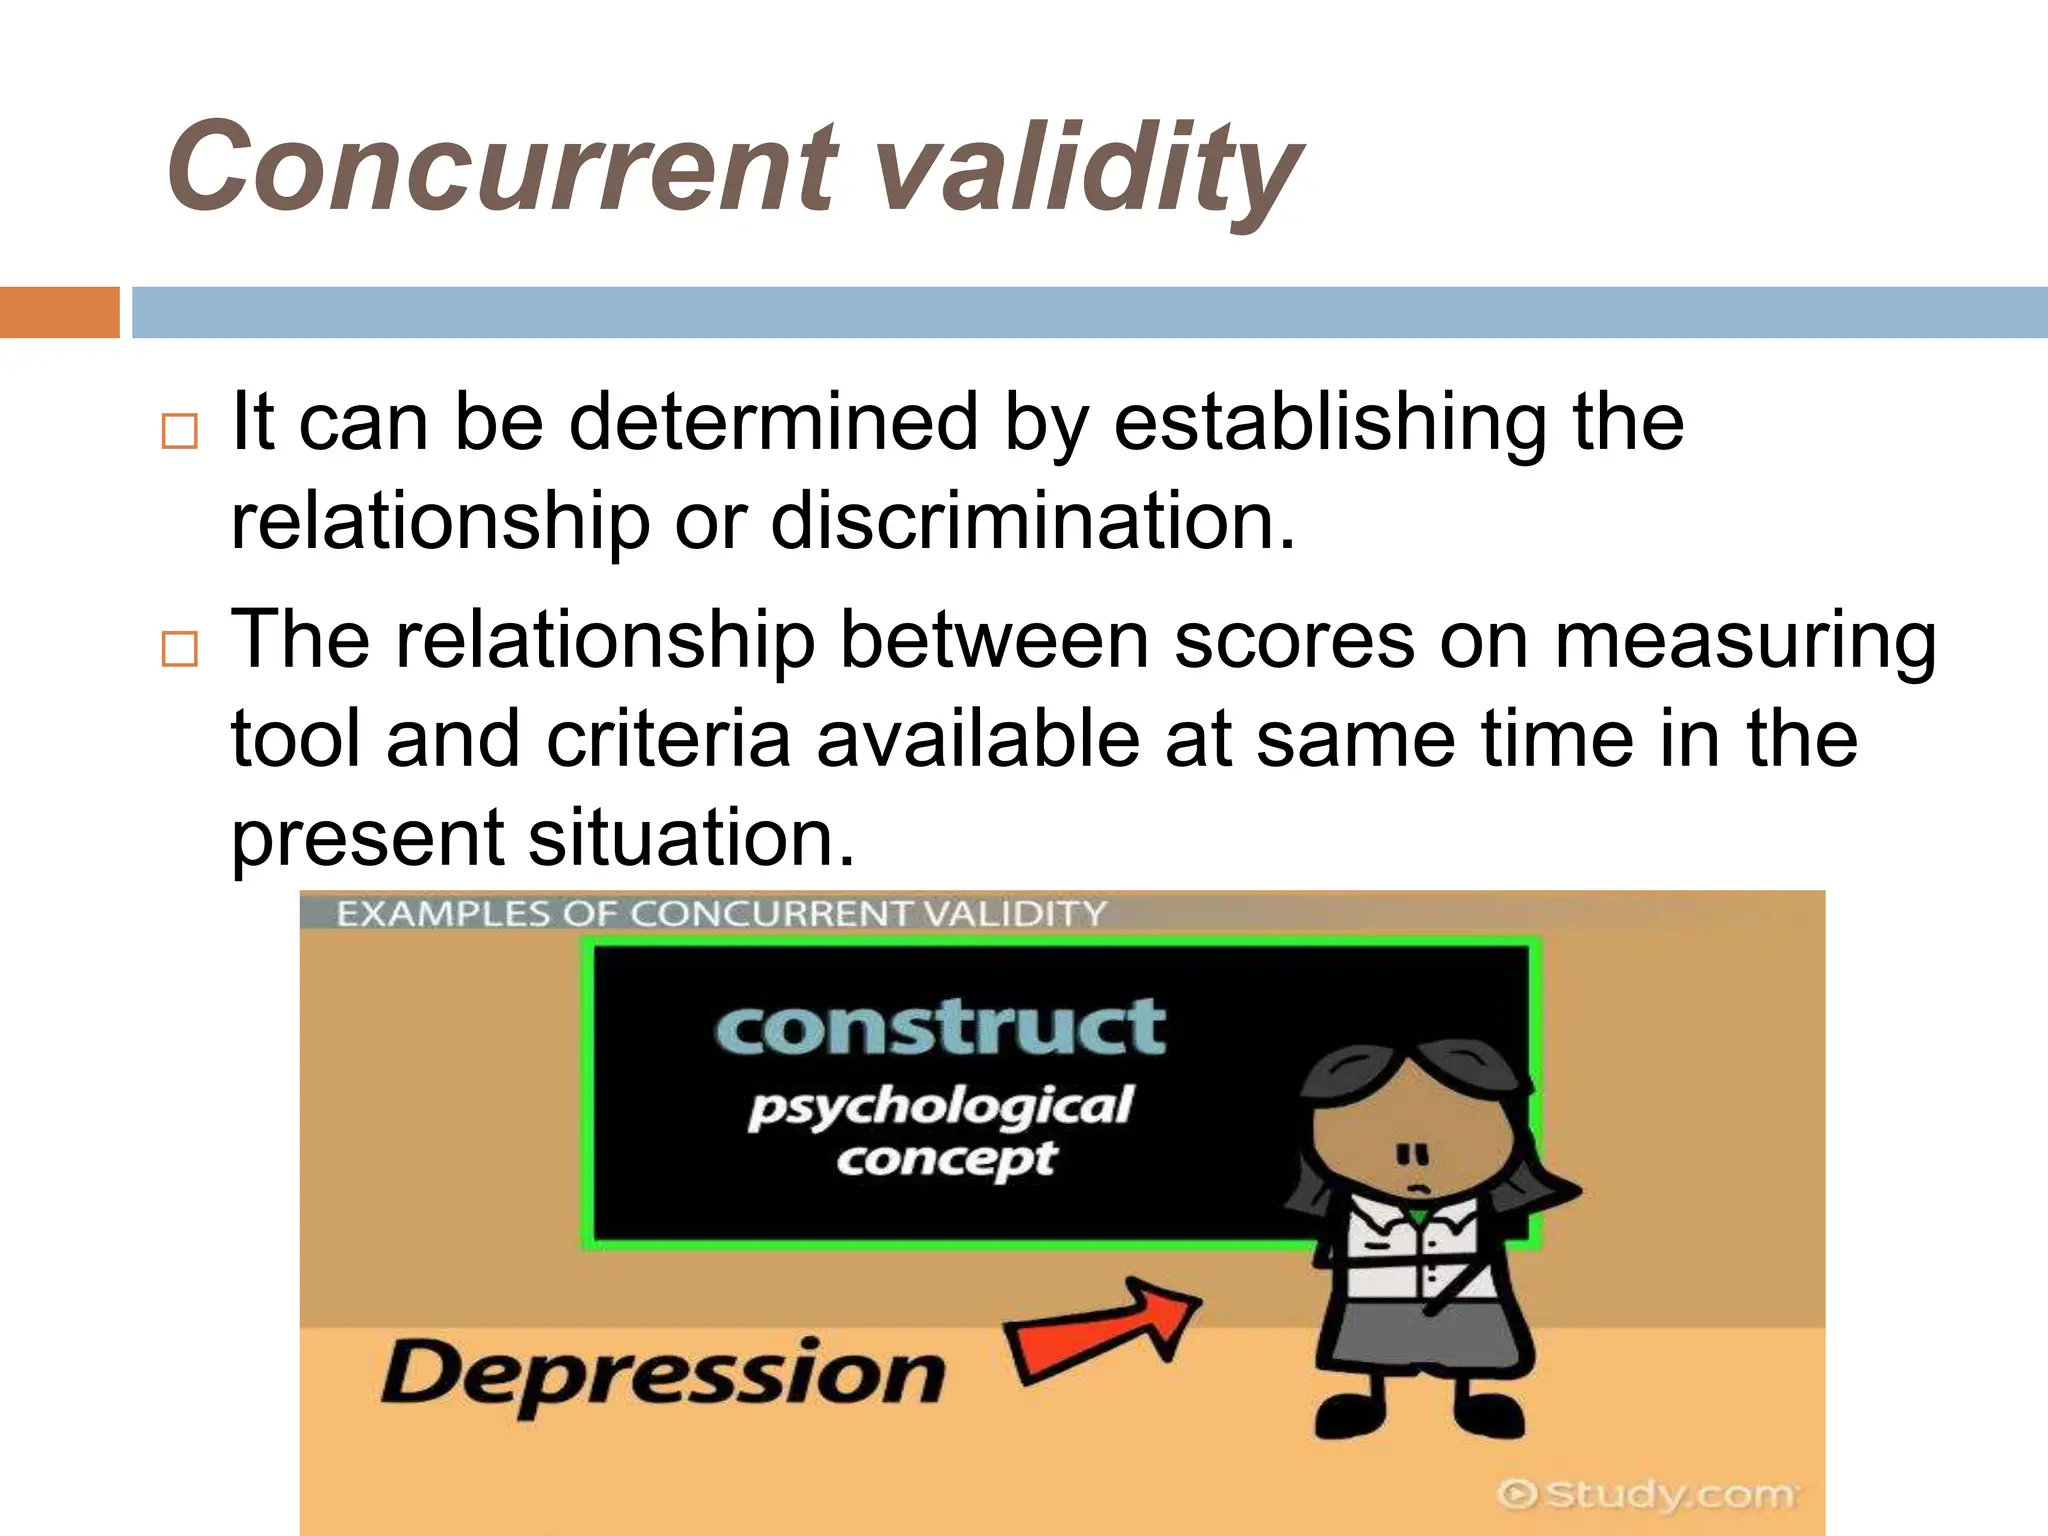
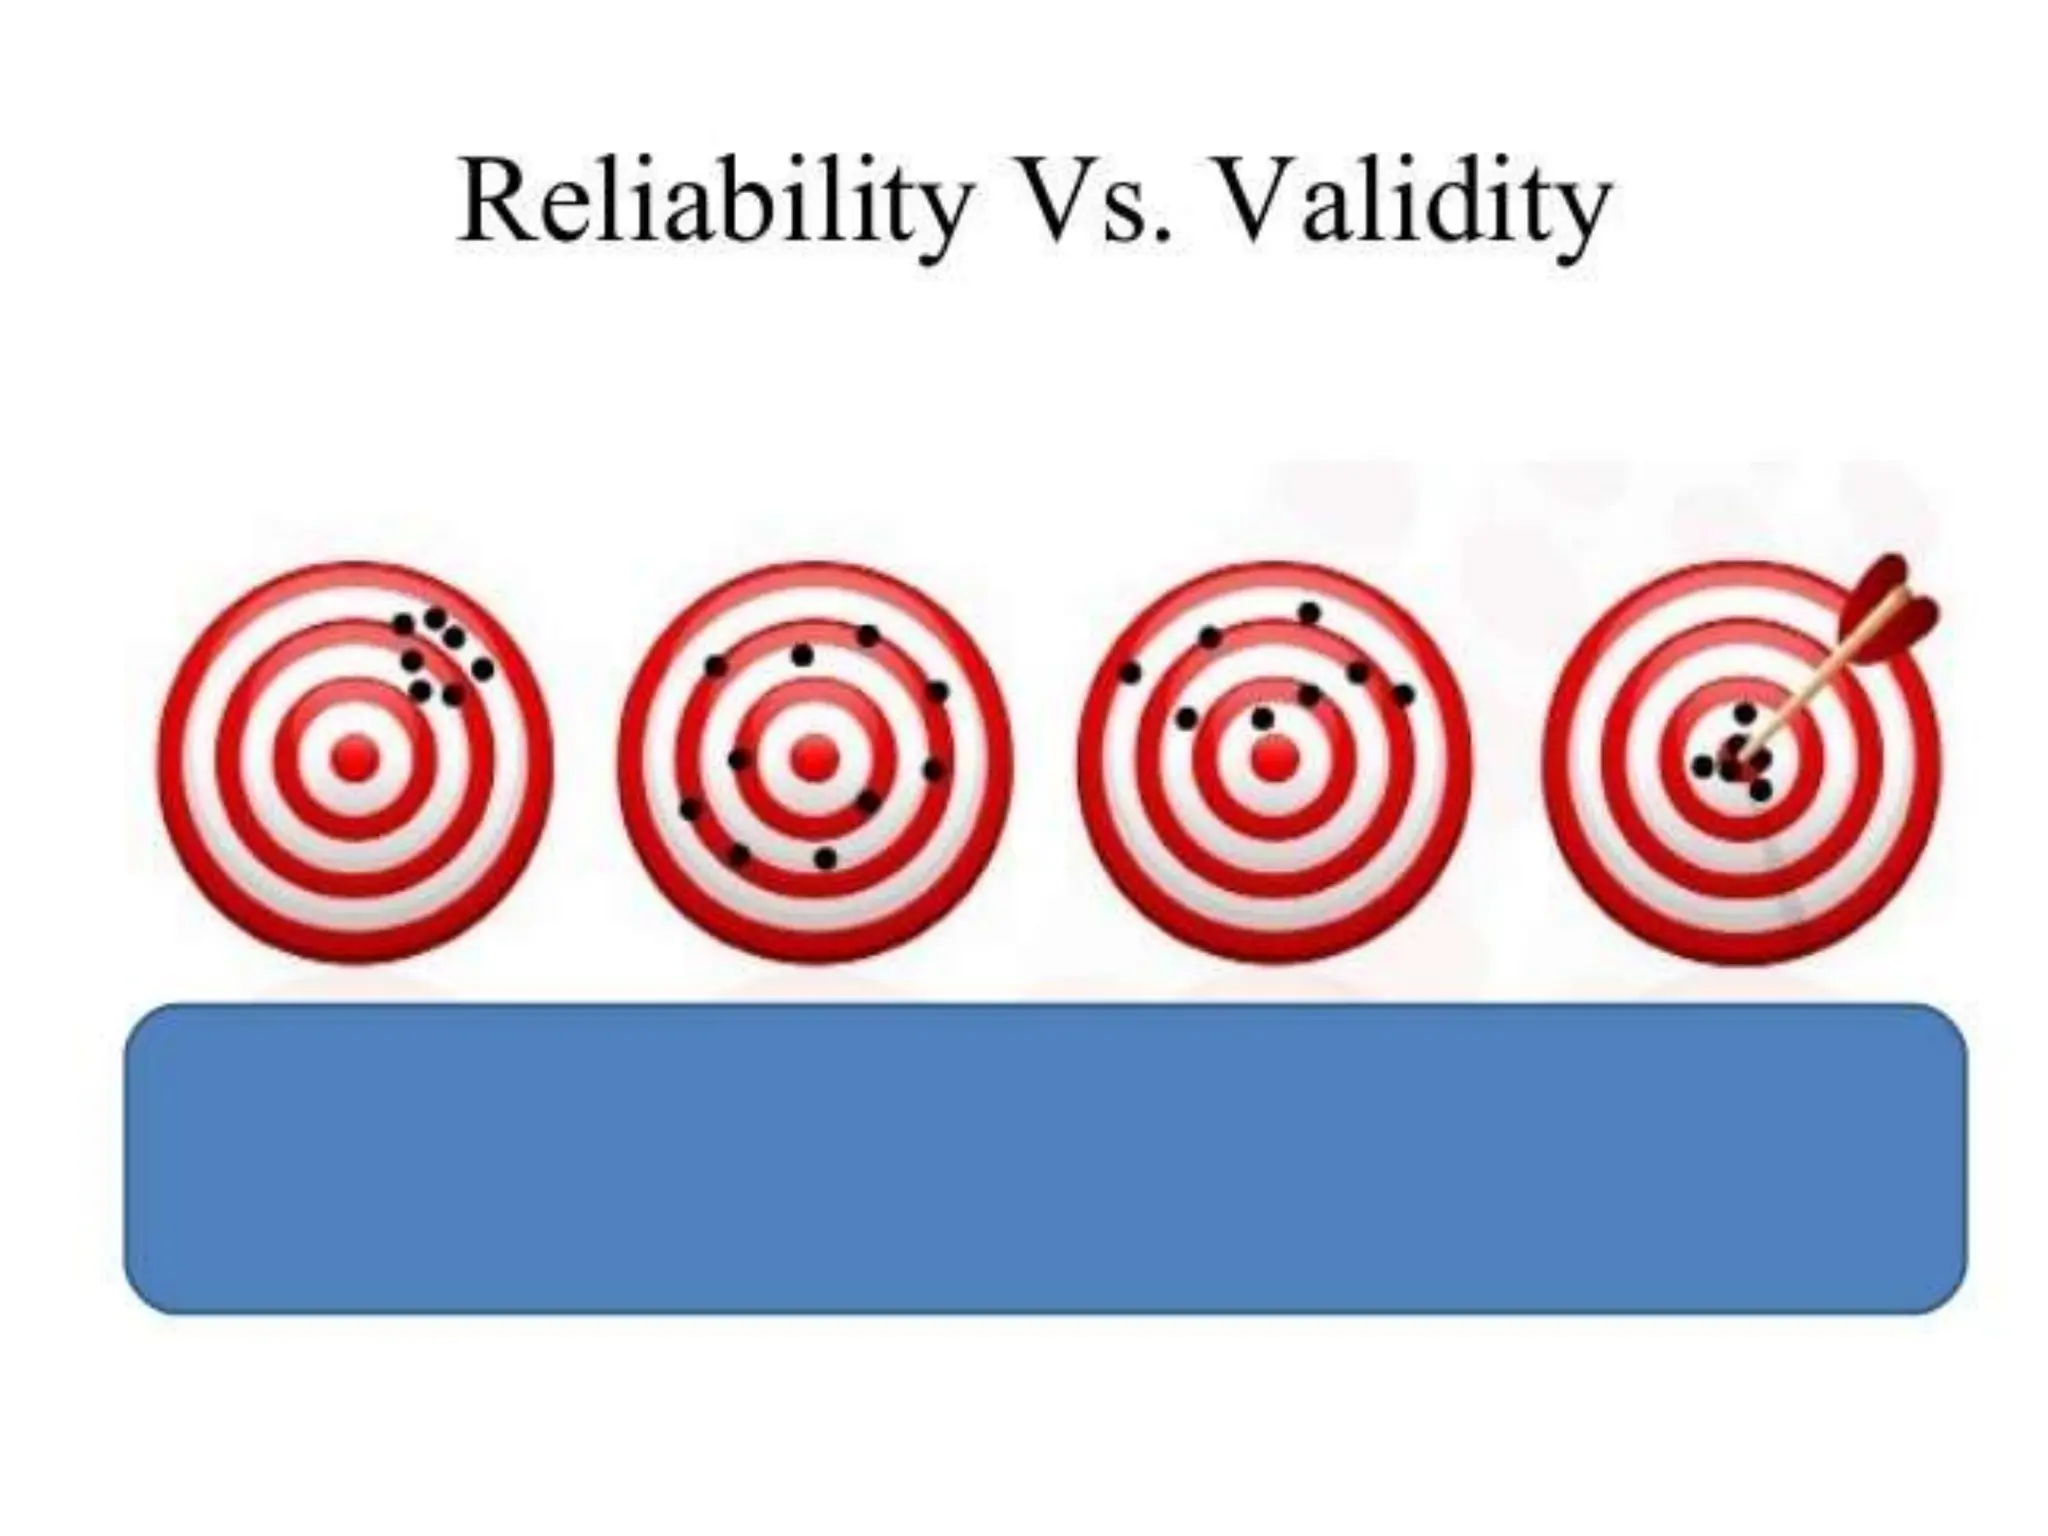
RELIABILITY AND
VALIDITY OF RESEARCH
TOOLS
Supriya
Reliability
Reliability is defined as the ability of an
instrument to create reproducible results,
because without the ability to reproduce
results no truth can be known.
Reliability
“the reliability of an instrument is the degree of
consistency with which the instrument measures
the target attribute”
-Pilot and Hungler
“reliability constitutes the ability of a measuring
instrument to produce the same answer on
successive occasions when no change has
occurred in the thing being measured”
-Burroughs
Features
Reliability concerns a measure’s accuracy
An instrument is reliable to the extent that it’s measures reflects the true score
It depends on the extent that the errors of measurement are absent from
obtained scores
A reliable measures maximizes the true score and minimizes the error
component
Reliability testing must be performed on each instrument used in a study
Reliability exists in degrees
Correlation coefficient with 1.00 indicates perfect reliability and 0 indicates no
reliability. Negative scores (-1.0) indicates negative reliability
Approaches
Approaches
Stability
Equivalence
Internal
consistency
Stability
 Stability of an instrument is the extent to which
similar results or responses are obtained on two
or more separate occasions.
 The assessment of an instrument’s stability
involves a procedure that evaluates its test-retest
reliability.
 Investigators administer the same measure to a
sample twice and then compare the scores.
 Usually, an interval of two weeks is kept between
the two assessments, because too short a period
(less than two weeks) would influence the second
scorings and too far apart in time would result in
loss of subjects or unexpected change in the
variable under study.
Stability
Test-retest:
 Test-retest reliability is the degree to which
scores are consistent over time. It indicates
score variation that occurs from testing
session to testing session as a result of errors
of measurement.
 Same test- different Times
 Only works if phenomenon is unchanging
 Example: Administering the same
questionnaire at 2 different times
Stability
 The statistical test coefficient of correlation is
computed to confirm the test’s reliability.
 The possible values for a correlation
coefficient range from −1.00 to +1.00.
 A reliability coefficient above 0.80 is usually
considered good; however, a score of 0.70 can
be considered acceptable.
Reliability
 There are a number of statistical formulae that
are used to compute reliability.
1. Stability (Test-retest) method
Pearson’s correlation coefficient formula for
estimation of reliability
Equivalence
 The focus equivalence is the comparison of
two versions of the same paper and pencil
instrument or of the two observers measuring
the same events.
Inter-item reliability: (internal
consistency)
 The association of answers to set of questions
designed to measure the same concept
 Cronbach’s alpha is a statistic commonly used
to measure inter-item reliability which is based
on the average of all the possible correlations
of all the split 1/2 s of set of questions on a
questionnaire.
Parallel form of Reliability
Split-Half Reliability:
 Especially appropriate when the test is very
long. The most commonly used method to split
the test into two is using the odd-even
strategy.
 Since longer tests tend to be more reliable,
and since split-half reliability represents the
reliability of a test only half as long as the
actual test.
Inter observer Reliability
 Correspondence between measures made by
different observers
 Inter-Rater or Inter-Observer Reliability:
Used to assess the degree to which different
raters/observers give consistent estimates of
the same phenomenon.
Homogeneity (Internal
Consistency)
 An instrument may be said to be internally
consistent or homogeneous to the extent that
its items measure the same trait.
 Scales that are designed to measure an
attribute are ideally composed of items that
measure that attribute and nothing else.
 On a scale to measure married women’s
attitude towards family planning, it would be
inappropriate to include few items that
measure their attitude towards breast feeding.
Homogeneity (Internal
Consistency)
 The most widely used method for evaluating internal
consistency is coefficient alpha (Cronbach’s alpha).
 By using split-half method, the internal consistency of
a tool can be calculated with the help of Spearman–
Brown correlation formula.
 Most statistical software can be used to calculate
alpha.
 Coefficient alpha can be interpreted like other
reliability coefficients. The normal range is between
0.00 and +1.00 and higher values reflect higher
internal consistency.
 A high value would mean that all the items in the
instrument will consistently measure the construct.
Reliability interpretation
Excellent
0.90 and above
best test
0.80-0.90 very
good
Good
0.70-0.80 good
Few items may
need
improvement
Somewhat low
0.60-0.70 low
Some items need
to improve/ need
more tests for
grading
Need for
revision of test
0.50-0.60
Need for revision
of test
Questionable
reliability
0.50 and below
Complete revision
of test
Validity
 In general, validity is an indication of how
sound your research is.
 Validity applies to both the design and
methods of research.

VALIDITY
“Any research can be affected by different kinds
of factors which, while extraneous to the
concerns of the research, can invalidate the
findings”
(Seliger and Shohamy, 1989)
Validity
“the degree to which an instrument measures,
what it is supposed to measure.”
The accuracy with which a test measures
whatever it is intended/supposed to measure.
Taxonomy of validity
Pertains to assessment
Pertains to casual
inference
Pertains to generalization
of finding to real world
phenomenon
Features of validity
Features
Ongoing
process
Applicability
Measurement
principle
Social value
Unending
process
Factors
affecting
validity
Unclear
direction
Reading
vocabulary
Difficult
sentence
framing
Inappropriate
items leads o
disorganization
of matter
Influence of
extraneous
factors
Inadequate
weightage of
subtopics
Types of validity
Face
Content
Criterion
Construct
Predictive
Concurrent
Face validity
 This is concerned with how a measure or
procedure appears.
 Face validity does not depend upon
established theories for support.
Content validity
 It is based on the extent to which a
measurement reflects the specific intended
domain of content.
 All major aspects of the content must be
adequately covered by the test items and in
correct positions.
Criterion validity
 It is also referred to as instrumental validity.
 It is used o demonstrate the accuracy of a
measure or procedure by comparing it with
another measure or procedure, which has
been demonstrated to be valid.
Construct validity
 It is the extent to which the test may be set to
measure a theoretical construct or trait.
 For example, of construct are anxiety,
intelligence, verbal fluency, dominance. It
refers to the extent to which a test reflects and
seems to measure a hypothesized trait.
Predictive validity
 A test is corrected against the criterion to be
made available in future.
 The extent to which a test can predict the
future performance of subjects.
Concurrent validity
 It can be determined by establishing the
relationship or discrimination.
 The relationship between scores on measuring
tool and criteria available at same time in the
present situation.
 Scientific
Reliability Validity

RELIABILITY AND VALIDITY OF RESEARCH TOOLS.pptx

  • 1.
    RELIABILITY AND VALIDITY OFRESEARCH TOOLS Supriya
  • 2.
    Reliability Reliability is definedas the ability of an instrument to create reproducible results, because without the ability to reproduce results no truth can be known.
  • 3.
    Reliability “the reliability ofan instrument is the degree of consistency with which the instrument measures the target attribute” -Pilot and Hungler “reliability constitutes the ability of a measuring instrument to produce the same answer on successive occasions when no change has occurred in the thing being measured” -Burroughs
  • 4.
    Features Reliability concerns ameasure’s accuracy An instrument is reliable to the extent that it’s measures reflects the true score It depends on the extent that the errors of measurement are absent from obtained scores A reliable measures maximizes the true score and minimizes the error component Reliability testing must be performed on each instrument used in a study Reliability exists in degrees Correlation coefficient with 1.00 indicates perfect reliability and 0 indicates no reliability. Negative scores (-1.0) indicates negative reliability
  • 5.
  • 6.
    Stability  Stability ofan instrument is the extent to which similar results or responses are obtained on two or more separate occasions.  The assessment of an instrument’s stability involves a procedure that evaluates its test-retest reliability.  Investigators administer the same measure to a sample twice and then compare the scores.  Usually, an interval of two weeks is kept between the two assessments, because too short a period (less than two weeks) would influence the second scorings and too far apart in time would result in loss of subjects or unexpected change in the variable under study.
  • 7.
    Stability Test-retest:  Test-retest reliabilityis the degree to which scores are consistent over time. It indicates score variation that occurs from testing session to testing session as a result of errors of measurement.  Same test- different Times  Only works if phenomenon is unchanging  Example: Administering the same questionnaire at 2 different times
  • 8.
    Stability  The statisticaltest coefficient of correlation is computed to confirm the test’s reliability.  The possible values for a correlation coefficient range from −1.00 to +1.00.  A reliability coefficient above 0.80 is usually considered good; however, a score of 0.70 can be considered acceptable.
  • 9.
    Reliability  There area number of statistical formulae that are used to compute reliability. 1. Stability (Test-retest) method Pearson’s correlation coefficient formula for estimation of reliability
  • 10.
    Equivalence  The focusequivalence is the comparison of two versions of the same paper and pencil instrument or of the two observers measuring the same events.
  • 11.
    Inter-item reliability: (internal consistency) The association of answers to set of questions designed to measure the same concept  Cronbach’s alpha is a statistic commonly used to measure inter-item reliability which is based on the average of all the possible correlations of all the split 1/2 s of set of questions on a questionnaire.
  • 13.
    Parallel form ofReliability Split-Half Reliability:  Especially appropriate when the test is very long. The most commonly used method to split the test into two is using the odd-even strategy.  Since longer tests tend to be more reliable, and since split-half reliability represents the reliability of a test only half as long as the actual test.
  • 15.
    Inter observer Reliability Correspondence between measures made by different observers  Inter-Rater or Inter-Observer Reliability: Used to assess the degree to which different raters/observers give consistent estimates of the same phenomenon.
  • 16.
    Homogeneity (Internal Consistency)  Aninstrument may be said to be internally consistent or homogeneous to the extent that its items measure the same trait.  Scales that are designed to measure an attribute are ideally composed of items that measure that attribute and nothing else.  On a scale to measure married women’s attitude towards family planning, it would be inappropriate to include few items that measure their attitude towards breast feeding.
  • 17.
    Homogeneity (Internal Consistency)  Themost widely used method for evaluating internal consistency is coefficient alpha (Cronbach’s alpha).  By using split-half method, the internal consistency of a tool can be calculated with the help of Spearman– Brown correlation formula.  Most statistical software can be used to calculate alpha.  Coefficient alpha can be interpreted like other reliability coefficients. The normal range is between 0.00 and +1.00 and higher values reflect higher internal consistency.  A high value would mean that all the items in the instrument will consistently measure the construct.
  • 18.
    Reliability interpretation Excellent 0.90 andabove best test 0.80-0.90 very good Good 0.70-0.80 good Few items may need improvement Somewhat low 0.60-0.70 low Some items need to improve/ need more tests for grading Need for revision of test 0.50-0.60 Need for revision of test Questionable reliability 0.50 and below Complete revision of test
  • 19.
    Validity  In general,validity is an indication of how sound your research is.  Validity applies to both the design and methods of research. 
  • 20.
    VALIDITY “Any research canbe affected by different kinds of factors which, while extraneous to the concerns of the research, can invalidate the findings” (Seliger and Shohamy, 1989)
  • 21.
    Validity “the degree towhich an instrument measures, what it is supposed to measure.” The accuracy with which a test measures whatever it is intended/supposed to measure.
  • 22.
    Taxonomy of validity Pertainsto assessment Pertains to casual inference Pertains to generalization of finding to real world phenomenon
  • 23.
  • 24.
  • 25.
  • 26.
    Face validity  Thisis concerned with how a measure or procedure appears.  Face validity does not depend upon established theories for support.
  • 27.
    Content validity  Itis based on the extent to which a measurement reflects the specific intended domain of content.  All major aspects of the content must be adequately covered by the test items and in correct positions.
  • 28.
    Criterion validity  Itis also referred to as instrumental validity.  It is used o demonstrate the accuracy of a measure or procedure by comparing it with another measure or procedure, which has been demonstrated to be valid.
  • 29.
    Construct validity  Itis the extent to which the test may be set to measure a theoretical construct or trait.  For example, of construct are anxiety, intelligence, verbal fluency, dominance. It refers to the extent to which a test reflects and seems to measure a hypothesized trait.
  • 30.
    Predictive validity  Atest is corrected against the criterion to be made available in future.  The extent to which a test can predict the future performance of subjects.
  • 31.
    Concurrent validity  Itcan be determined by establishing the relationship or discrimination.  The relationship between scores on measuring tool and criteria available at same time in the present situation.
  • 34.