Downloaded 130 times
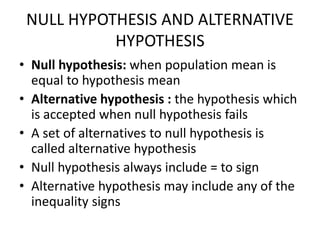
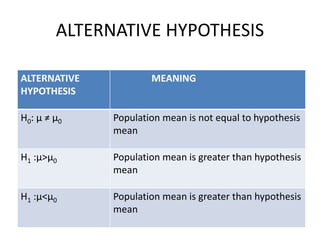
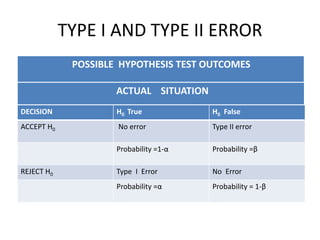
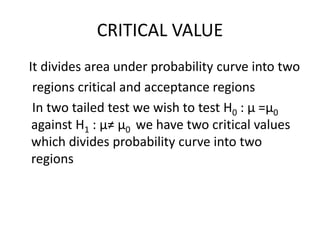
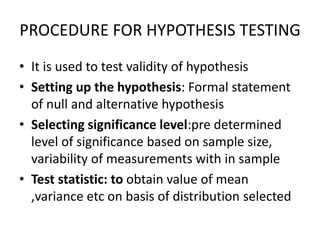
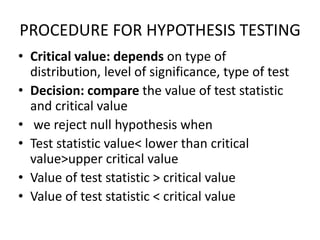
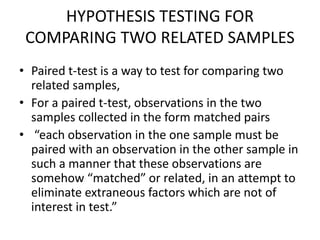
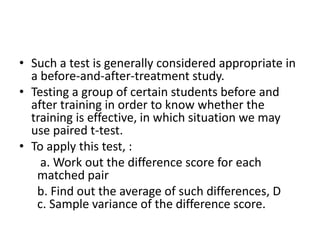
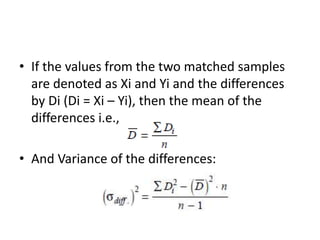
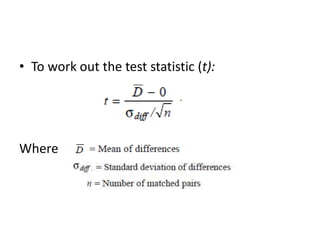
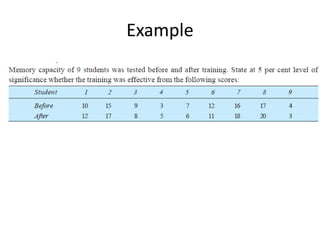
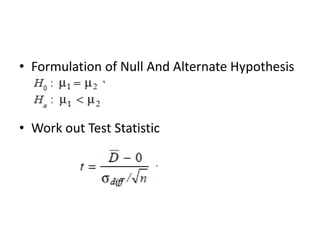
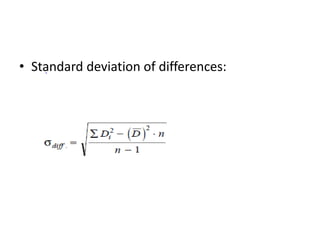
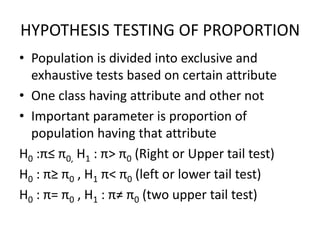
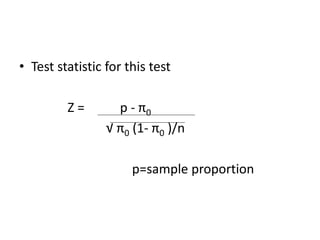
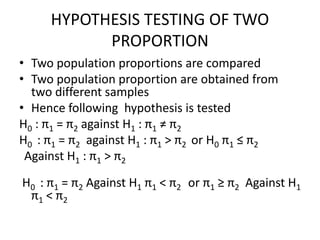


This document summarizes a presentation on hypothesis testing. It defines key concepts like the null and alternative hypotheses, type I and type II errors, and one-tailed and two-tailed tests. It then outlines the procedure for hypothesis testing, including setting hypotheses, selecting a significance level, calculating test statistics, and determining whether to reject the null hypothesis. Specific hypothesis tests are described, like paired t-tests for comparing two related samples and tests of proportions. Limitations of hypothesis testing are noted, such as that results are probabilistic and small samples impact reliability.


