Download to read offline

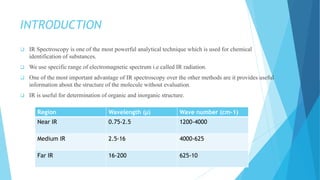
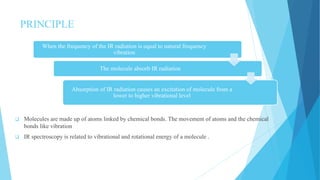


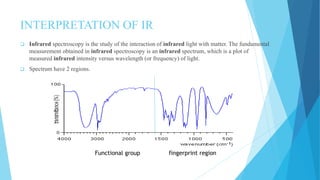
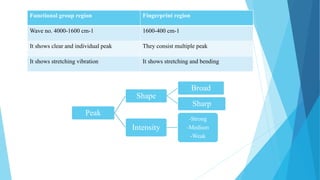

IR spectroscopy is a technique used to identify chemical substances based on the frequencies at which they absorb infrared radiation. When IR radiation is passed through a sample, some wavelengths are absorbed by the bonds between atoms in the molecules, exciting them to higher vibrational states. This absorption can be measured and plotted as an infrared spectrum, which is characteristic of the molecular structure. The spectrum is divided into functional group and fingerprint regions. The functional group region from 4000-1600 cm-1 shows clear peaks corresponding to bond stretching vibrations, while the fingerprint region from 1600-400 cm-1 contains complex patterns from stretching and bending vibrations that can be used to identify unknown substances.


