
More Related Content
What's hot
What's hot (20)
Similar to AAS interference.pptx
Similar to AAS interference.pptx (20)
More from Vandana Devesh Sharma
More from Vandana Devesh Sharma (8)
Recently uploaded
Recently uploaded (20)
AAS interference.pptx
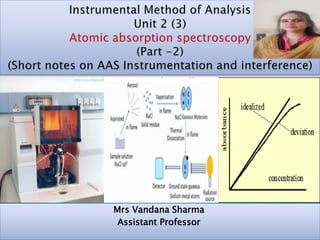
- 1. Mrs Vandana Sharma Assistant Professor
- 2. Interference is a phenomena that leads to changes (either positive or negative) in intensity of the analyte signal in spectroscopy. Interferences in atomic absorption spectroscopy fall into two basic categories, namely, non-spectral and spectral. Interferences in AAS Spectral Non-spectral Matrix Ionization Chemical
- 3. Spectral interferences are caused by presence of: 1.another atomic absorption line, 2.or a molecular absorbance band close to the spectral line of element of interest. Most common spectral interferences are due to molecular emissions from oxides of other elements in the sample. The main cause of background absorption is presence of undissociated molecules of matrix that have broad band absorption spectra and tiny solid particles, unvaporized solvent droplets or molecular species in the flame which may scatter light over a wide wavelength region. When this type of non- specific adsorption overlaps the atomic absorption of the analyte, background absorption occurs. The problem is overcome by: 1.measuring and subtracting the background absorption from the total measured absorption to determine the true atomic absorption.
- 4. 2.by choosing another line for the analyte. For example, a vanadium line at 3082.11 Ao interferes with aluminum line at 3082.15 Ao . This interference is avoided by employing the aluminum line at 3092.7 Ao 1. Matrix Interference When a sample is more viscous or has different surface tension than the standard, it can result in differences in sample uptake rate due to changes in nebulization efficiency. The problem is overcome by: Such interferences are minimized by matching as closely as possible the matrix composition of standard and sample. 2. Chemical Interference If a sample contains a species which forms a thermally stable compound with the analyte that is not completely decomposed by the energy available in the flame then chemical interference exists.
- 5. Refractory elements such as Ti, W, Zr, Mo and Al may combine with oxygen to form -- ---thermally stable oxides. The problem is overcome by: Analysis of such elements can be carried out at higher flame temperatures using nitrous oxide – acetylene flame ----instead of air-acetylene to provide higher dissociation energy. or Alternatively, an excess of another element or compound can be added e.g. Ca in presence of phosphate produces stable calcium phosphate which ---reduces absorption due to Ca ion. If an excess of lanthanum is added it forms a thermally stable compound with phosphate and ----calcium absorption is not affected.
- 6. 3. Ionization Interference Ionization interference is more common in hot flames. The dissociation process does not stop at formation of ground state atoms. Excess energy of the flame can lead to--- ionization of ground state atoms ---by loss of electrons thereby ---resulting in depletion of ground state atoms. In cooler flames such interference is encountered with easily ionized elements such as alkali metals and alkaline earths. The problem is overcome by: Ionization interference is eliminated by adding an excess of an element which is easily ionized ----thereby creating a large number of free electrons in the flame ----and suppressing ionization of the analyte. Salts of such elements as K, Rb and Cs are commonly used as ionization suppressants.
- 7. Ca (g) Analyte Ca+ (g) + e- K(g) ionization suppressant K+ (g) + e-
- 8. Short note on Instrumentation (AAS) and short answers
- 9. Atomic absorption spectroscopy is a precise analytical technique. It is used for the quantification of metals present in the analyte. It is one of the best techniques to detect the sample at trace levels such as part per billion (ppb). Atomic absorption spectroscopy was developed by Alan Walsh in the 1950s. This technique involves the absorption of radiant energy (usually ultraviolet and visible) by a bunch of free atoms. The sample used is in a gaseous state. When an atom absorbs light of a specific wavelength, it results in the excitation of electrons from the ground state to the excited state. The energy absorbed per mole is fixed and can be used for qualitative and quantitative analysis.
- 10. PRINCIPLE Atoms of the analyte have a fixed number of electrons. If the light of a specific wavelength is passed through a flame containing that atom, electrons present in different energy levels, known as orbitals, absorb a certain wavelength and excite to higher energy levels. The extent of absorption ά the number of ground-state atoms in the flame. Only for information- The ground state is more stable than the excited state. The electrons spontaneously return back to the ground state. It emits the same amount of radiant energy. This process is called fluorescence. Fluorescence is used in atomic emission spectroscopy. Instrumentation The basic components of atomic absorption are: 1. Light source 2. Chopper 3. Atomizer 4. Burners 5. flames 6. Monochromators 7. Detectors 8. Amplifier 9. Readout devices
- 11. Collimating mirror Focusing mirror gratings Entrance slit Exit slit
- 12. 1. LIGHT SOURCE A hollow cathode lamp is used as the light source. As the name suggests, it consists of a cylindrical hollow cathode made up of the same element under consideration. The anode is made up of tungsten. Both anode and cathode are enclosed in a glass tube with a quartz window. The glass envelope is filled with inert gases (Ar, Ne) under reduced pressure (1-5 torr). When a high voltage (300-500 V) is applied across the electrodes, it ionizes noble gases at the anode (+). The ions produced as a result are accelerated toward the cathode (-). When these fast-moving ions strike the surface of the cathode, they cause some of the metal atoms to sputter. Thus, the electrons of vaporized metals are excited to higher energy levels. It is due to continuous collision with higher energy gas ions.
- 13. 2. CHOPPER A chopper is a rotating wheel between a hollow cathode lamp and a flame. It removes large droplets and allows uniform size droplets to enter the flame. It breaks the steady light from the lamp into pulsating light. This gives the pulsating current in the photocell that is amplified and recorded without any interference. 3. Sample introduction system This is used to transfer samples to the atomizer. It should produce no interference, must be independent of sample type, and universal for all atomizers. Pneumatic nebulizers are commonly used for introducing solutions. A jet of compressed air, nebulization gas, aspirates and nebulize the solution when the sample is sucked through the capillary tube. Types of nebulizers Concentric nebulizers Angular or crossflow nebulizers
- 14. 4. Atomizers The analyte is broken into the free atoms with the atomizer. For this purpose, a very high temperature is required. Only a portion of the sample solution is introduced into the burner chamber through the nebulizer. In the bottom of the chamber, large particles are accumulated. These are then drained off. 5. Atomization sources Burners These are the basic types of burners used in atomic absorption spectroscopy. Total consumption burners In the total consumption burner, the sample solution, the fuel (usually acetylene), and the oxidizing gases enter through separate passages at an opening in the base of the flame. Here gases create a partial vacuum and force the sample to move up through capillary action.
- 15. Premix chamber burners In premix chamber burners, the sample is aspirated through a nebulizer and sprayed as a fine aerosol into the mixing chamber. Here the sample is mixed with fuel and oxidant gases and carried to the burner head where atomization takes place. 6. Flames Flame is generally produced by using a mixture of gases. There are two types of flames commonly used in atomic absorption spectroscopy. Air acetylene flame Nitrous oxide acetylene flame 7. Monochromators The function of a monochromator is to select the specific wavelength of light that is being absorbed by the sample. Types of monochromators Prism Diffraction gratings
- 16. Dispersion from the grating is more uniform than dispersion from the prism. So, the grating can maintain a higher resolution over a longer range of wavelengths. 8. Detectors Photomultiplier tubes are the most commonly used detectors in atomic absorption spectroscopy. These are used to convert electromagnetic waves into electric currents. They are made up of photoemissive cathodes and dynodes. These dynodes provide electron multiplications. Photodiode array detectors These detectors convert the transmitted light signals into an electric pulse. 9. AMPLIFIERS The output from detectors is fed to amplifiers which amplify the current several times.
- 17. 10. Readout devices Readout systems used in atomic absorption spectroscopy are meters, chart recorders, digital display meters, etc. hard copies can make on chart recorders, printers, or plotters. WORKING PROCESS Generally, the samples for atomic absorption spectroscopy analysis should be in solution form. The steps involved in the analysis are - Conversion of sample into solution form. Preparation of blank solution. Preparation of a series of standard solutions. Setup instrumental parameters Measure the absorbance of standard solutions A plot calibration curve (concentration vs absorbance) Measure the absorbance of the sample solution. The unknown concentration of the element is calculated from the calibration curve.
- 18. Calibration The instrument must be calibrated before analysis for better results. There must be five standard solutions containing a known concentration of metals to be analyzed for calibration of the instrument and of the same concentration as the sample solutions. Calibrating solution is generally prepared as a sample of salt dissolved in water or dilute acid. The calibration curve is plotted between concentration and absorbance. ABSORPTION SPECTRUM It consists of a series of well-defined extremely narrow lines arising from the electronic transition of the outermost electrons.
- 19. Quantitative analysis in AAS Quantification of elements is done by plotting calibration curves. At least four standards and a blanks solution are required to plot a linear calibration curve of absorbance versus concentration. In all absorbance measurements, the reading must be taken after the instrument zero has been adjusted against a blank which may be distilled water or a solution of similar composition to the test solution. Usually, standards are measured in the order of increasing concentration. After making the measurement with one solution, distilled water is aspirated into the flame to remove all the traces of the solution before proceeding to the next solution. At least two to three separate readings should be taken and then averaged.
- 21. Safety measures The atomic absorption room must be properly ventilated and provided with an adequate exhaust system with airtight joints on discharged side. Gas cylinders must be fastened securely outside the room well away from heat or ignition sources. Pipes that carry the gas from cylinders must be securely fixed to avoid damage. Make periodic checks of leaks by applying soap solution to joints and seals. Never run acetylene gas at higher pressure (maximum 15 psi). Tubes should be made of brass are other substances which contain copper of less than 65%. Never analyze the flame or hollow cathode lamp directly. (uses protective eyewear). When the atomic absorption spectrophotometer is turned off, close the gas supply valve tightly, and bleed the gas line to the atmosphere through exhaust systems.
- 22. What is the principle of atomic absorption spectroscopy? When monochromatic light is passed through a flame containing the atom under consideration, then the part of the light will be absorbed by the electron of the atoms atom that causes the excitation. The extent of absorption is proportional to the number of ground-state atoms. What is the significance of the atomic absorption technique? Atomic absorption is a technique used for the detection of metals in solution at trace. It gives relative analysis such that every element is detected one by one. Which detector is used in atomic absorption spectroscopy? There are two types of detectors used in atomic absorption spectroscopy i.e, film and photomultipliers. How accurate is atomic absorption spectroscopy? Atomic absorption spectroscopy is a very accurate technique for the detection of metals. It can detect the elements up to 0.1 µg/ mL. Since It is 100 times more precise than UV visible spectroscopy. Which is the correct order instrumentation of AAS? Order of instrumentation of AAS: 1. Light source 2. Chopper 3. Atomizer 4. Monochromators 5. Detectors 6. Amplifier 7. Readout devices
- 23. What can atomic absorption spectroscopy be used for? Atomic absorption spectroscopy is used for the detection of metal at trace and ultra- trace levels. Atomic absorption spectroscopy is used for geochemical and metallurgical analysis. It is used for the detection of metals in biological fluids i.e blood, and urine. Atomic absorption is used for pharmaceutical analysis. After absorption in Atomic Absorption Spectrometry AAS do electrons re-emit the absorbed light? When an electron absorbs energy the goes to a higher energy state. They remain in the excited state for a while and come back to the ground state by emitting the absorbed energy. Because the ground state is more stable than the excited state. Why are nonmetals not detected by atomic absorption spectroscopy? Metals are detected through atomic absorption by their ionization whereas, nonmetals do not ionize. That’s why nonmetals are not detected by atomic absorption spectroscopy. What is atomic spectroscopy? Spectroscopy is the interaction of light with matter. When we studied this interaction at the atomic level then this is known as atomic spectroscopy. What is the difference between a molecular absorption spectrum and an atomic absorption spectrum? A molecular spectrum is a study of molecules. It shows light absorb by the whole molecule. The molecular spectrum has a broad peak. while atomic absorption has a sharp distinct peak. It shows the light absorb by the atom. What is the difference between fluorescence spectroscopy and absorbance spectroscopy? Fluorescence spectroscopy deals with the emission of light when an electron returns to the ground state. Whereas, absorbance spectroscopy deals with the absorbance of light by electrons and their excitation.
- 24. What is molecular fluorescence spectroscopy? In molecular fluorescence spectroscopy, light energy is used to excite an electron of certain molecules. When this electron returns to the ground state they emit light. This emitted light is directly proportional to the number of atoms present in the analyte. What elements can AAS detect? Atomic absorption spectroscopy is used to detect metal atoms. What are the disadvantages of Atomic Absorption Spectroscopy? Disadvantages of AAS Atomic absorption is used only for metals detection. It cannot be used qualitative analysis Very high temperature is required for analysis AAS is a destructive technique It is an expensive procedure Toxic and flammable gases are required for analysis Why are atomic absorption lines very narrow? The atomic absorption spectrum is very narrow because AAS is a highly specific method of analysis. Its spectrum displays the characteristic wavelength absorbed by metal atoms. What is the detection limit of AAS? The detection limit of atomic absorption spectroscopy is ranging from ppm to ppb or 0.1 µg/ mL to 1.0 µg/ mL. What do AAS and FES stand for? AAS stands for Atomic absorption spectroscopy whereas FES stands for flame emission spectroscopy