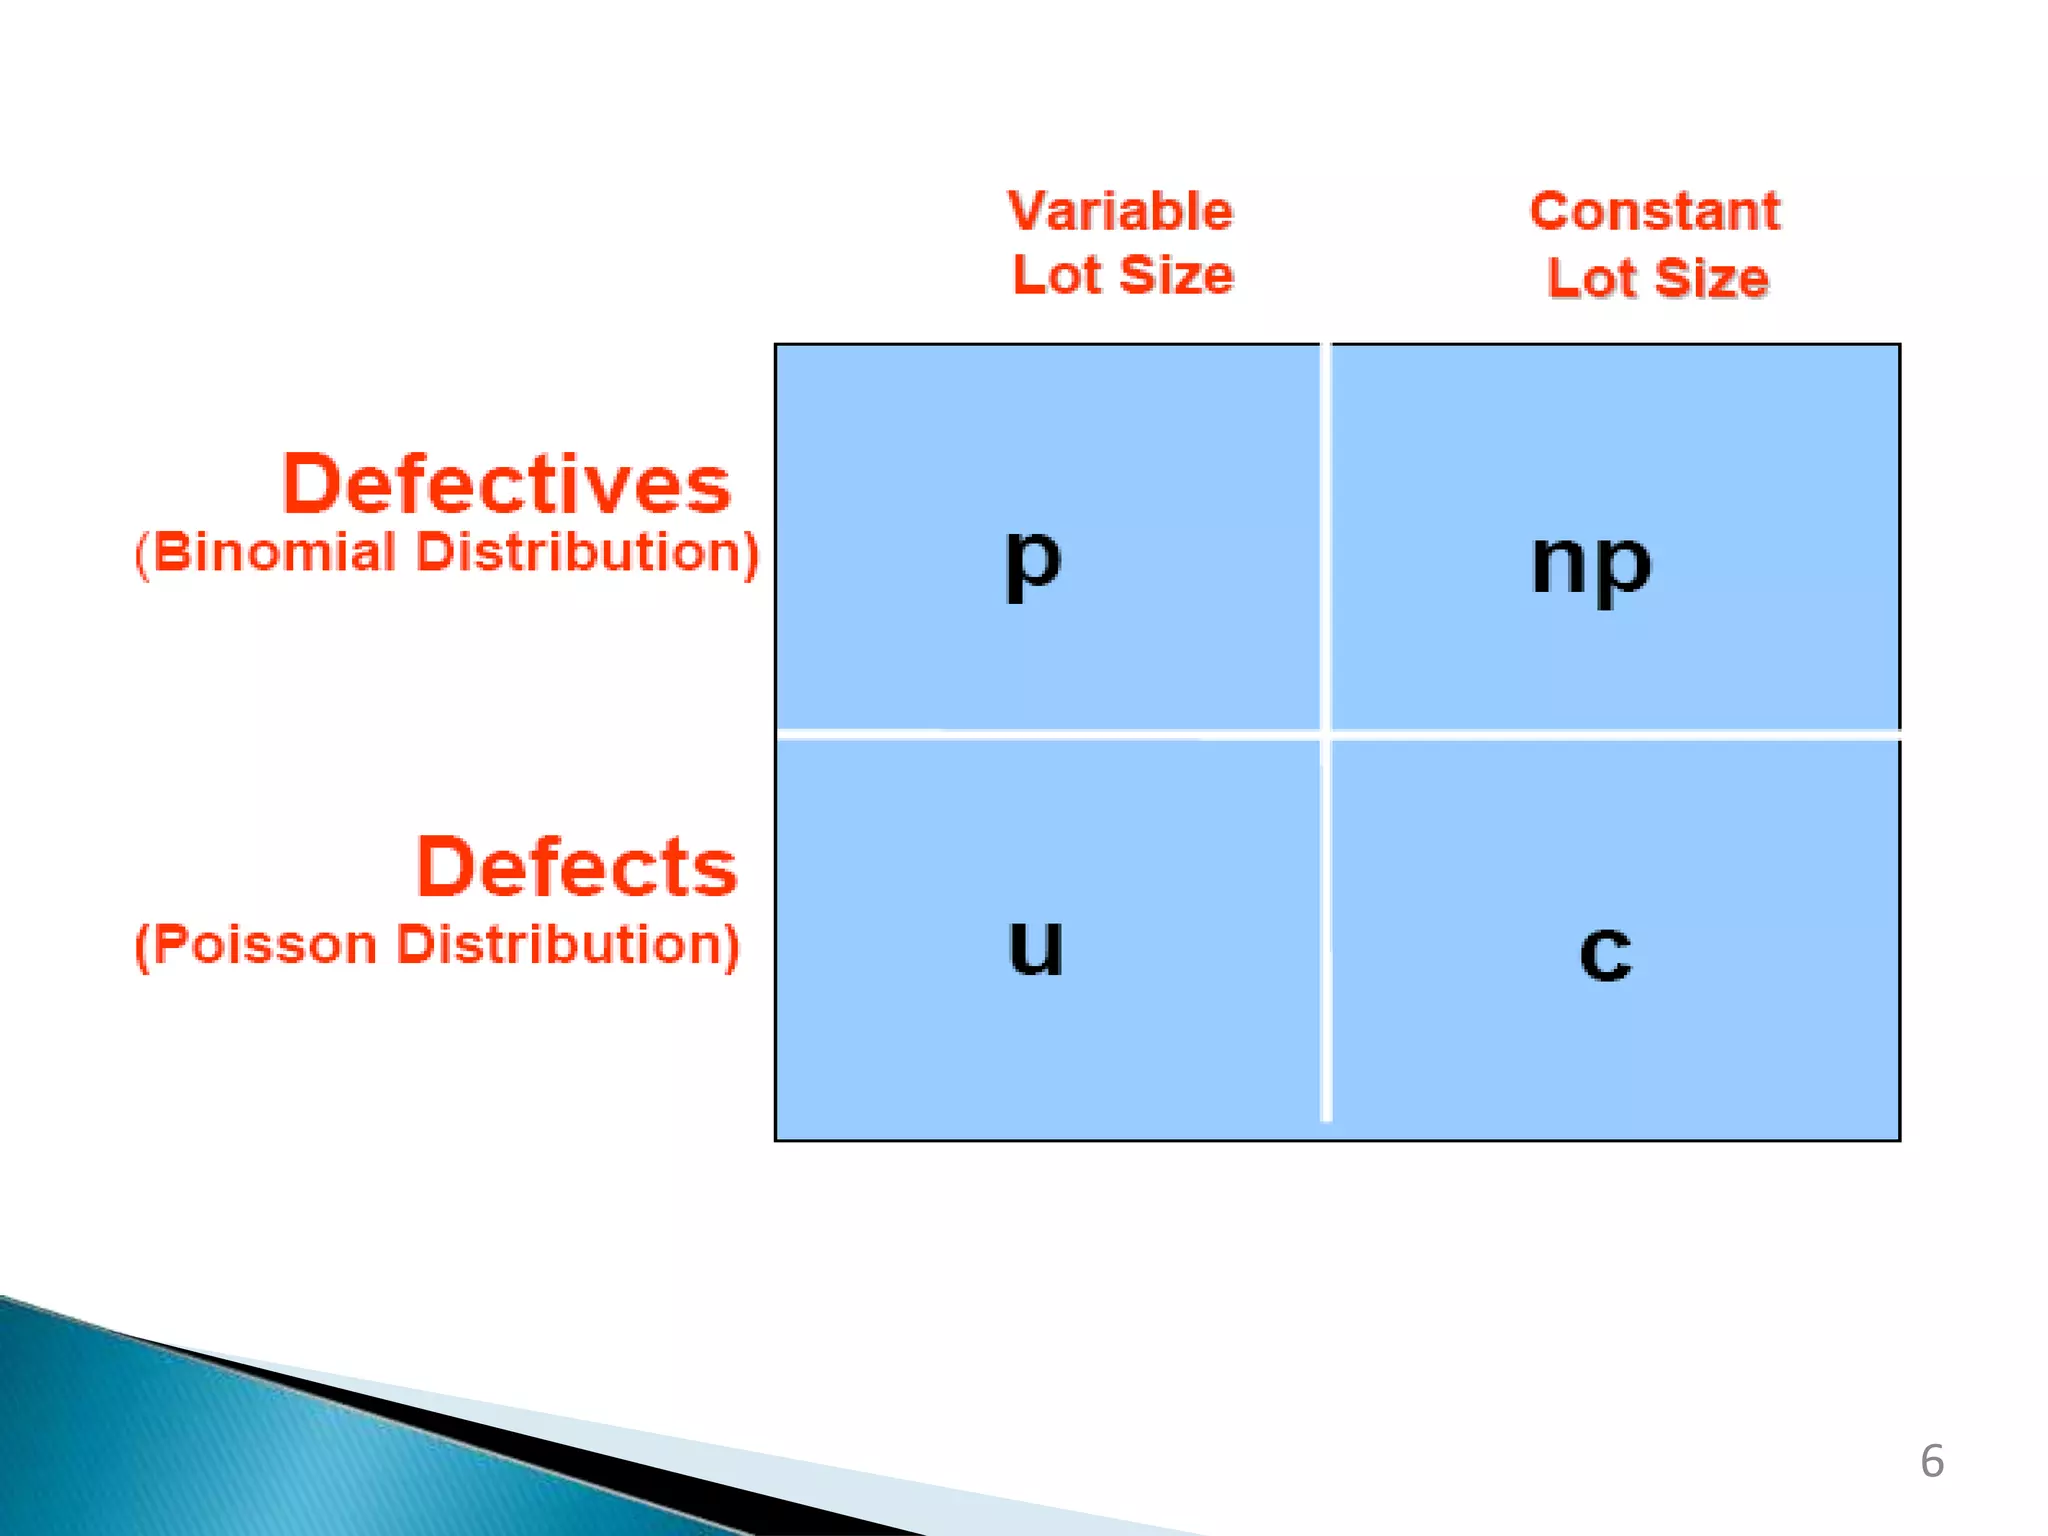
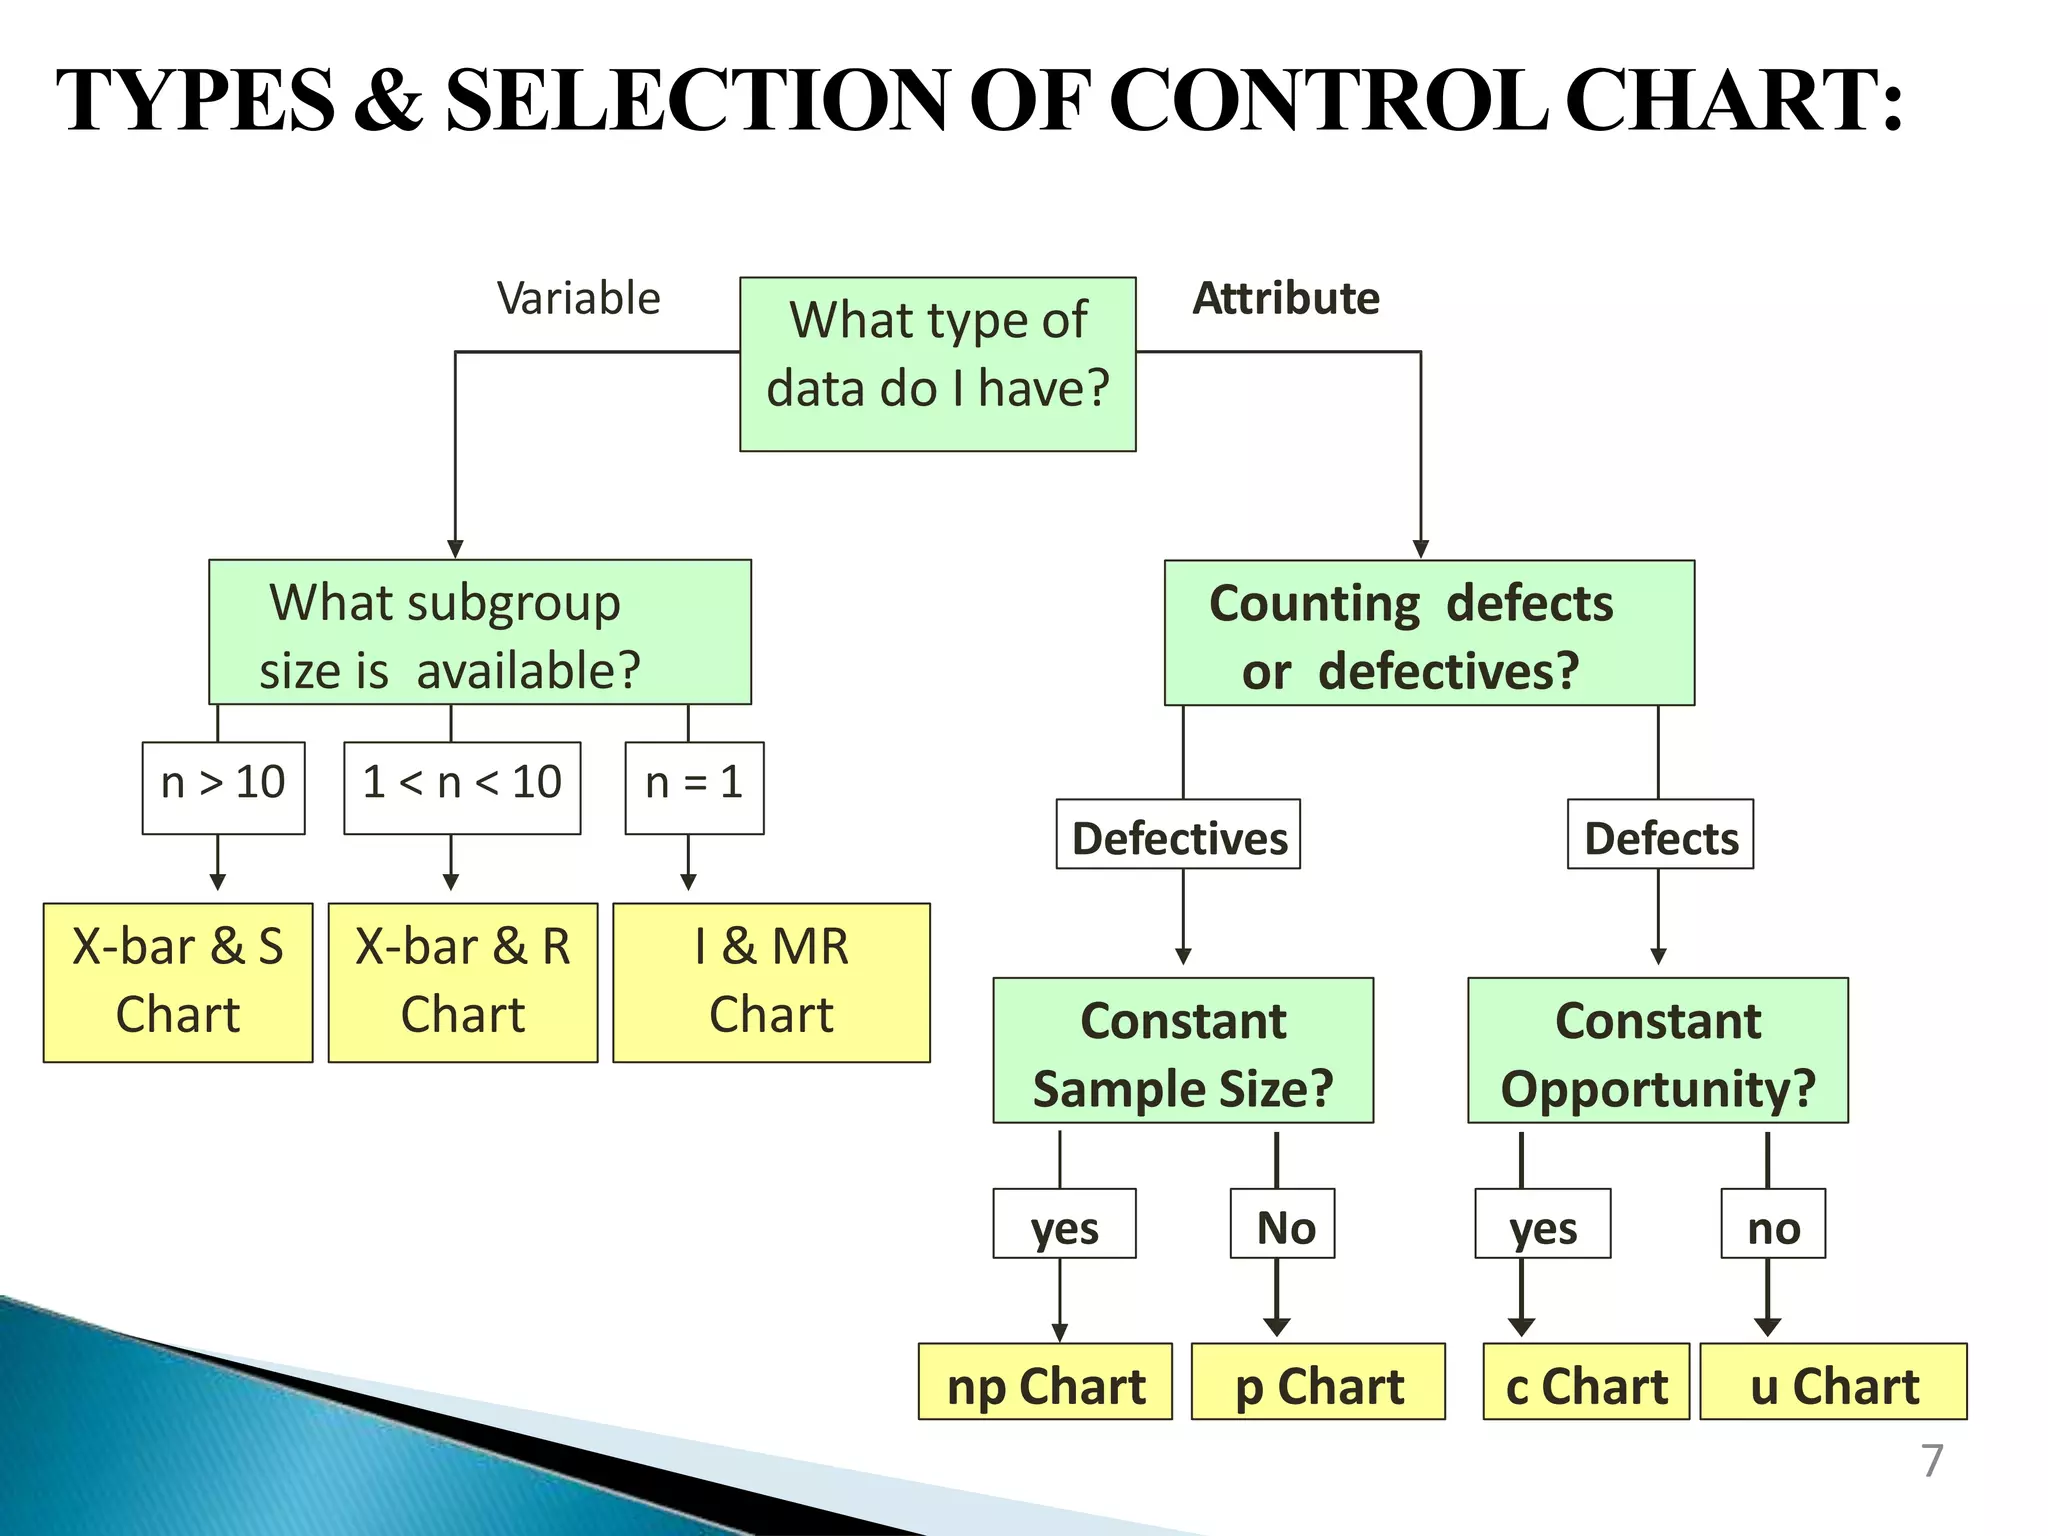
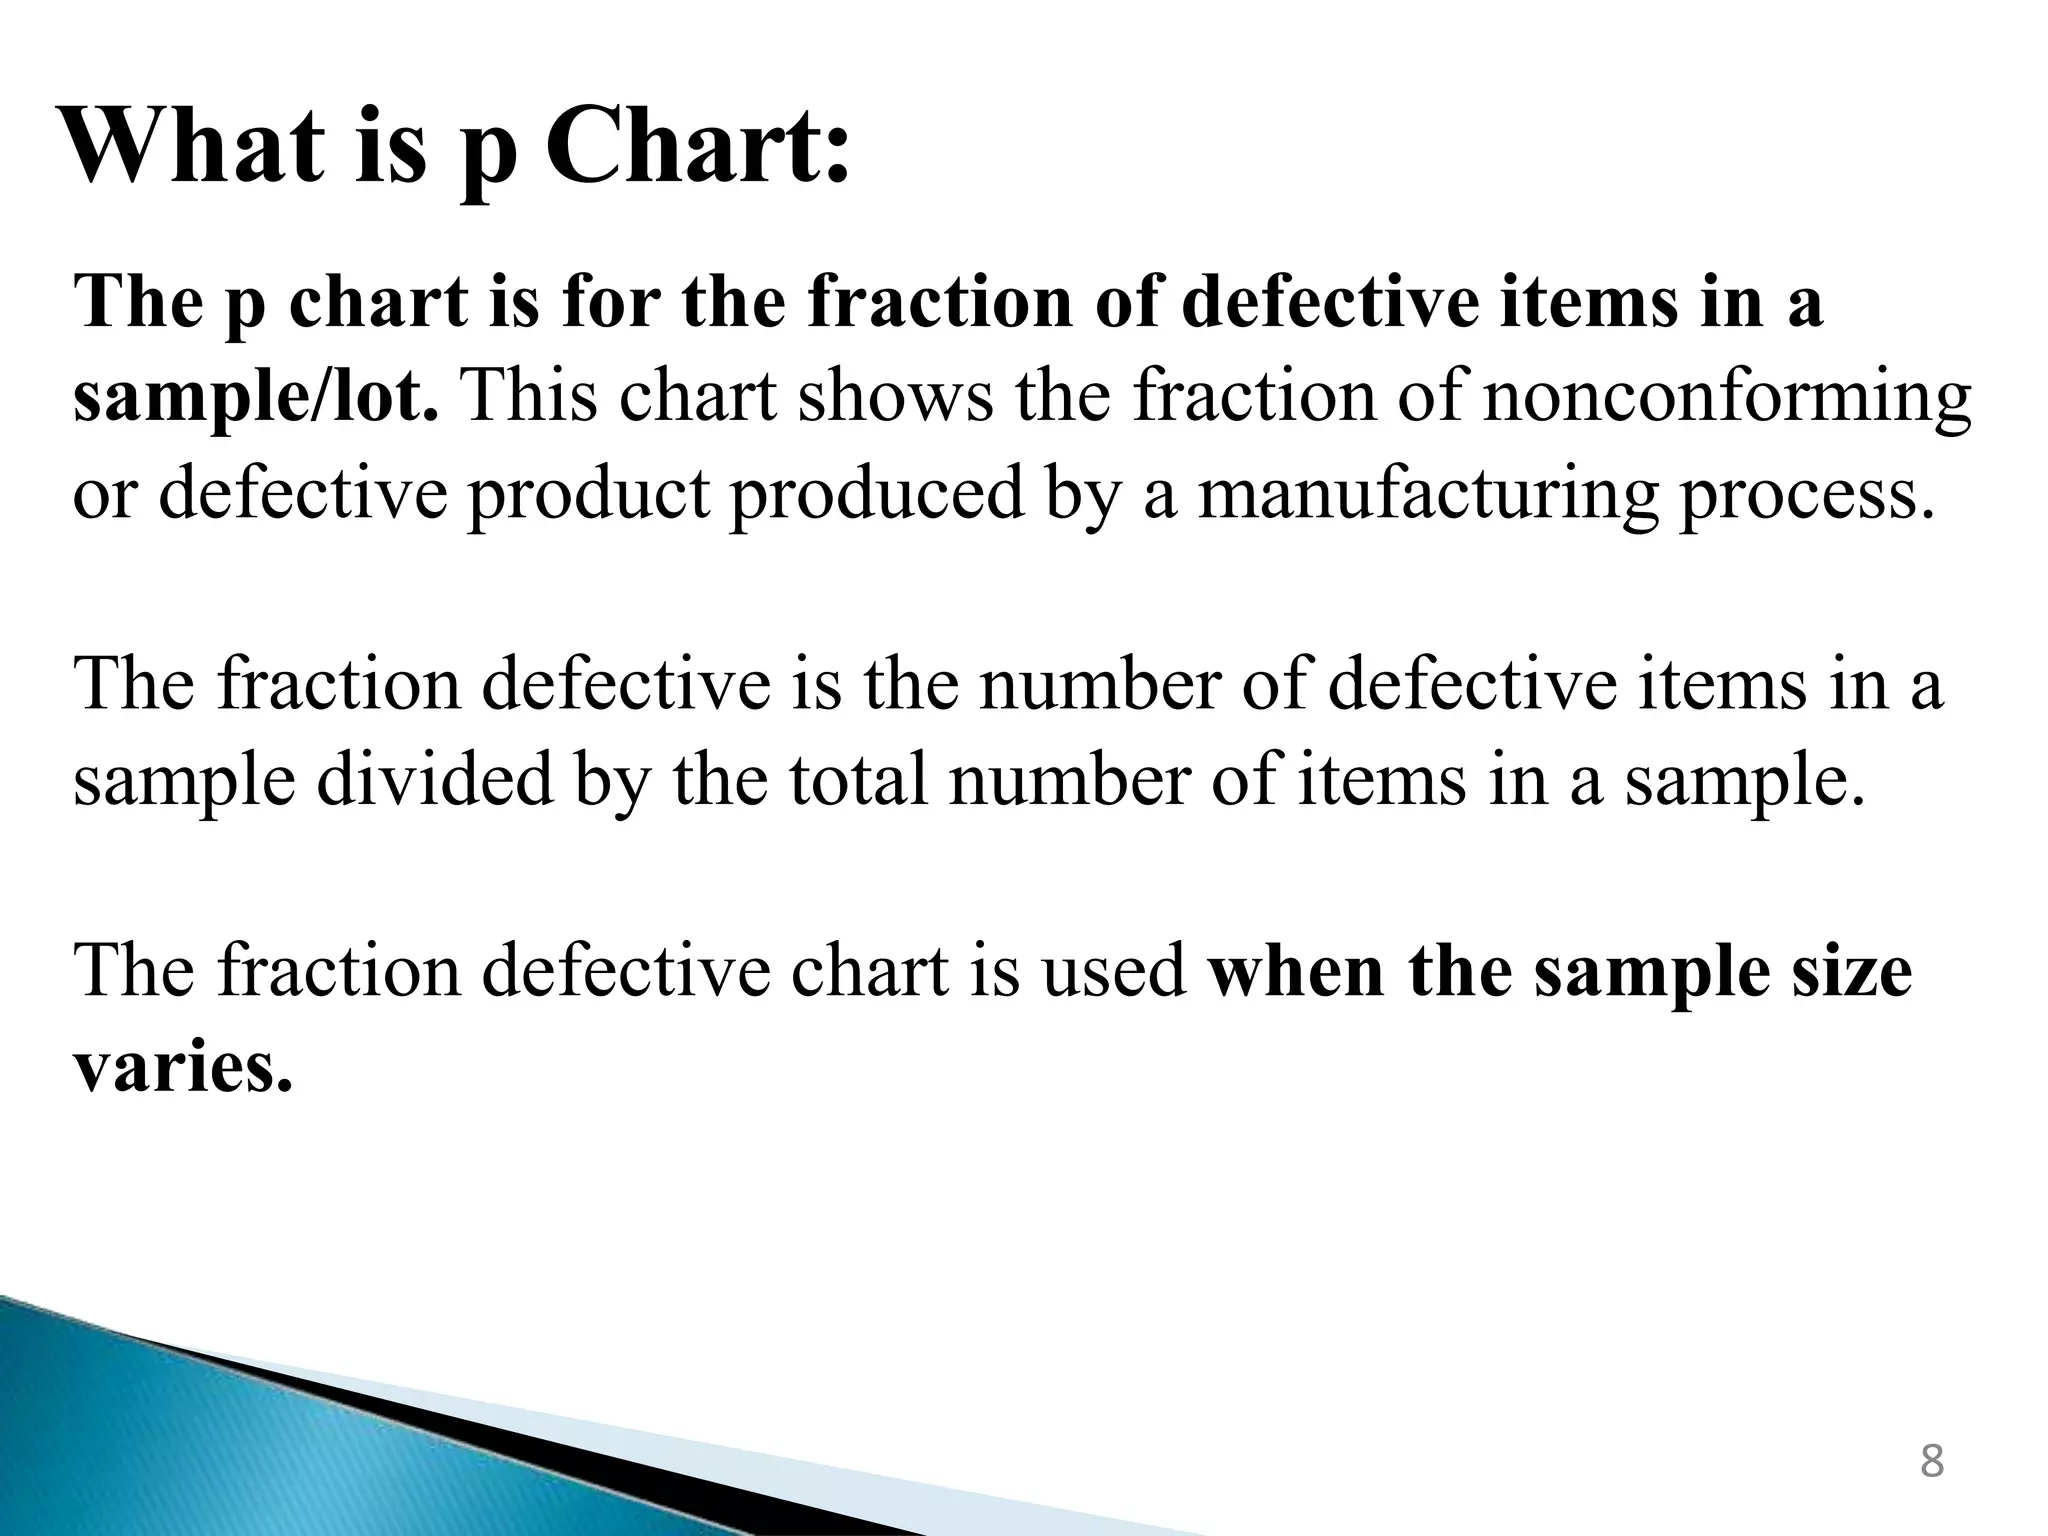
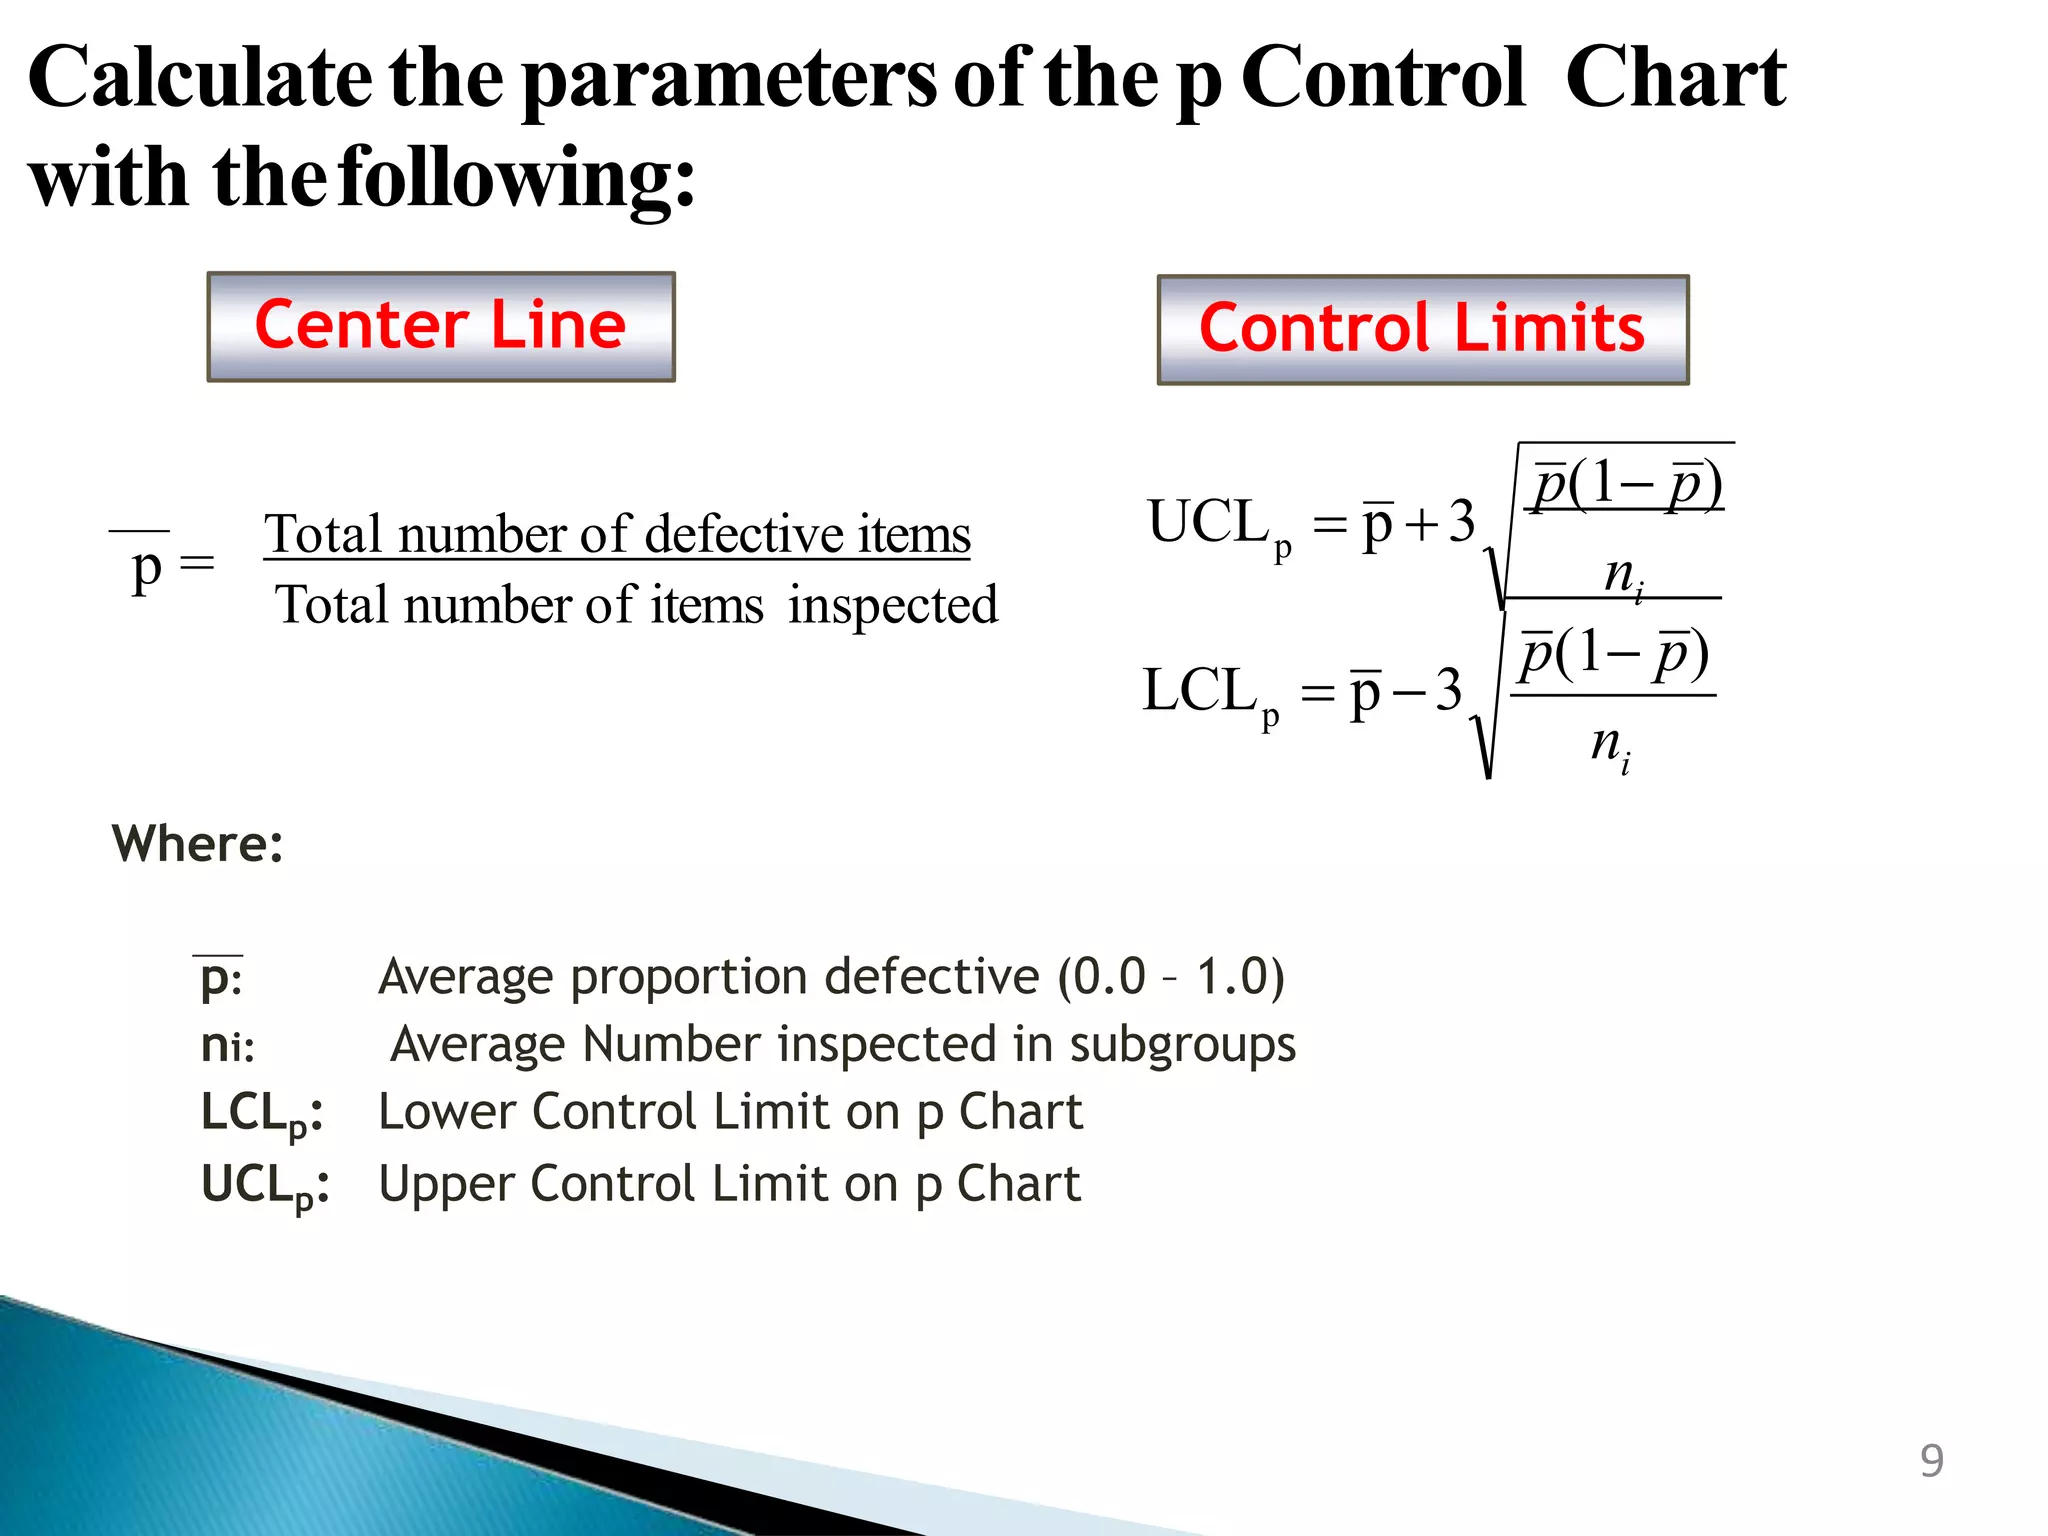
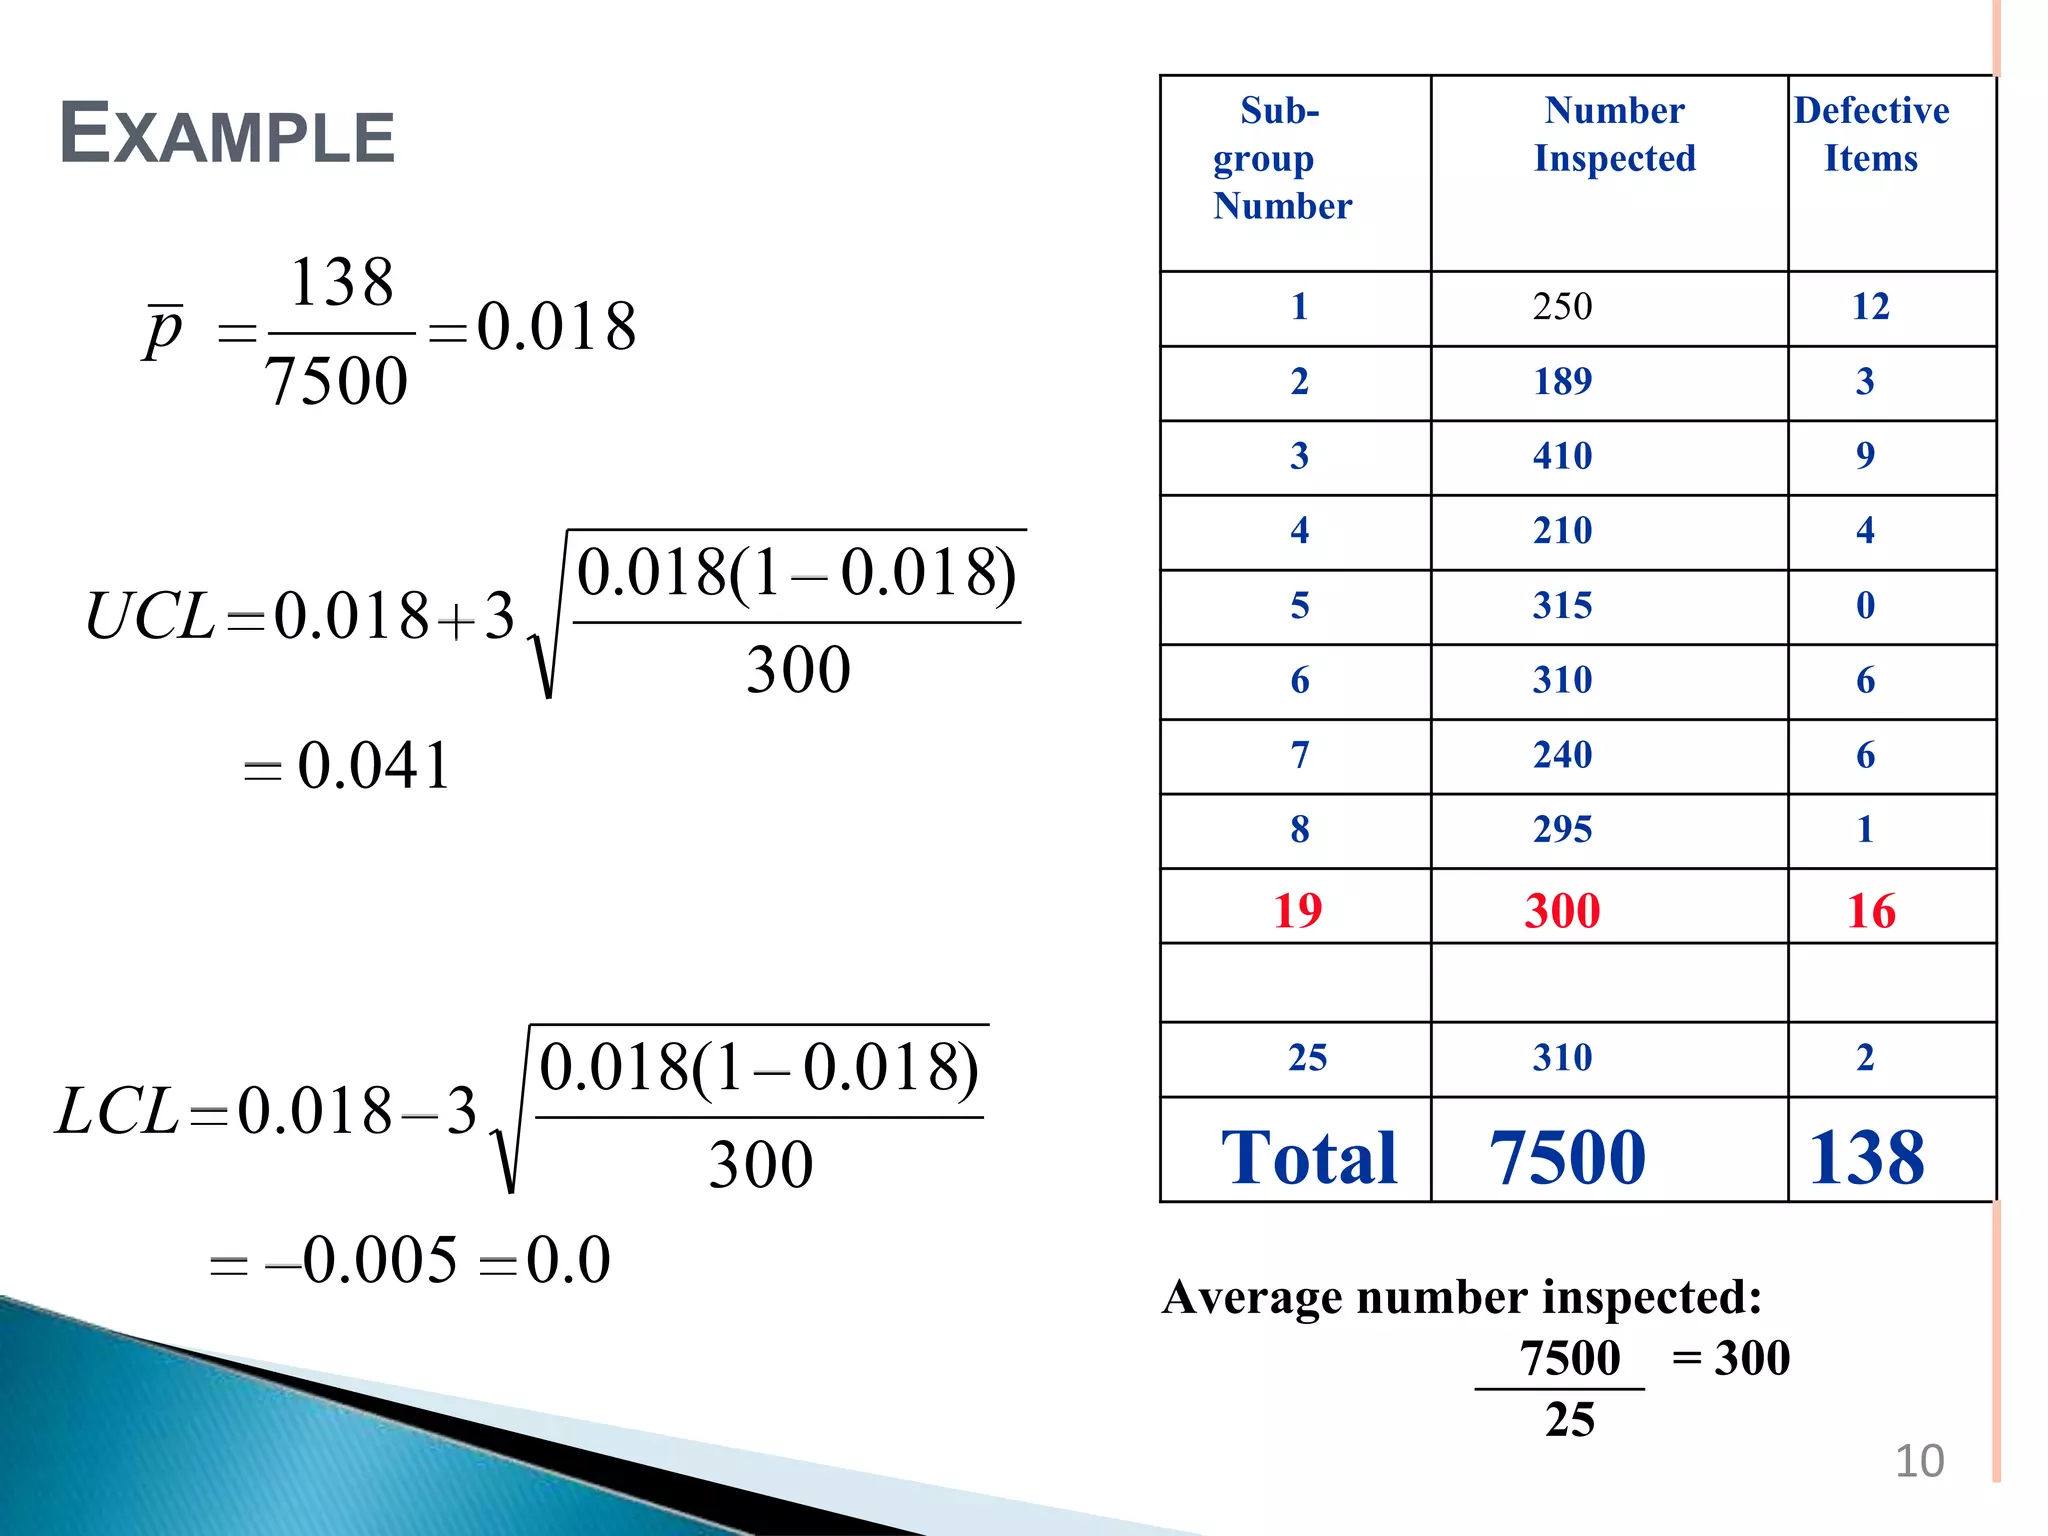
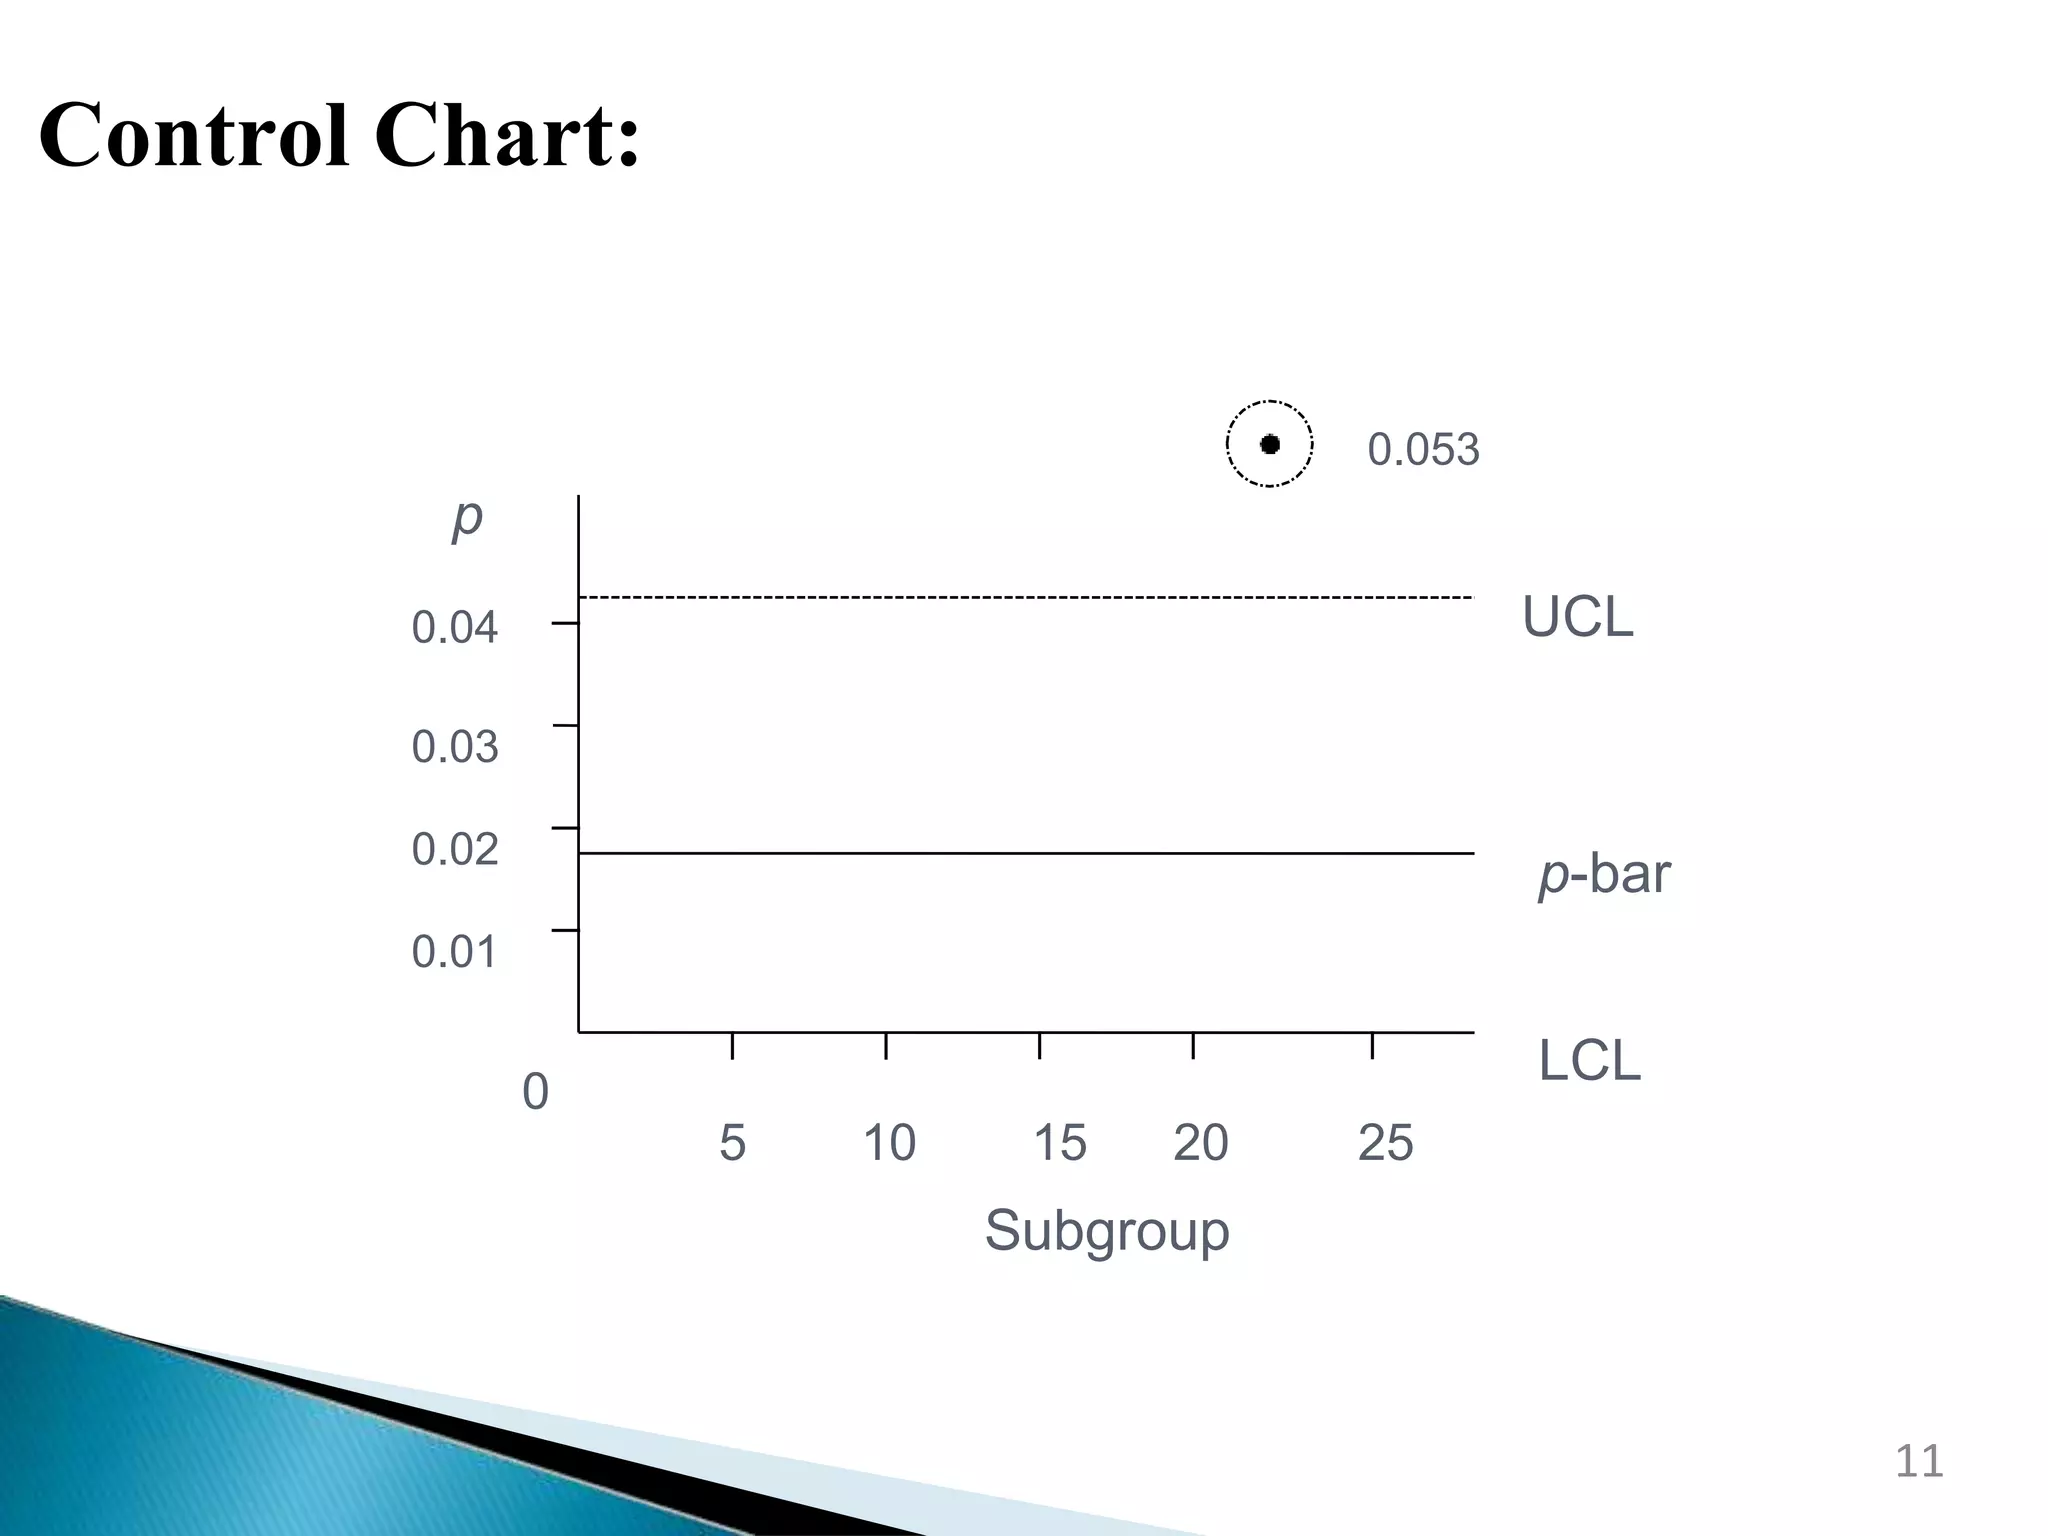
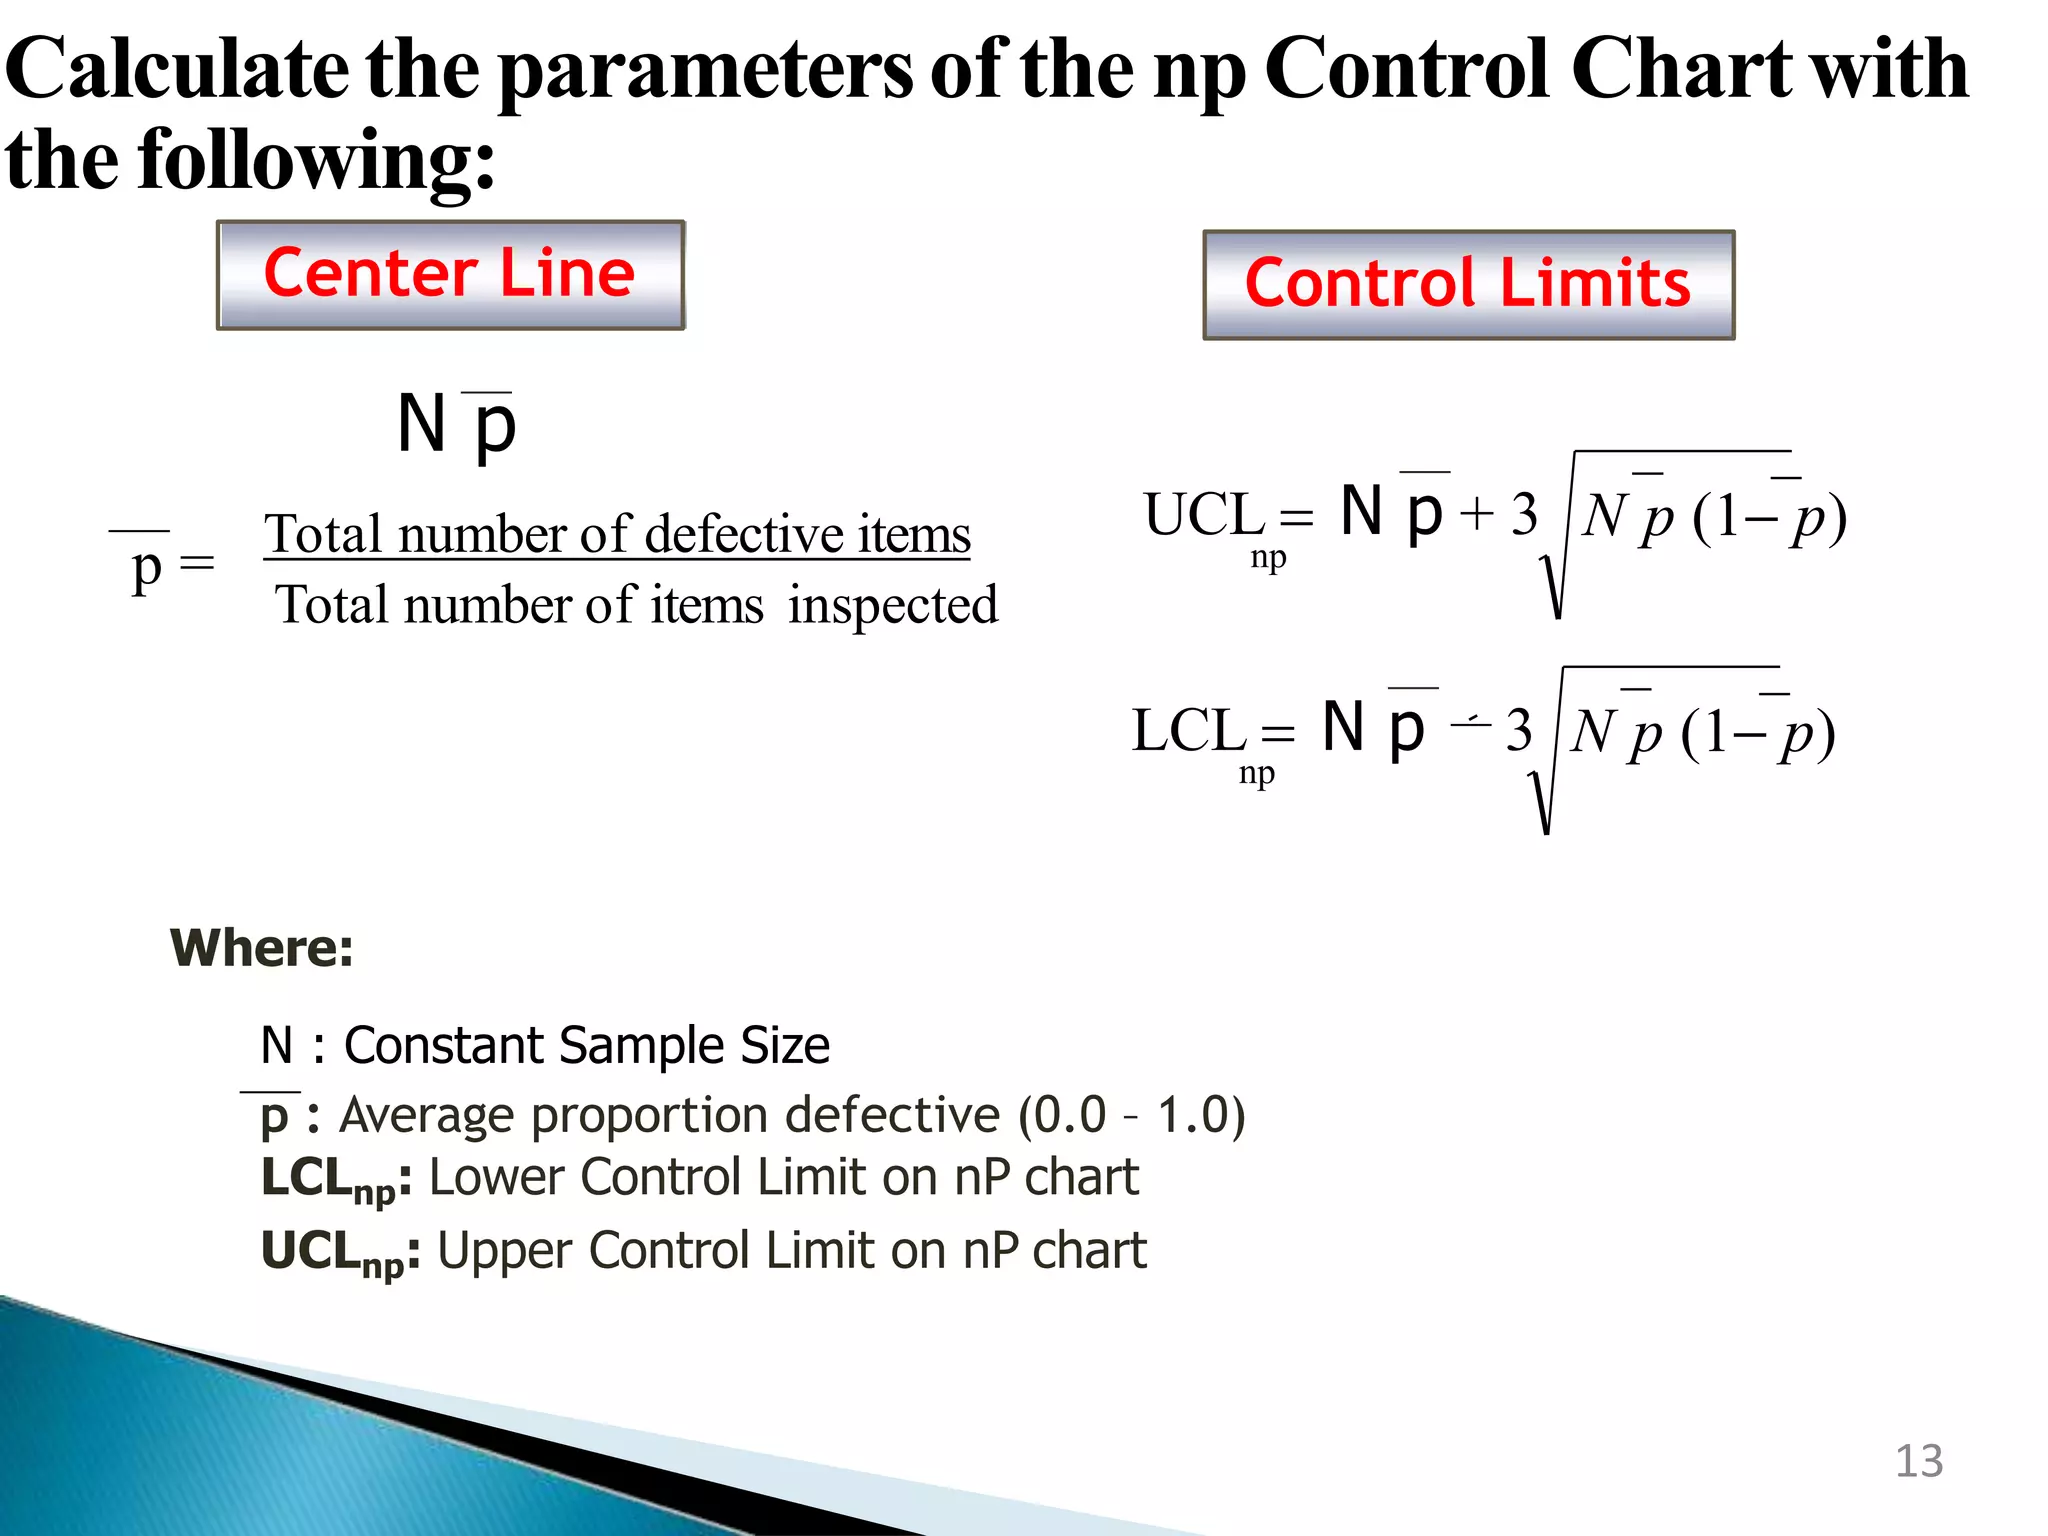
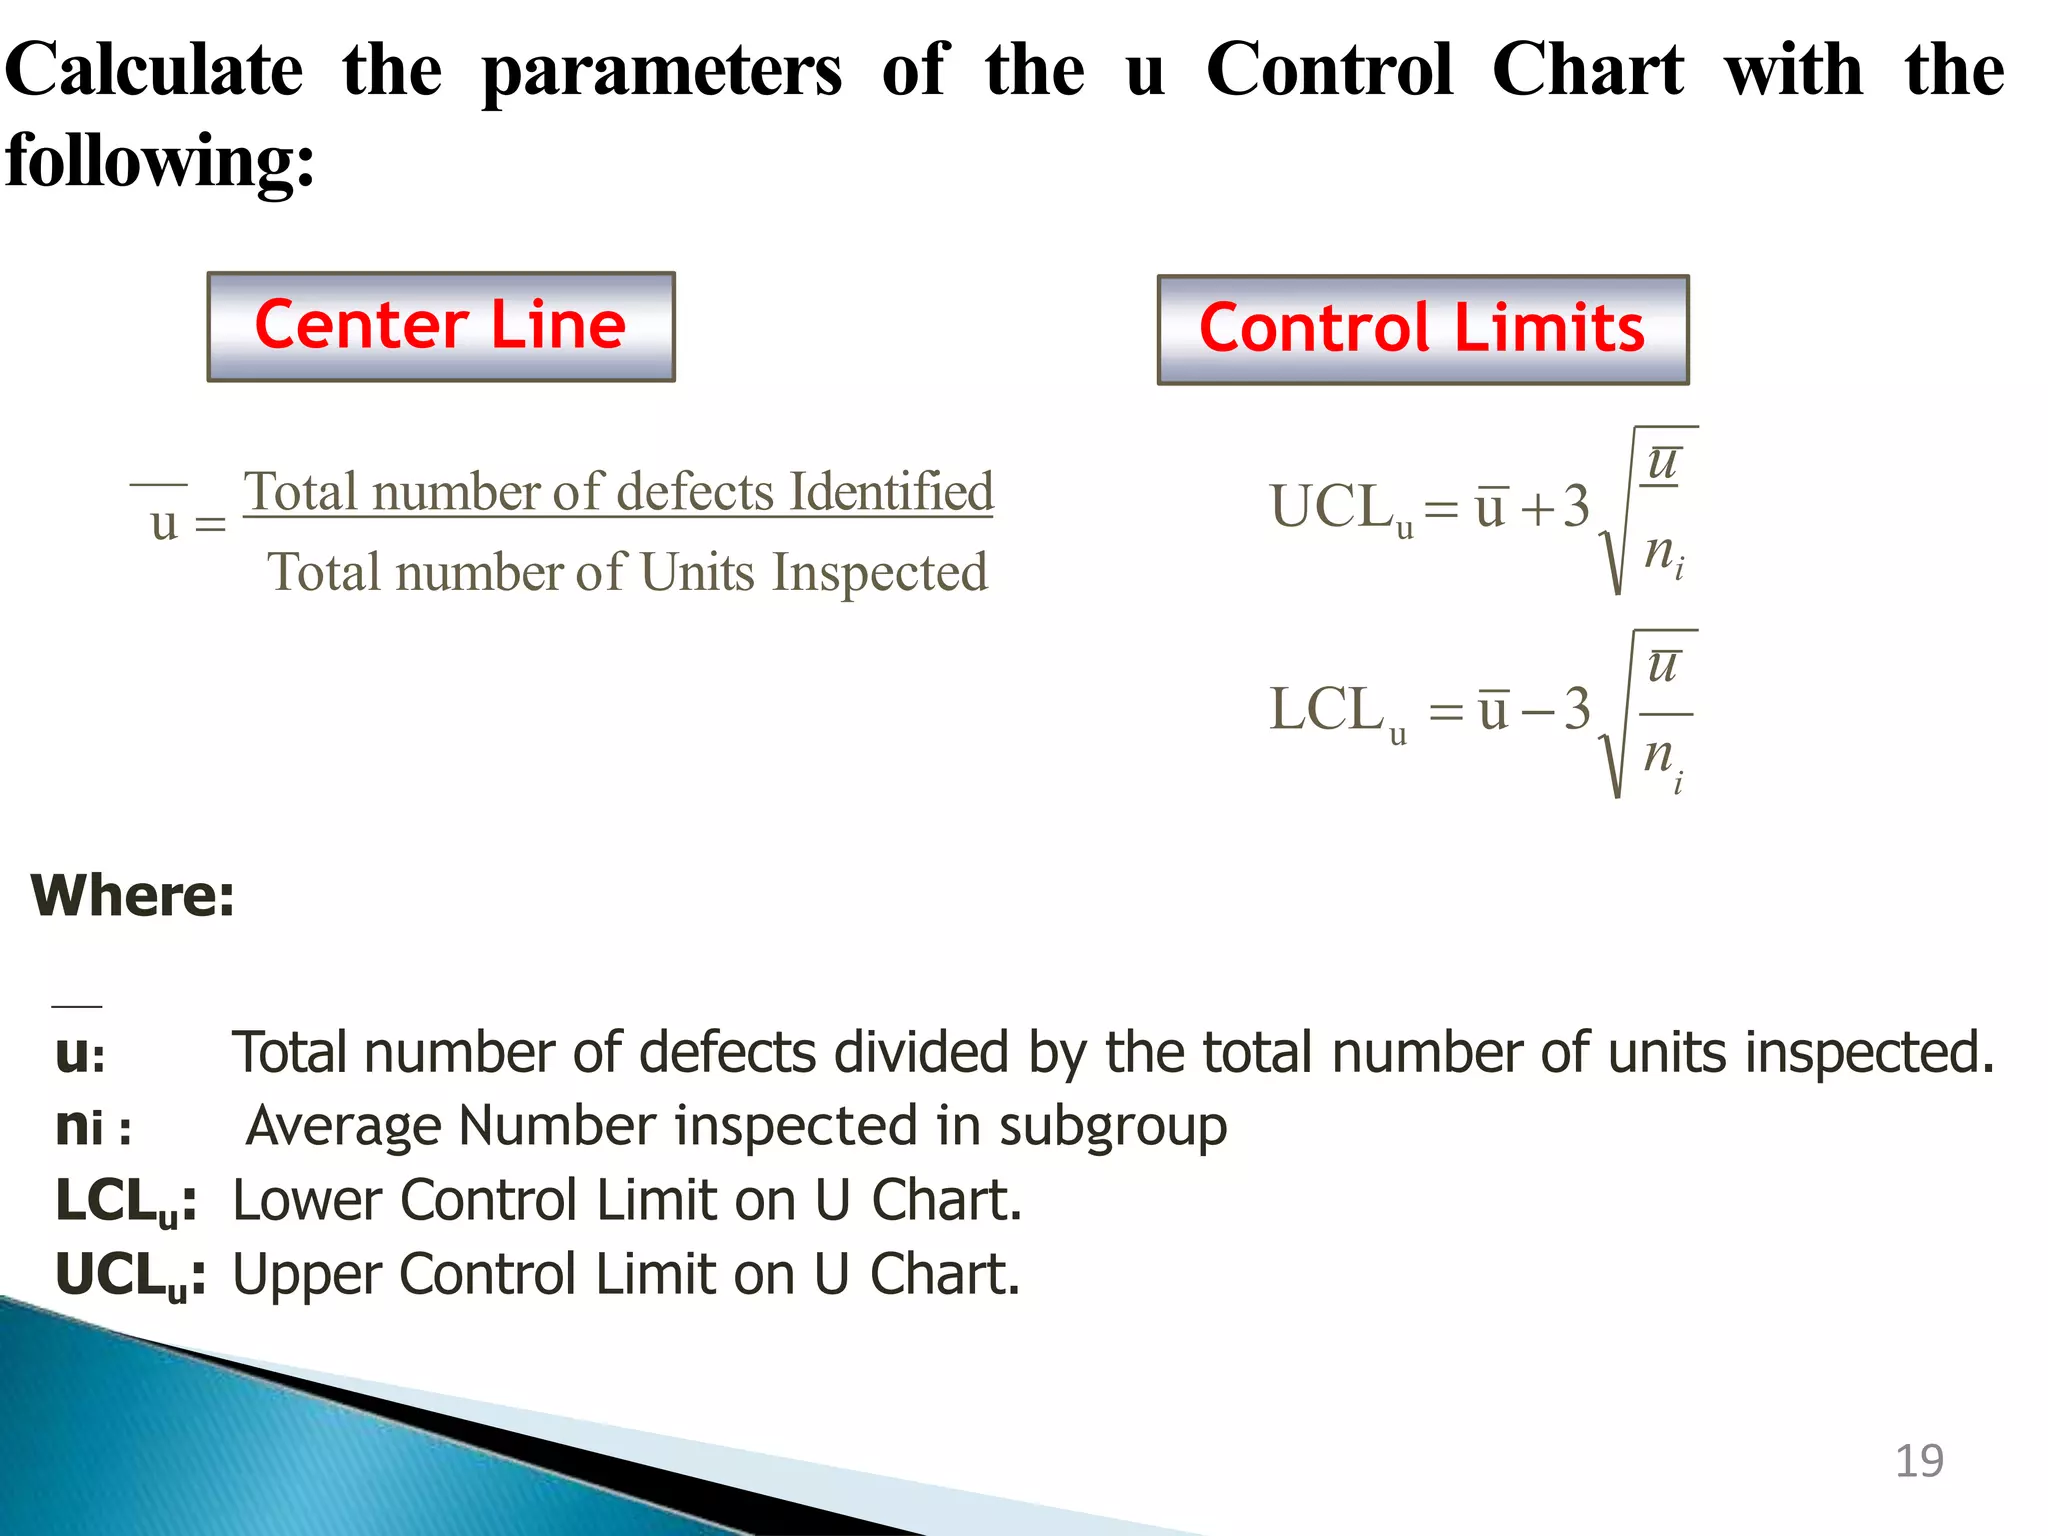
This document discusses control charts for attribute data. It defines an attribute as a quality characteristic that is either conforming or non-conforming. There are four main types of attribute control charts: p charts track the fraction of defective items, np charts track the number of defective items when sample sizes are constant, c charts track the number of defects when sample sizes are constant, and u charts track defects per unit when sample sizes vary. The document provides examples of how to calculate the parameters and create each type of attribute control chart. Advantages of attribute control charts include allowing for quick summaries by classifying items as acceptable or unacceptable and being easily understood by managers unfamiliar with quality control procedures.