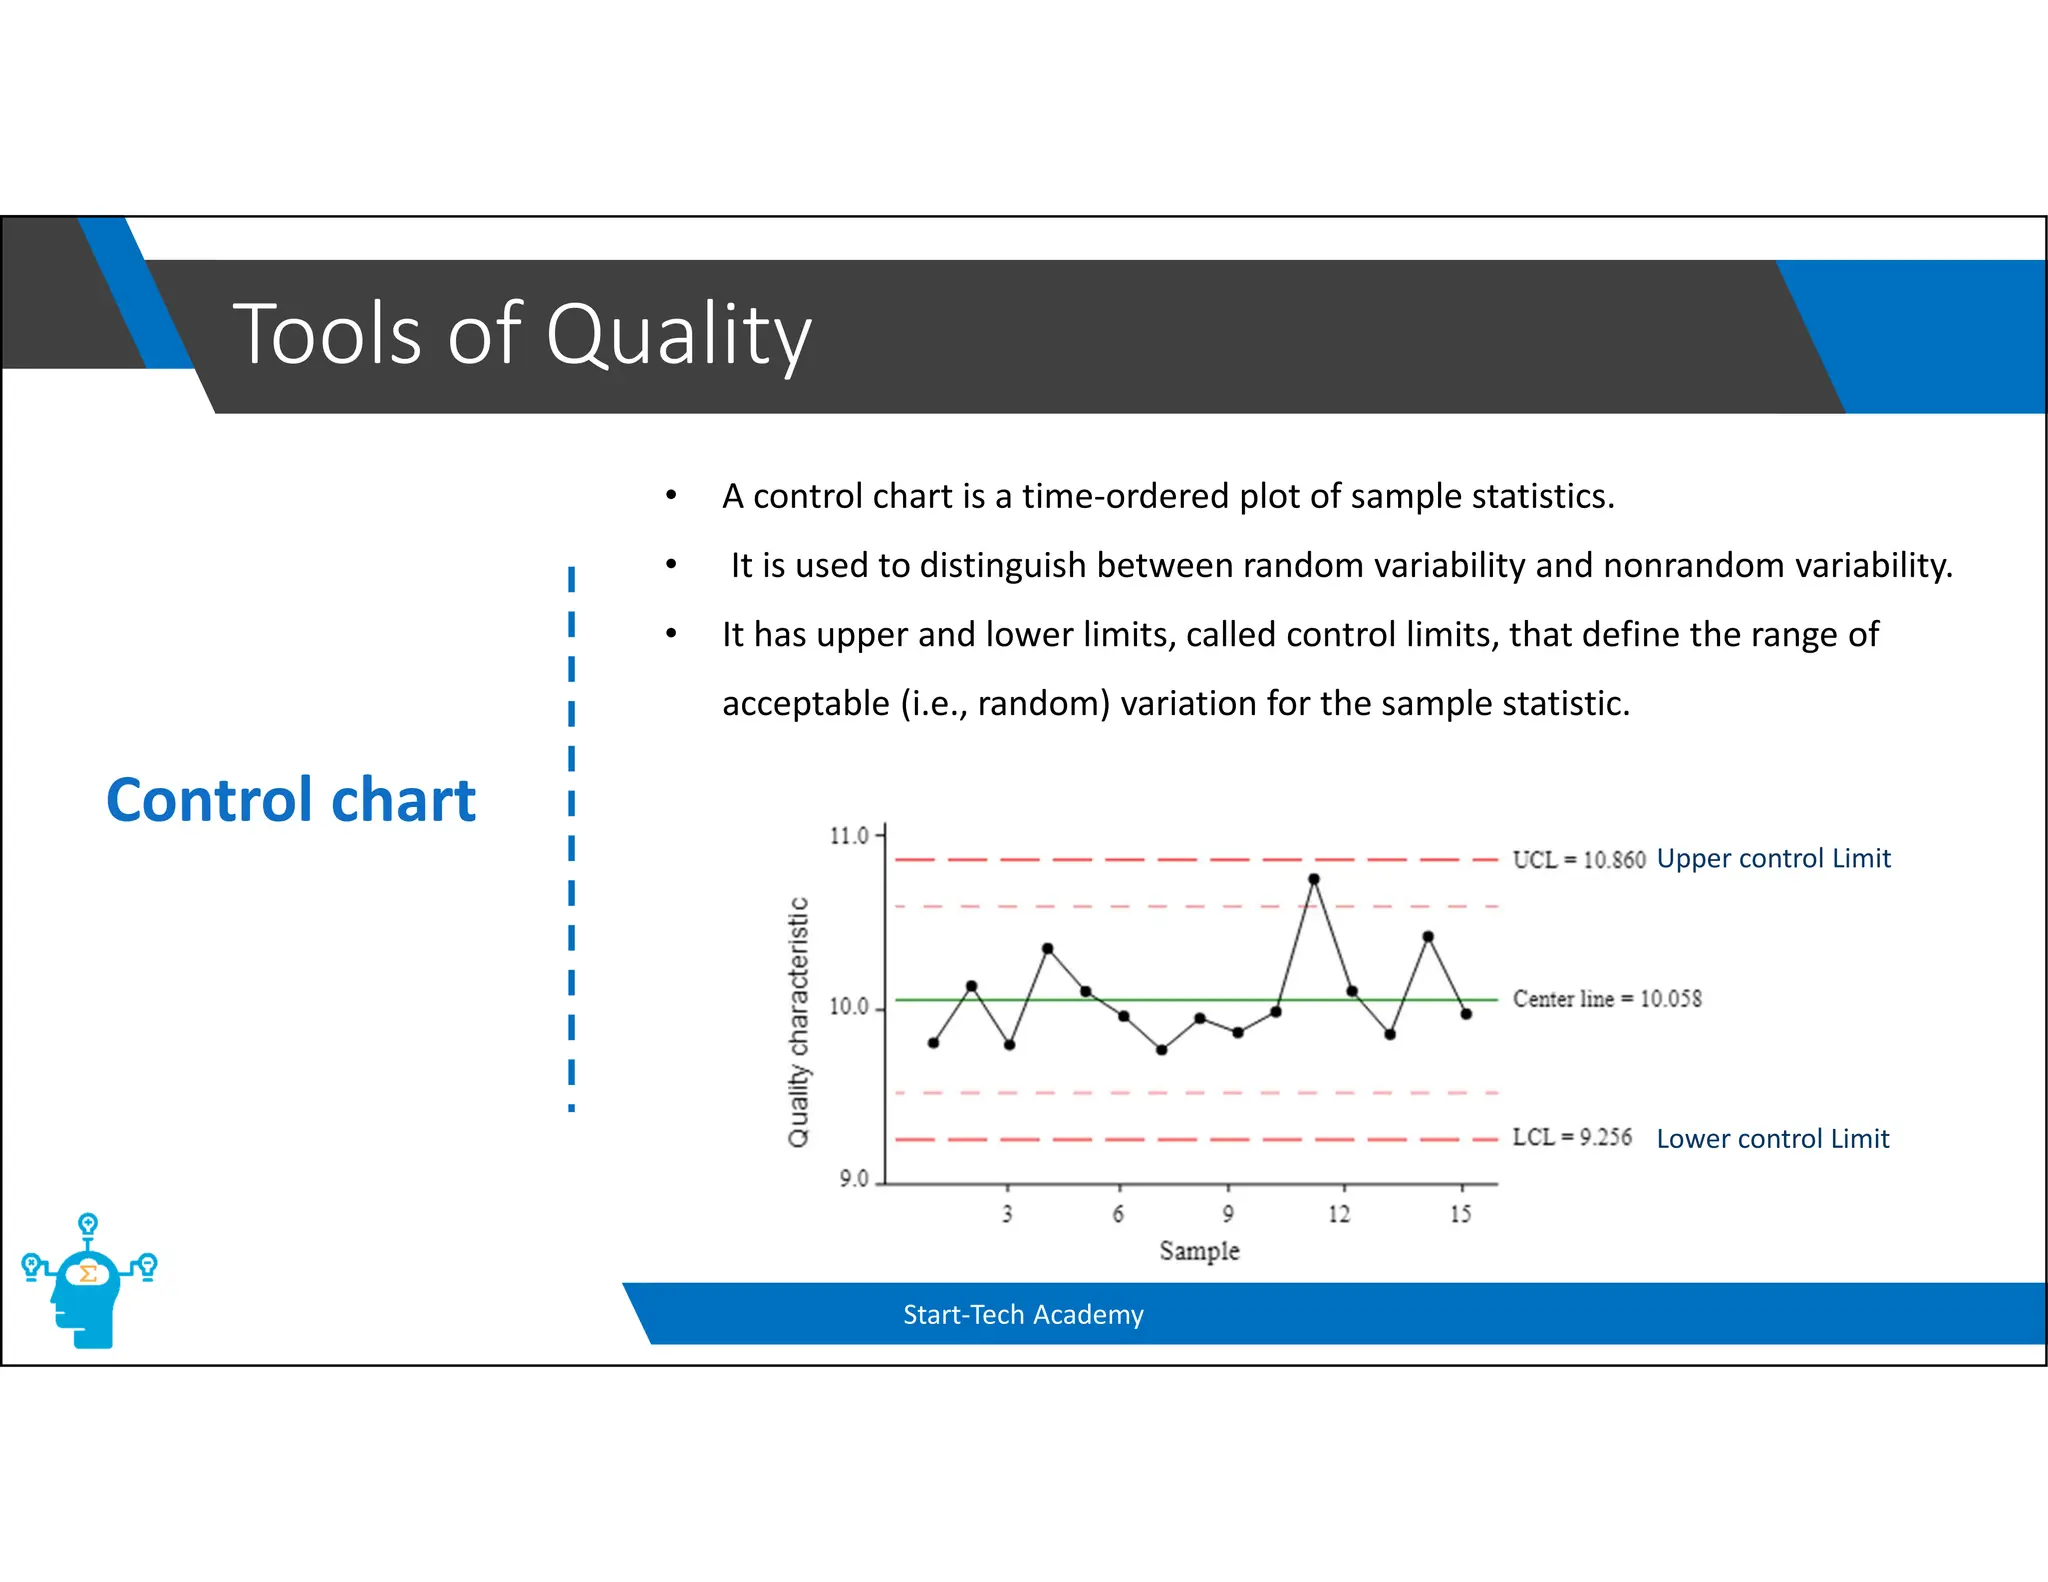
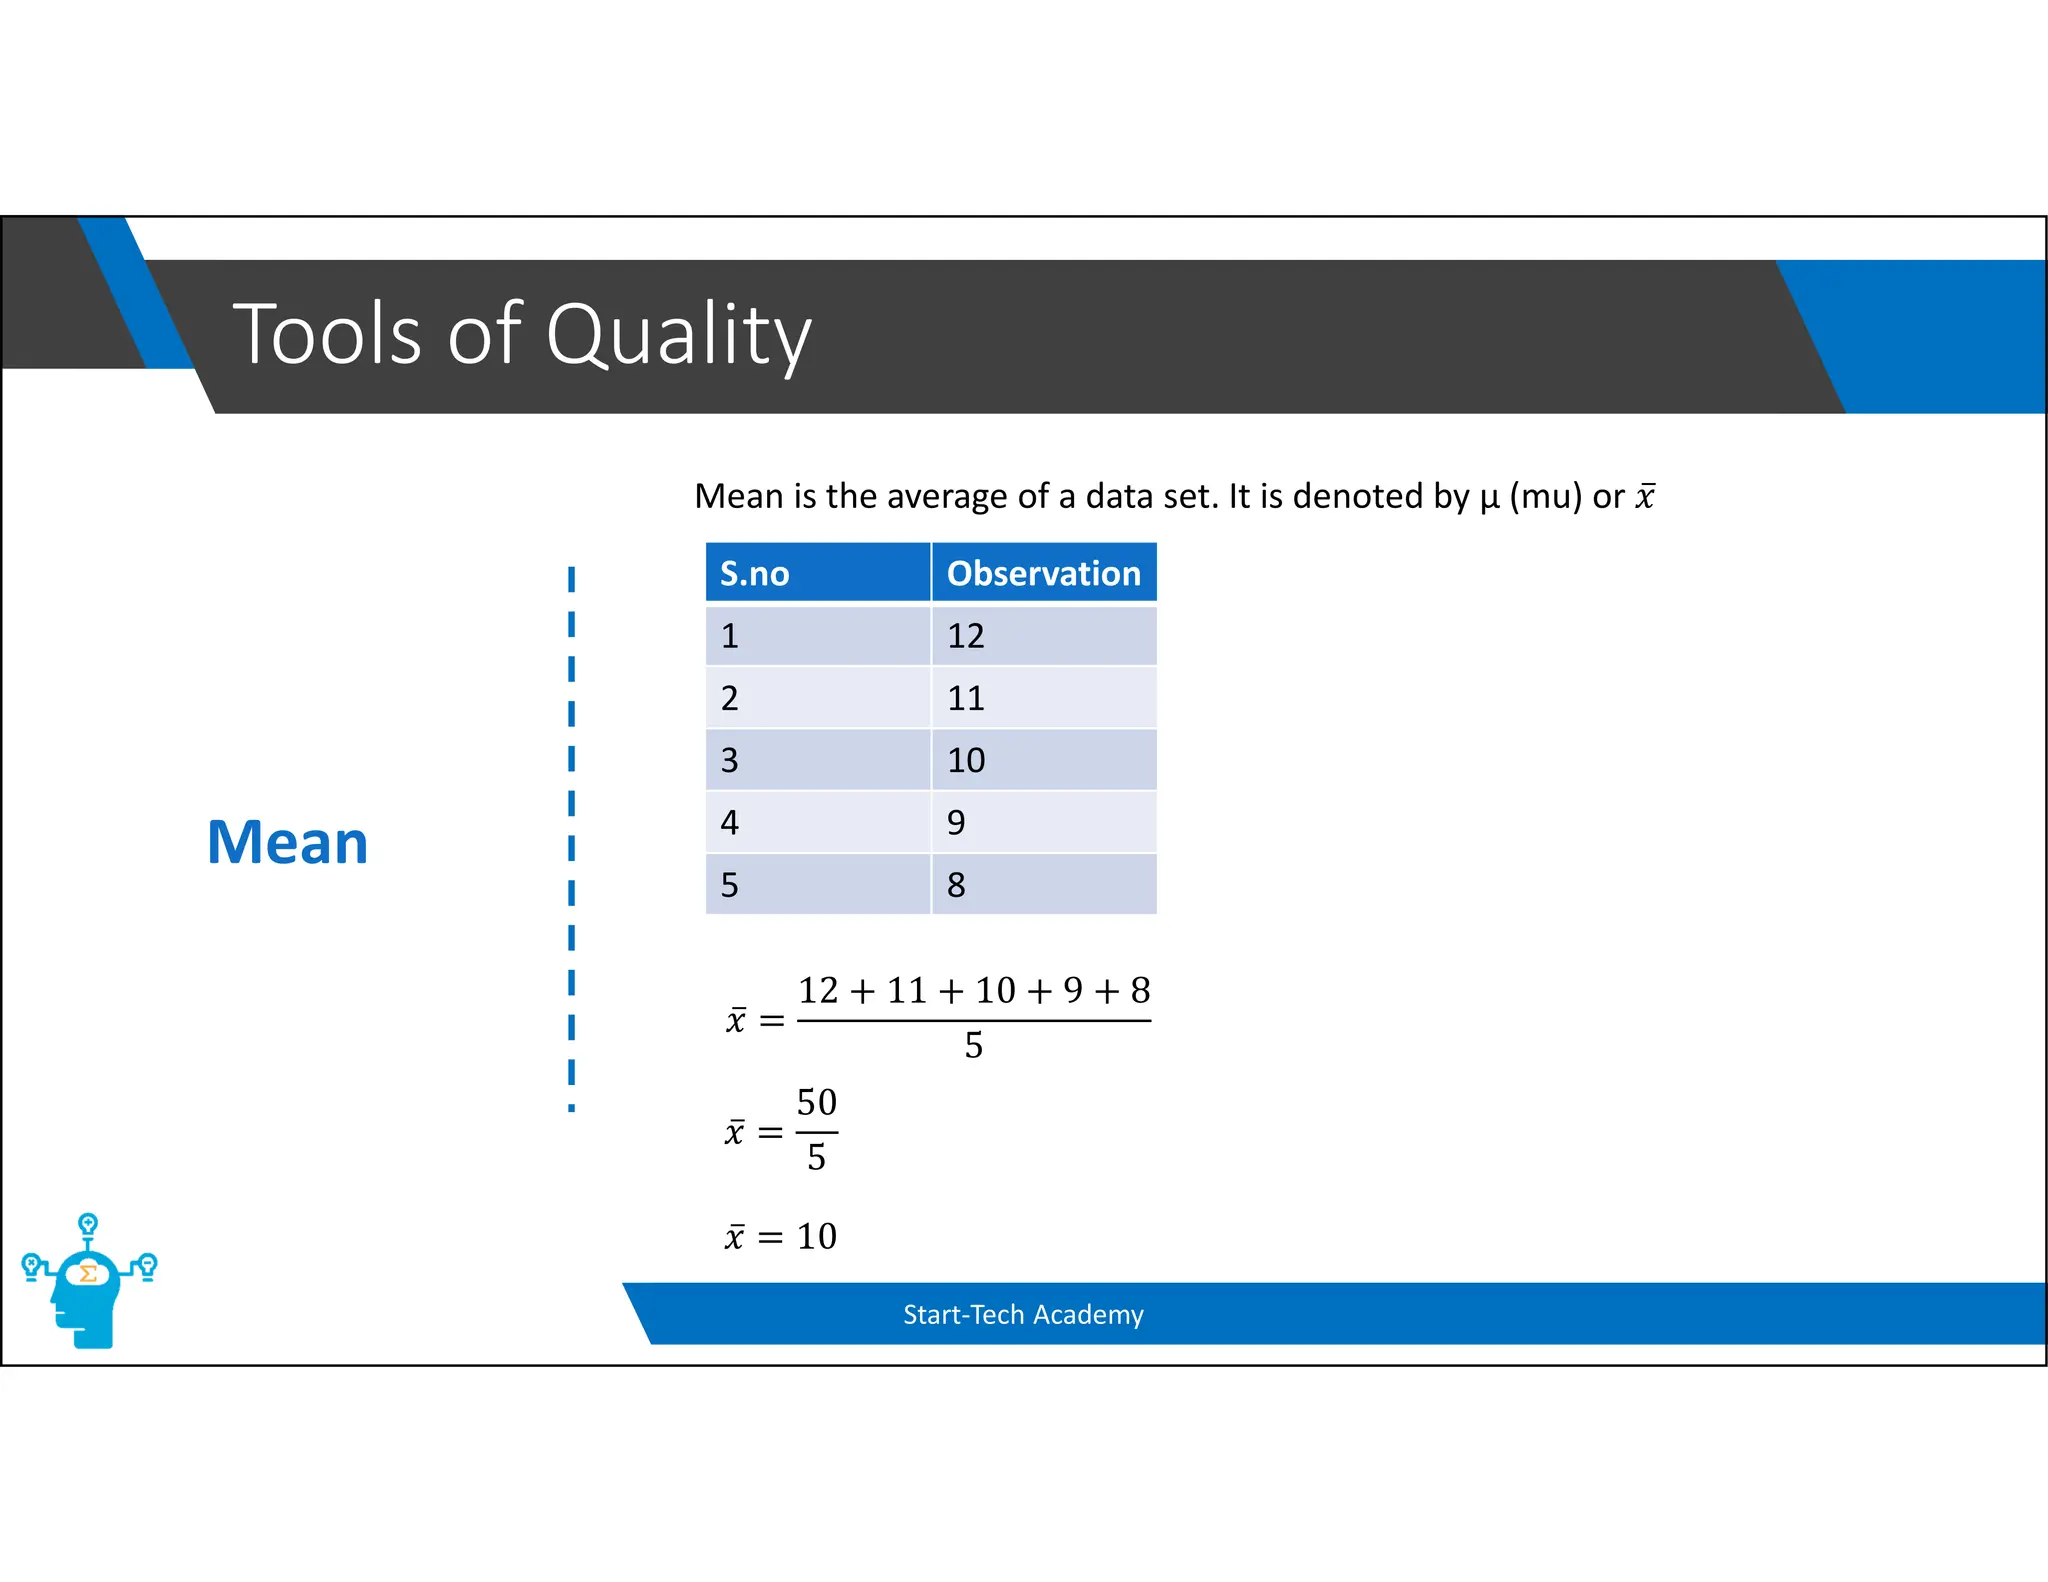
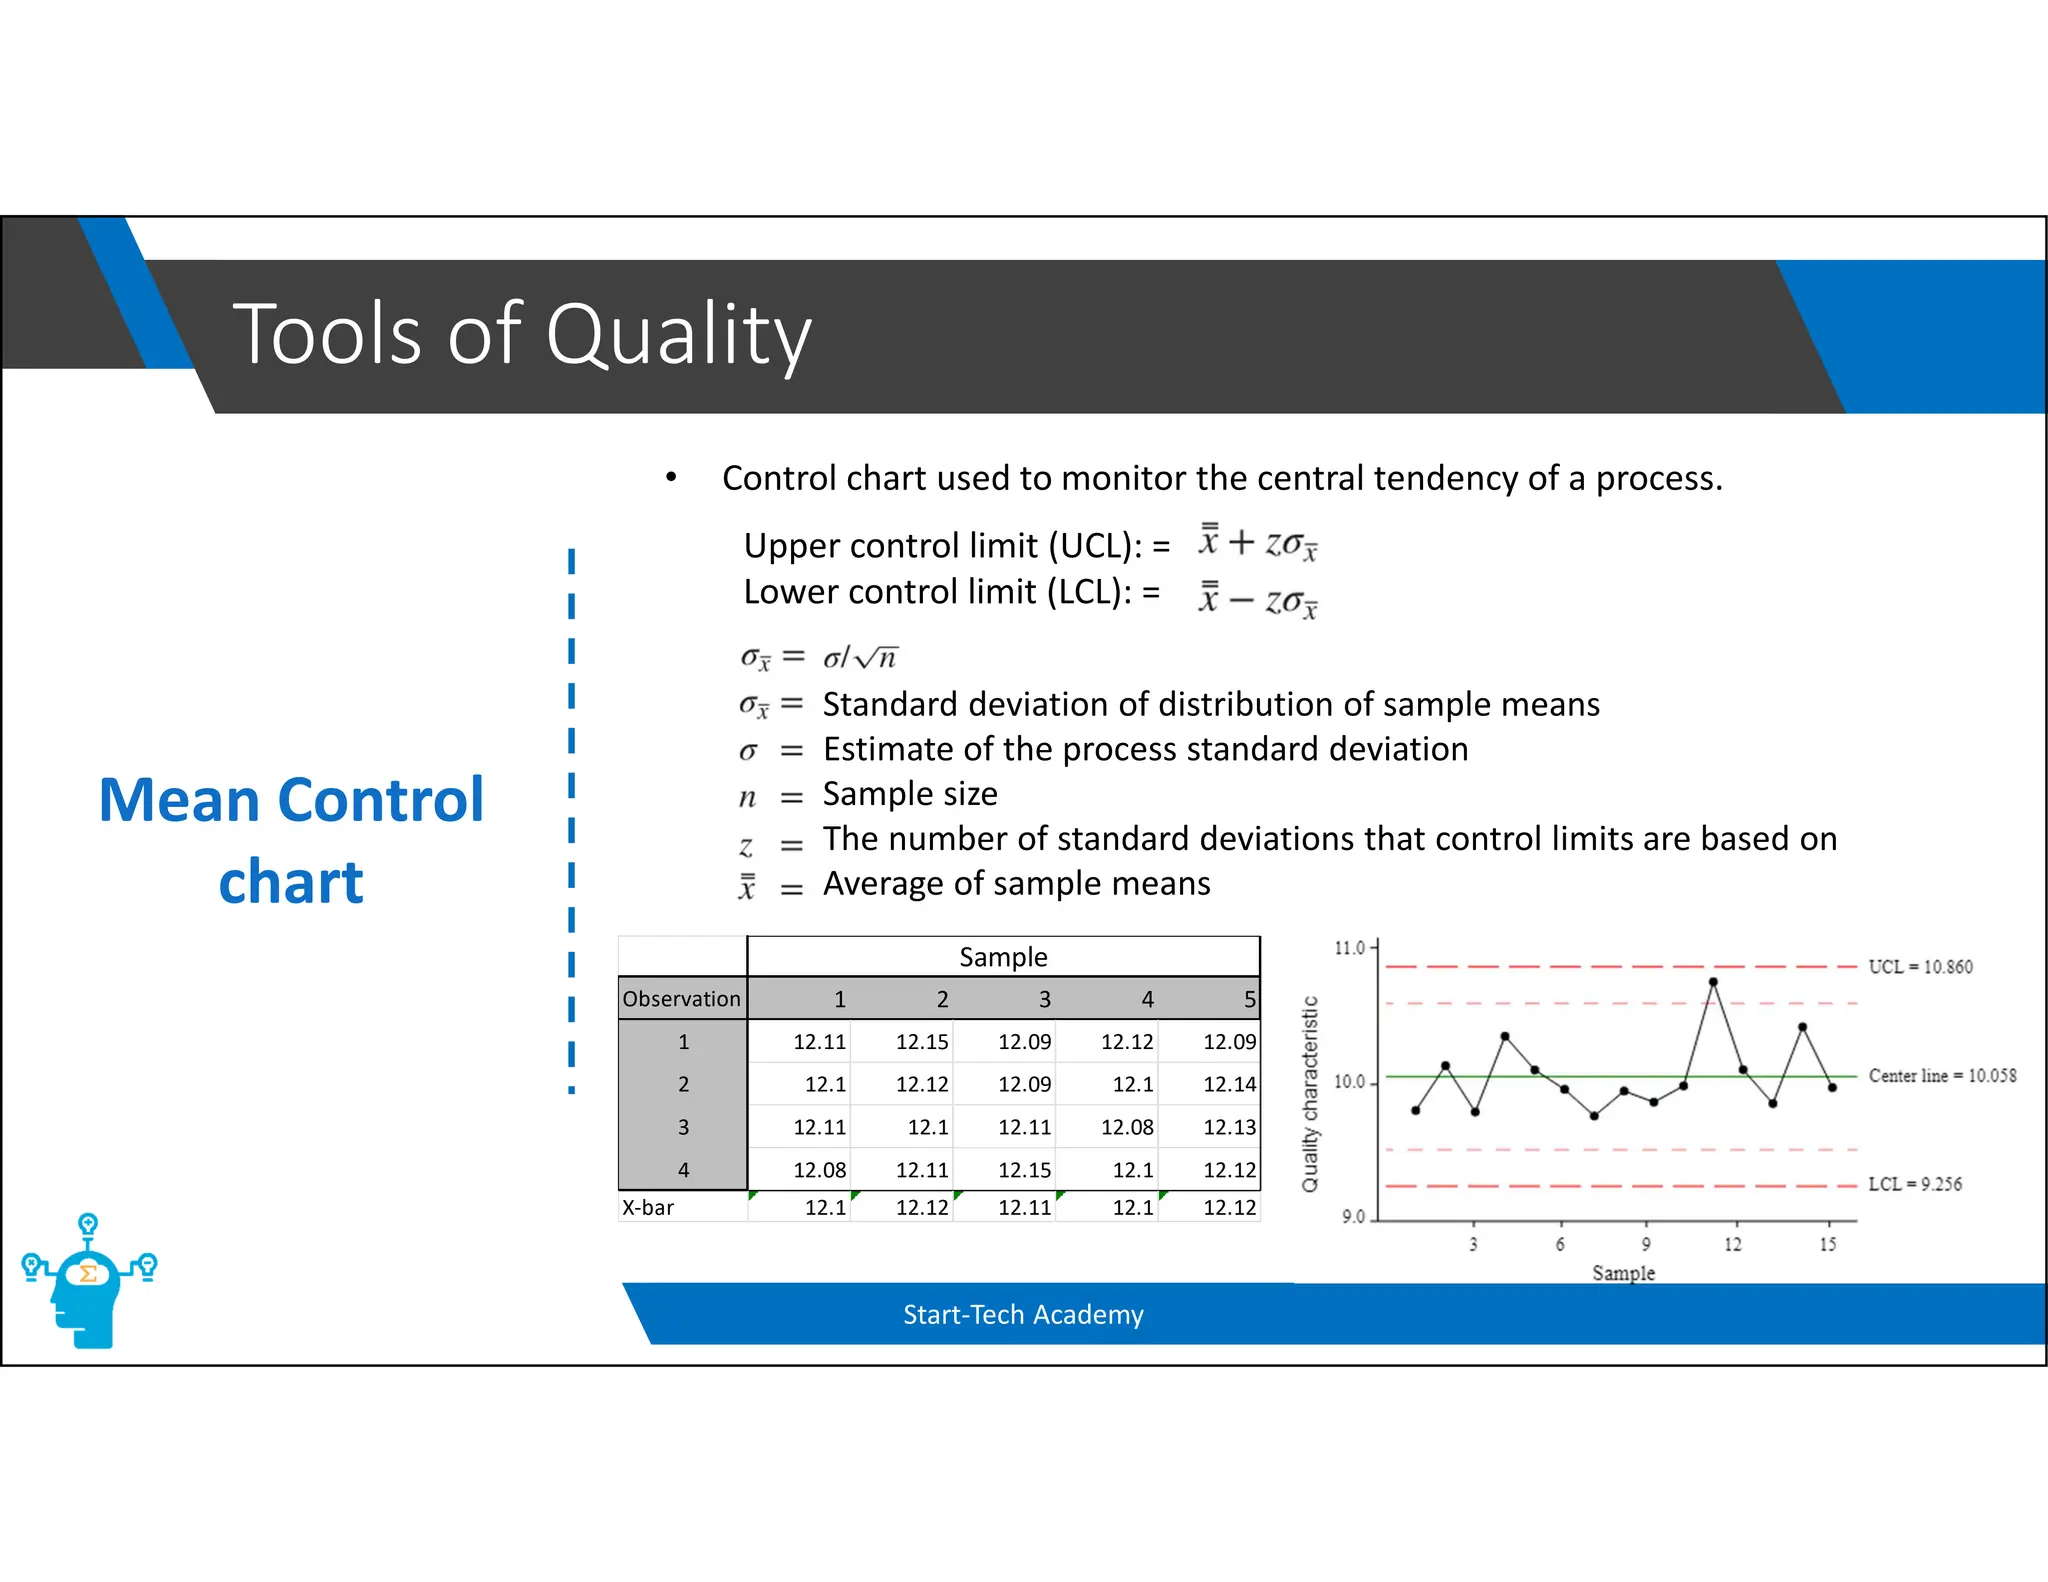
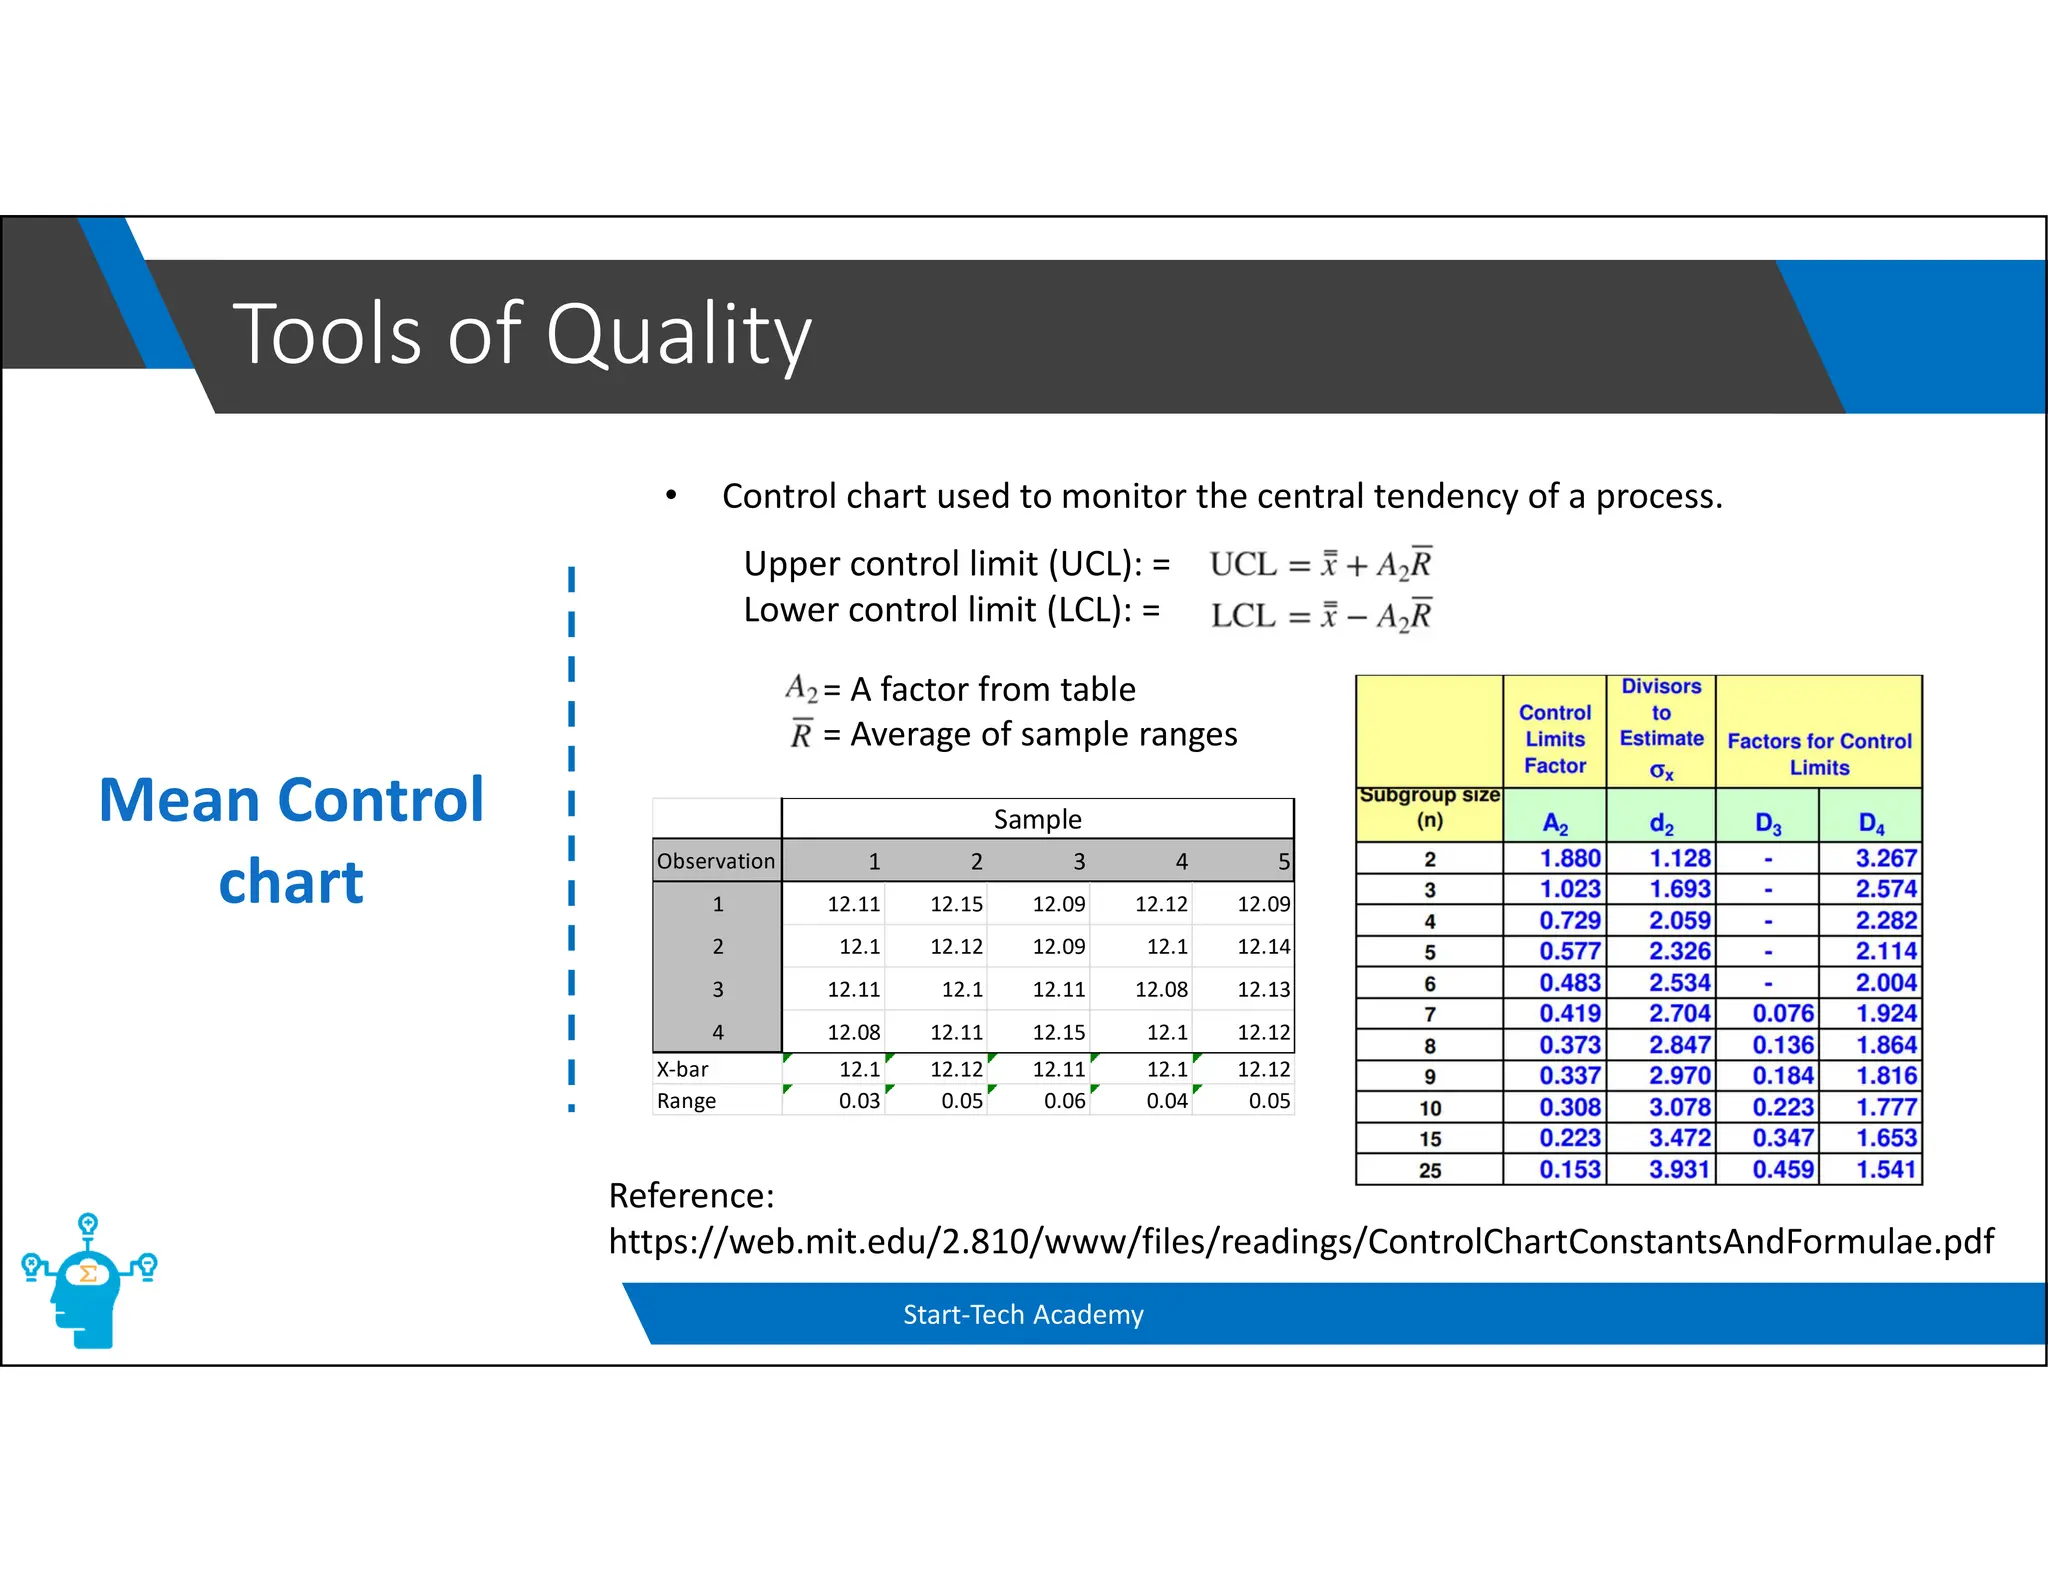
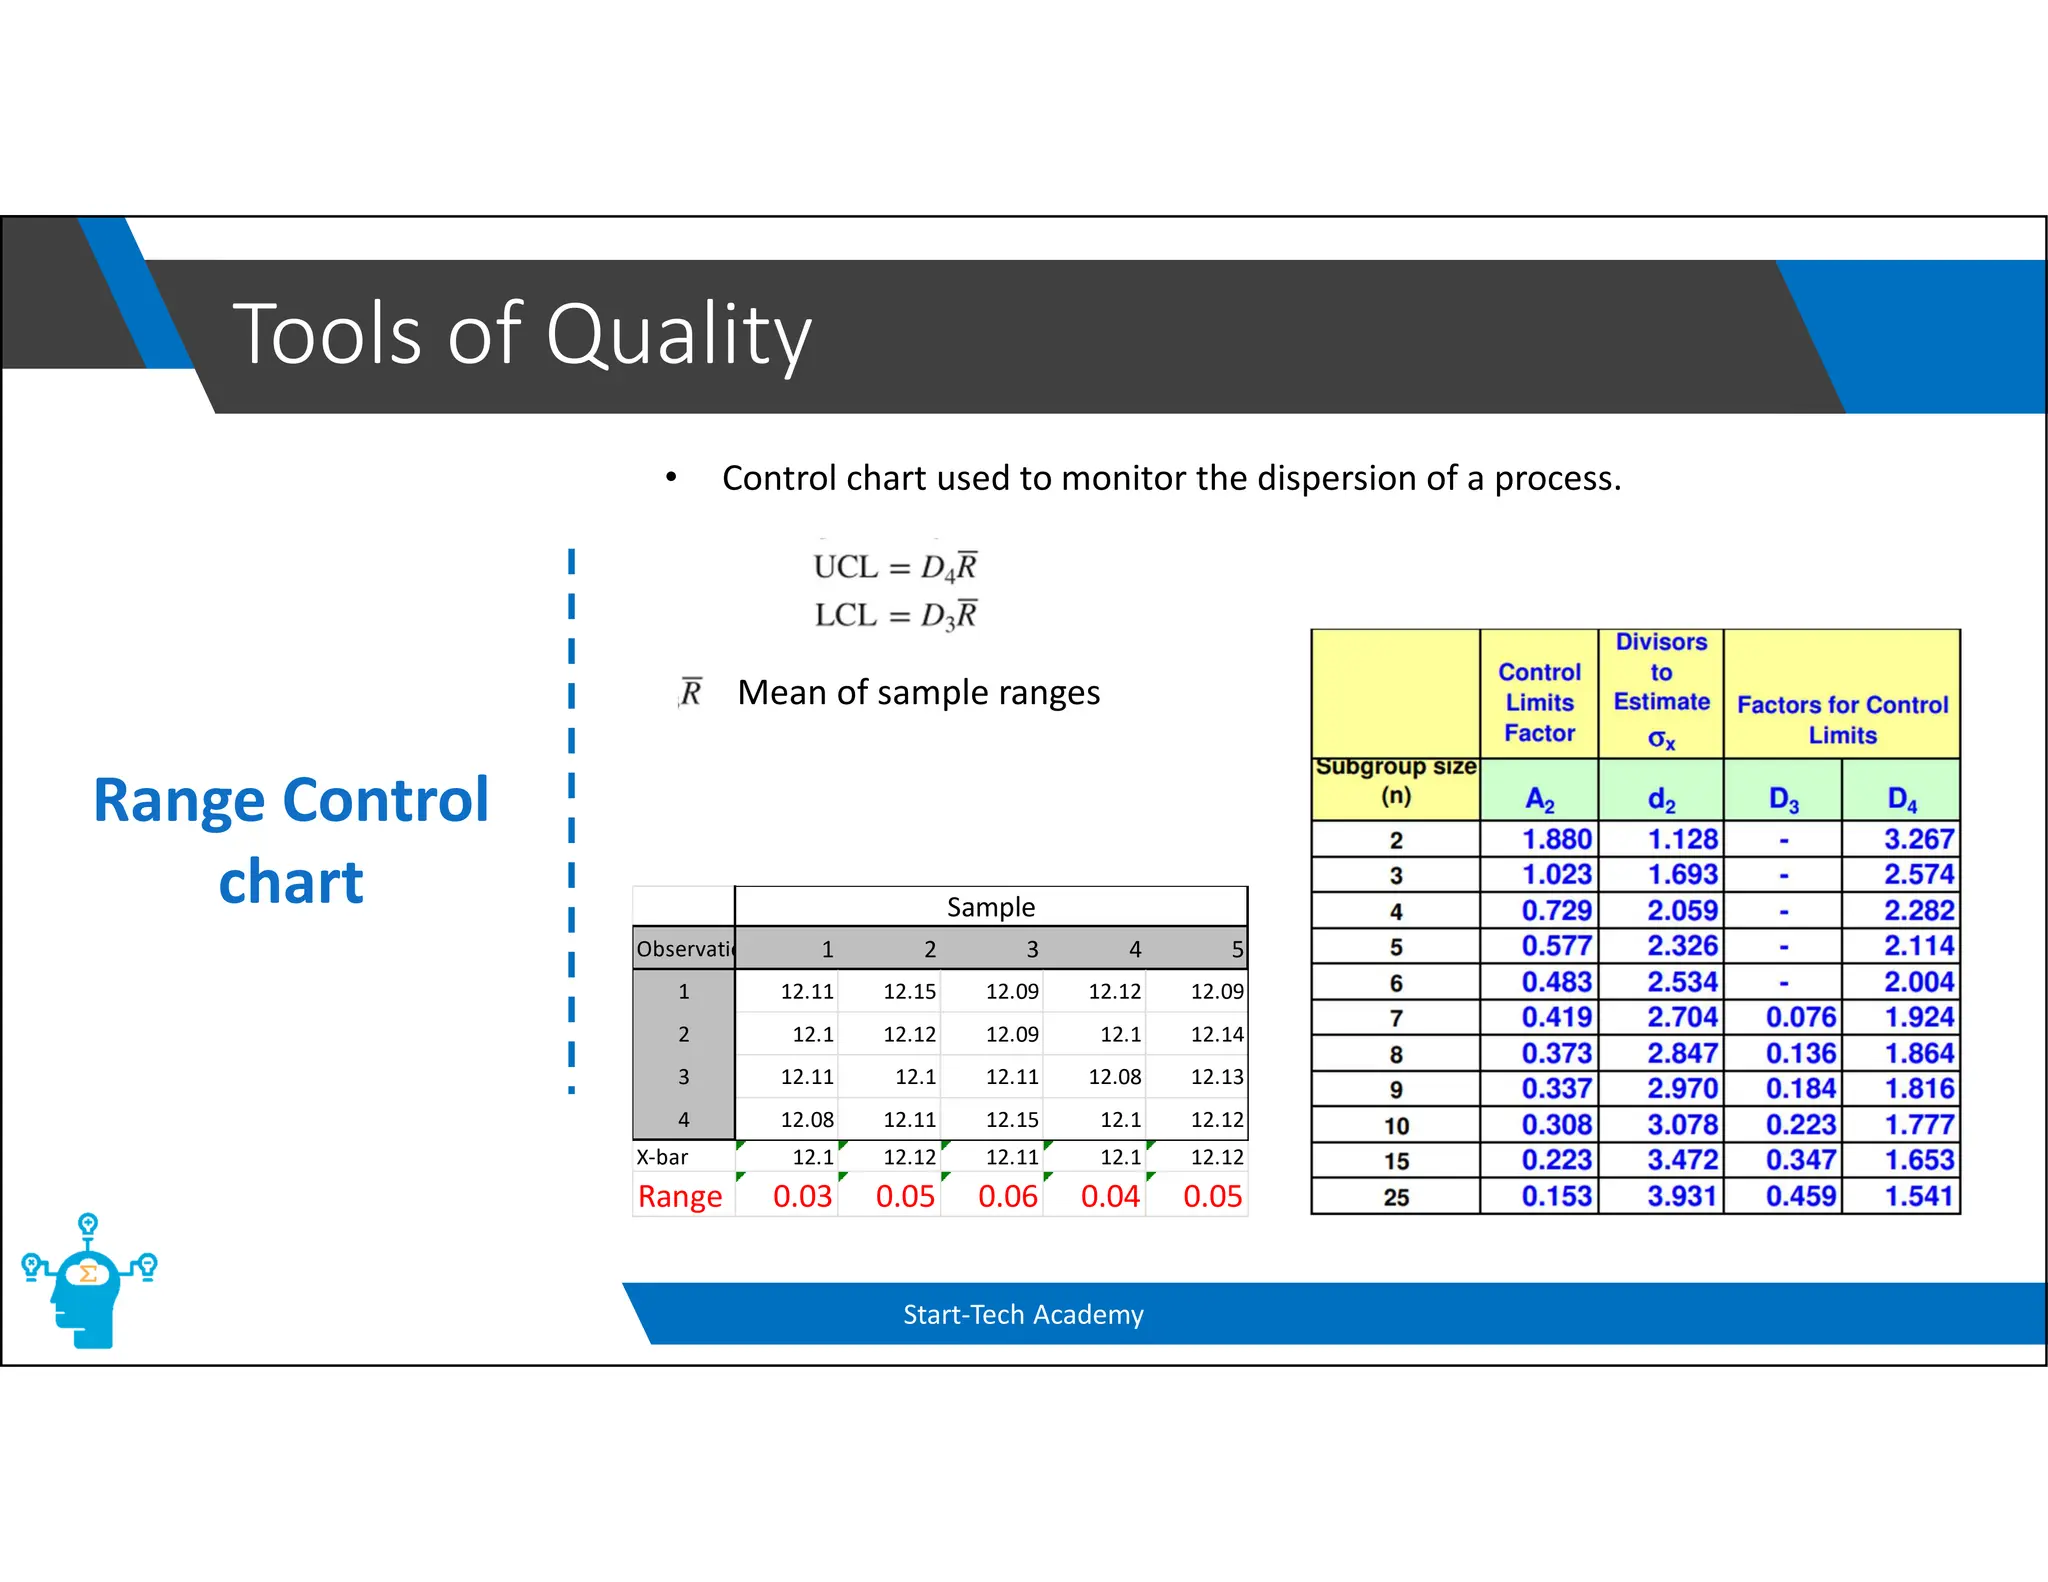
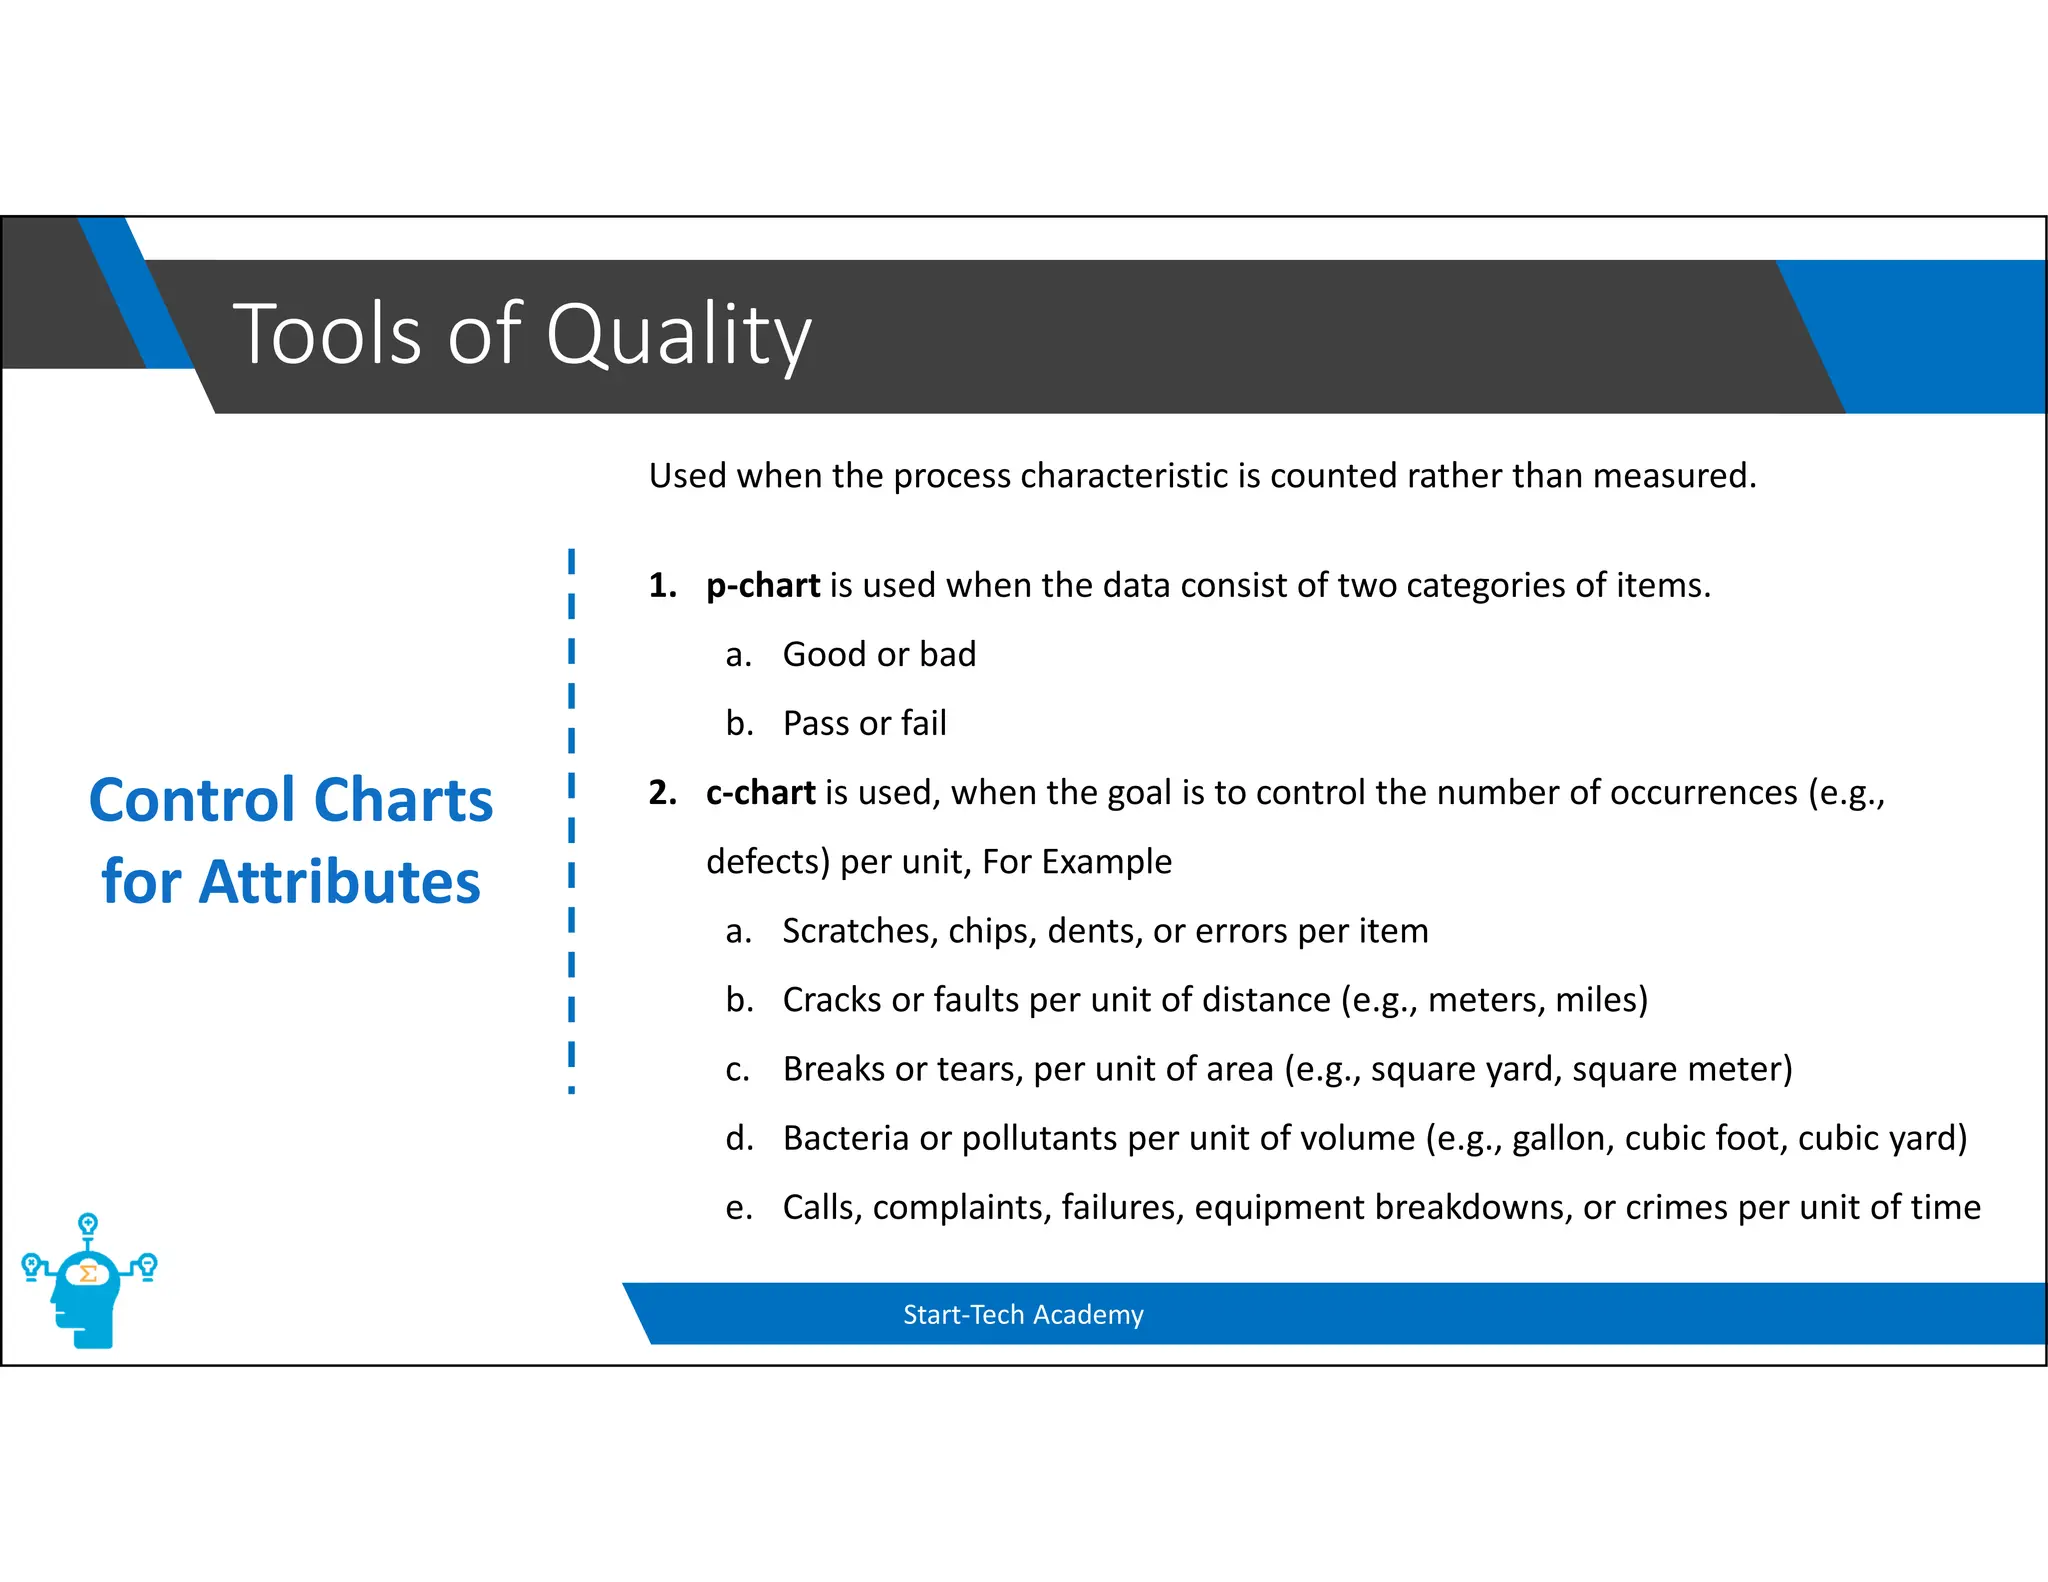
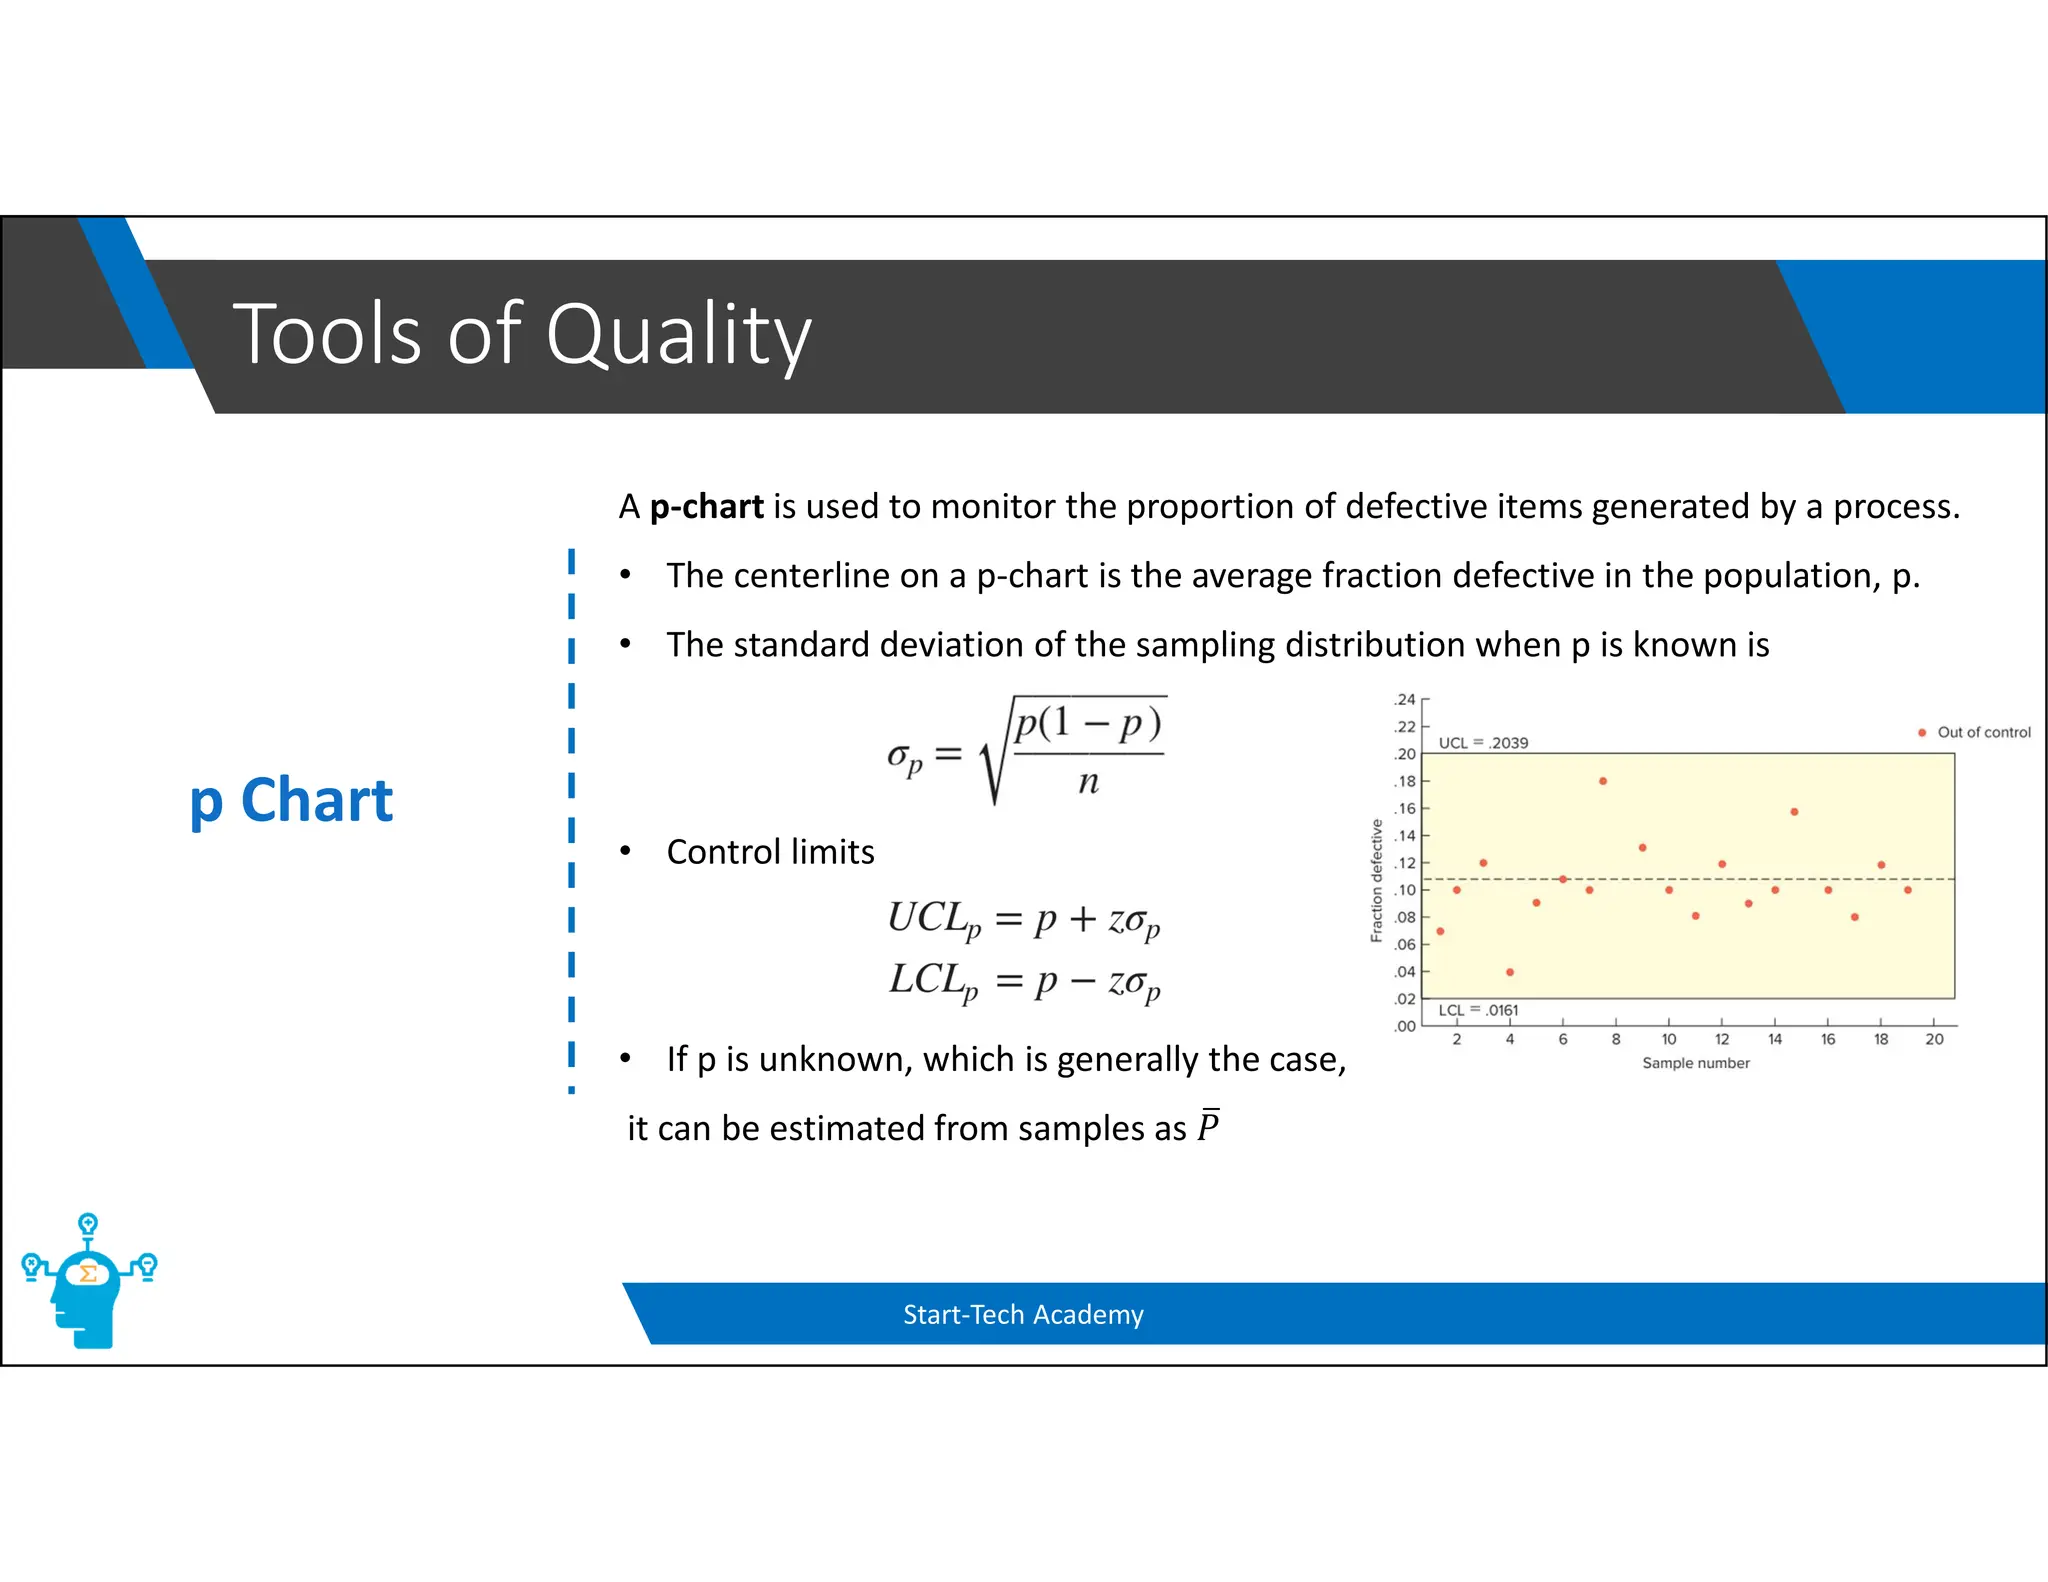
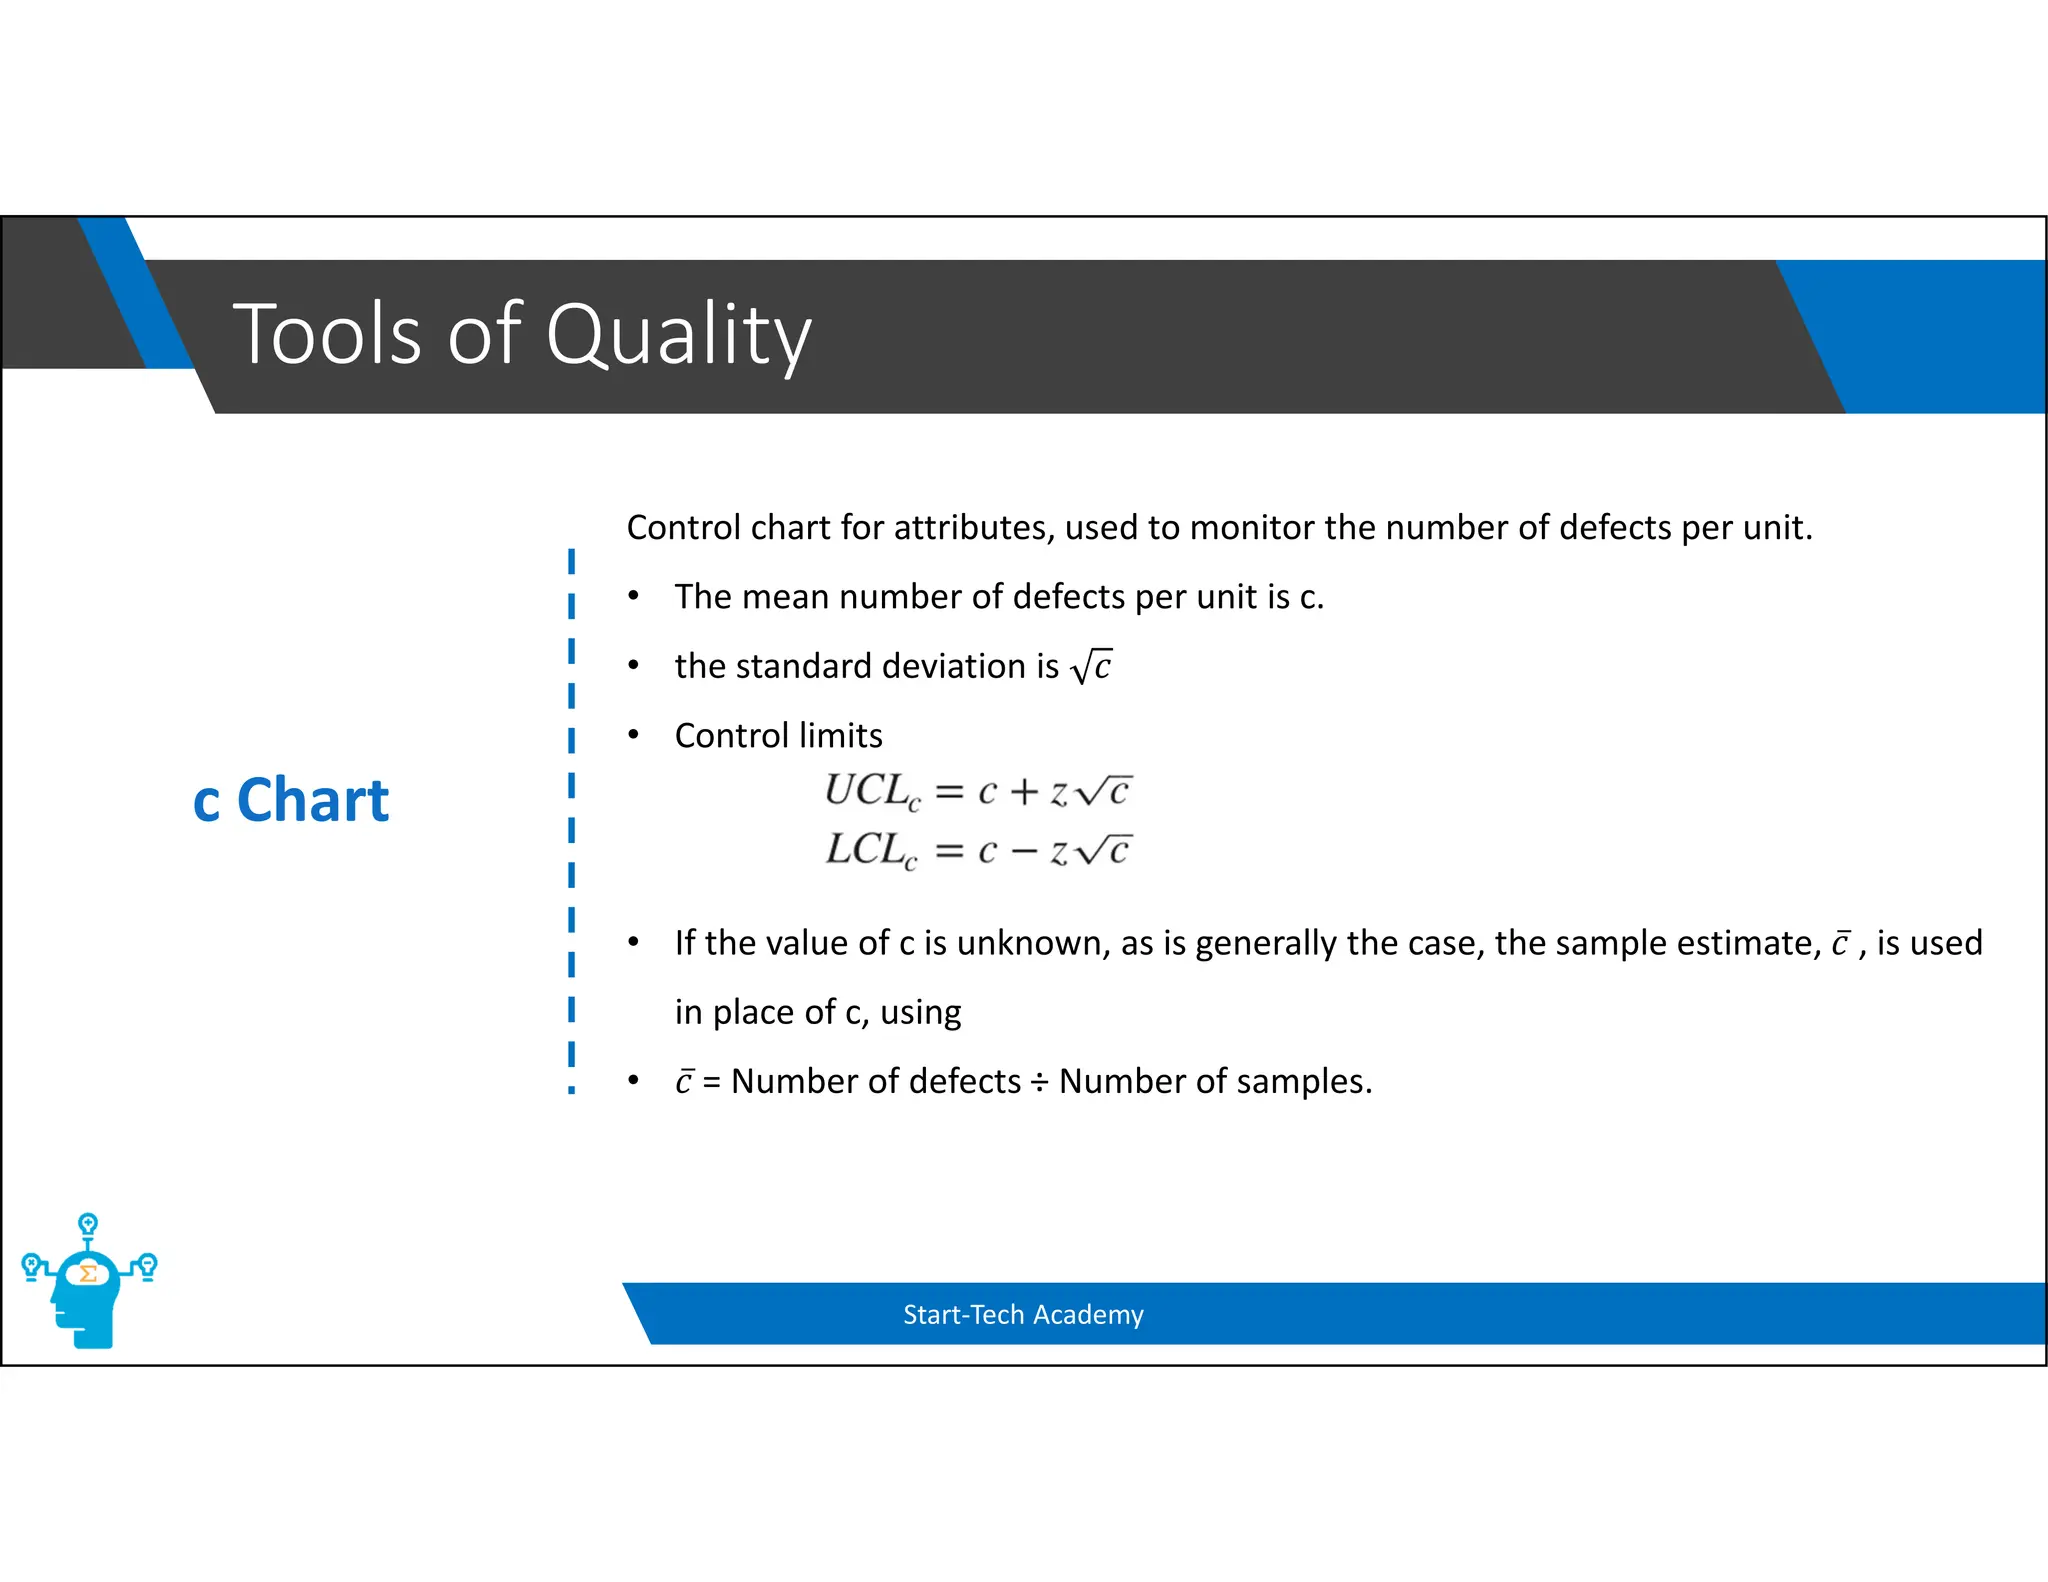
The document provides an overview of control charts, tools used in quality control to distinguish between random and nonrandom variability in processes. It explains key concepts such as mean, standard deviation, and types of control charts (mean, range, p-chart, c-chart) with their specific applications. Additionally, it includes formulas for calculating control limits and understanding sample statistics.


![Control Charts[1]](https://cdn.slidesharecdn.com/ss_thumbnails/controlcharts1-1226081330857138-9-thumbnail.jpg?width=640&height=640&fit=bounds)
![Control Charts[1]](https://cdn.slidesharecdn.com/ss_thumbnails/controlcharts1-1226961283054520-8-thumbnail.jpg?width=640&height=640&fit=bounds)


![Control charts[1]](https://cdn.slidesharecdn.com/ss_thumbnails/controlcharts1-100924110931-phpapp01-thumbnail.jpg?width=640&height=640&fit=bounds)


![ict_presentation_final_final_final[1].pptx](https://cdn.slidesharecdn.com/ss_thumbnails/ictpresentationfinalfinalfinal1-251230145259-2b4839bd-thumbnail.jpg?width=640&height=640&fit=bounds)


