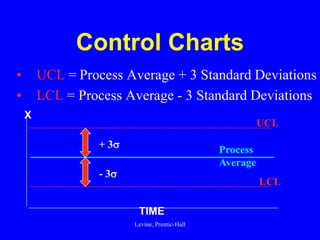
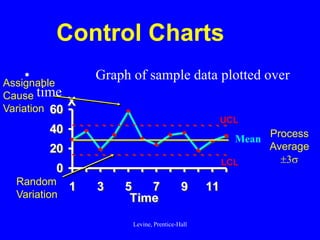
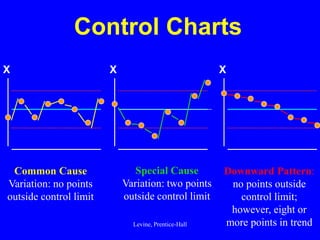
Control charts are statistical tools used for monitoring variation in product or service characteristics over time. They can evaluate past performance and improve processes using upper and lower control limits, and can be applied to both categorical and interval/ratio data through various chart types. Overall, control charts help identify common and special cause variations to ensure quality control.

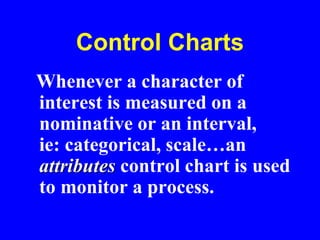
![Control Charts
Charts may
be used for
categorical
variables.
[i.e.: attributes]](https://image.slidesharecdn.com/controlcharts1-221020155117-fd1feec3/85/ControlCharts1-ppt-10-320.jpg)
![Control Charts
• Attributes Control Charts
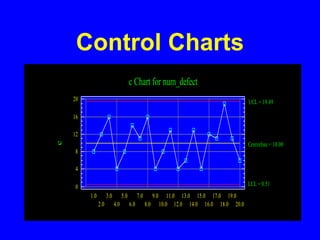
counts [c-chart]
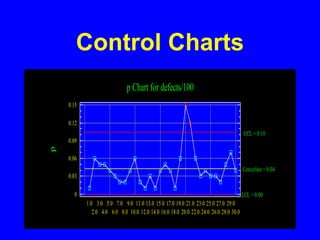
proportion [p-charts]](https://image.slidesharecdn.com/controlcharts1-221020155117-fd1feec3/85/ControlCharts1-ppt-12-320.jpg)
![Control Charts
• Attributes Control Charts
when sample size are not constant
and/or are unknown
use counts charts
[c-charts]](https://image.slidesharecdn.com/controlcharts1-221020155117-fd1feec3/85/ControlCharts1-ppt-13-320.jpg)
![Control Charts
• Attributes Control Charts
when sample size are constant
and are known
use proportion charts
[p-charts]](https://image.slidesharecdn.com/controlcharts1-221020155117-fd1feec3/85/ControlCharts1-ppt-15-320.jpg)
![Control Charts
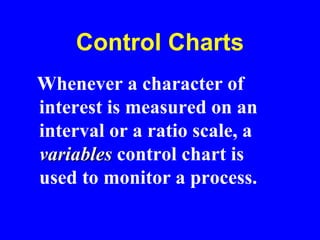
Charts may
be used for
interval or
ratio data
[i.e.: variables ]](https://image.slidesharecdn.com/controlcharts1-221020155117-fd1feec3/85/ControlCharts1-ppt-17-320.jpg)
![Control Charts
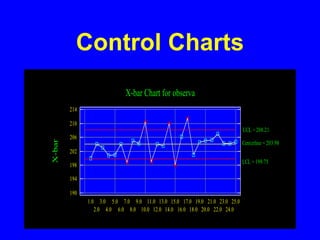
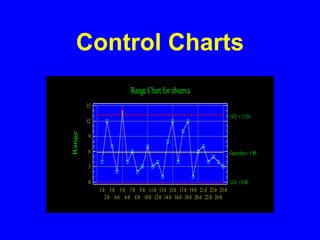
• Variables Control Charts
Mean and Range charts
[x-bar & R charts]](https://image.slidesharecdn.com/controlcharts1-221020155117-fd1feec3/85/ControlCharts1-ppt-19-320.jpg)


![Control charts[1]](https://cdn.slidesharecdn.com/ss_thumbnails/controlcharts1-100924110931-phpapp01-thumbnail.jpg?width=640&height=640&fit=bounds)
![Control Charts[1]](https://cdn.slidesharecdn.com/ss_thumbnails/controlcharts1-1226961283054520-8-thumbnail.jpg?width=640&height=640&fit=bounds)
![Control Charts[1]](https://cdn.slidesharecdn.com/ss_thumbnails/controlcharts1-1226081330857138-9-thumbnail.jpg?width=640&height=640&fit=bounds)


