BAR501 a selective TGR5 ligand attenuates NASH
•Download as PPT, PDF•
0 likes•162 views

Role of TGR5 ligands in treating NASH by modulating autophagy in the liver
Recommended

Recommended
More Related Content
What's hot
What's hot (20)
Similar to BAR501 a selective TGR5 ligand attenuates NASH
Similar to BAR501 a selective TGR5 ligand attenuates NASH (20)
More from Attività scientifica
More from Attività scientifica (20)
Recently uploaded
Recently uploaded (20)
BAR501 a selective TGR5 ligand attenuates NASH
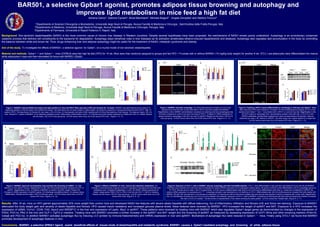
- 1. BAR501, a selective Gpbar1 agonist, promotes adipose tissue browning and autophagy and improves lipid metabolism in mice feed a high fat diet Adriana Carino*, Sabrina Cipriani# , Silvia Marchianò*, Michele Biagioli* , Angela Zampella† and Stefano Fiorucci* *Dipartimento di Scienze Chirurgiche e Biomediche, Università degli Studi di Perugia, Nuova Facoltà di Medicina e Chirurgia , Sant’Andrea delle Fratte,Perugia, Italy # Dipartimento di Medicina, Università degli Studi di Perugia ,Nuova Facoltà di Medicina e Chirurgia, Perugia, Italy † Dipartimento di Farmacia, Università di Napoli Federico II, Napoli, Italy Background. Non-alcoholic steatohepatitis (NASH) is the most common cause of chronic liver disease in Western countries. Despite several hypotheses have been proposed, the mechanisms of NASH remain poorly understood. Autophagy is an evolutionary conserved catabolic process that delivers cell constituents to the lysosome for degradation. Autophagy plays beneficial roles in liver diseases as its activation ameliorates ethanol-induced hepatotoxicity and steatosis. Autophagy also regulates lipid accumulation in the body by controlling the balance between white and brown fat. Thus, drugs enhancing liver and adipose autophagy might be useful for the treatment of NASH, metabolic syndrome and obesity. Aim of the study. To investigate the effects of BAR501, a selective agonist for Gpbar1, on a murine model of non-alcoholic steatohepatitis. Material and methods. Gpbar1 +/+ and Gpbar1 -/- mice (C57BL6) were fed high fat diet (HFD) for 10 wk. Mice were than randomly assigned to groups and fed HFD + Fructose with or without BAR501 (15 mg/Kg body weight) for another 8 wk. 3T3-L1 pre-adipocytes were differentiated into mature white adipocytes 4 days and then stimulated 24 hours with BAR501 (50µM). Results. After 18 wk, mice on HFD gained approximately 30% more weight than control mice and developed NASH like features with severe steato-hepatitis with diffuse ballooning, foci of inflammatory infiltration and fibrosis (H/E and Sirius red staining). Exposure to BAR501 attenuated the body weight gain and severity of steato-hepatitis and fibrosis. HFD caused insulin resistance and increased glucose plasma levels; these features were reversed by BAR501. HFD increased the weight of epWAT and BAT. Exposure to a HFD increased the expression of αSMA, Col1α1, CD36, FAS, Apoc2 and SREBP1C in the liver and expression of Leptin, Mcp1 in epWAT. These patterns were reversed by treating mice with BAR501 which also regulates Gpbar1-target genes as demonstrated by changes in the expression of PDK4, PGC1α, Pfk2 in the liver and GLP-1, Fgf15 in intestine. Treating mice with BAR501 promoted a further increase in the epWAT and BAT weight and the browning of epWAT as measured by assessing expression of UCP1 Mrna and other browning markers (Prdm16, Cebpβ and PGC1α). In addition BAR501 activates autophagic flux by inducing LC3 (protein by immune-histochemistry and mRNA) expression in liver and epWAT. Biomarkers of autophagic flux were reduced in Gpbar1 -/- mice. Finally using 3T3-L1 we found that BAR501 promotes development of autophagic features in vitro. Conclusions. BAR501, a selective GPBAr1 ligand, exerts beneficial effects of mouse mode of steatohepatitis and metabolic syndrome. BAR501 causes a Gpbar1-mediated autophagy and browning of white adipose tissue 0 2 4 6 8 10 12 14 16 18 20 0 4 8 12 16 20 24 28 32 36 40 BAR501 Time (weeks) %Weightgain 0 2 4 6 %Deltaweight Week9vsweek19 0 15 30 45 60 75 90 105 120 100 200 300 400 500 600 * * * HFD + BAR501 HFD Naive Time (min) Glucose(mg/dL) HFD+BAR501 0 1 2 3 * # Steatosisscore HFD 0 1 2 3 # * Fibrosisscore Naive 0 1 2 3 4 5 αSma Col1α1 * # # * rel.mRNAexpr. 0 1 2 3 LdlR Cd36 Abca1 Abcg5 # * rel.mRNAexpr. 0.0 0.2 0.4 0.6 * # Naive HFD HFD + BAR501 Inflammationscore 0 1 2 3 4 5 5 10 15 20 25 Fgf15 Fabp6 ShpGlp1 # # * * rel.mRNAexpr. HFD+BAR501HFDNaive 0.0 0.5 1.0 1.5 2.0 * # EpWATweight(g) 0.0 0.1 0.2 0.3 * BATweight(g) HFD+BAR501HFDNaive 0.0 0.5 1.0 1.5 2.0 Prdm16 Cd137 Cited1 Cebpβ Pgc1α * Ucp1 # # # * * # rel.mRNAexpr. 0.0 0.5 1.0 1.5 2.0 2.5 Lept Tnfα Il1β Mcp1 Ly71 * * * # # # # rel.mRNAexpr. HFD+BAR501HFDNaive GPBAR1 +/+ control NT Chloroquine Starvation 501 LC3 Tubulin DAPI Merge 501 + starvation- + - + - + 0.0 0.5 1.0 1.5 2.0 Chloroquine (50 µM) * * Not treated Starvation BAR501 LC3-II/LC3-Ilevels relativetoGAPDH 0 5 10 15 80 130 180 230 Day 0 Day 4 Day 4 + BAR501 * # * * * # Adipo Srebp1c Pparγ Fabp4 rel.mRNAexpr. 0 1 2 5 6 7 8 9 10 11 12 # * # Ucp1 Pgc1α Pparα Fgf21 # # rel.mRNAexpr. 0 1 2 3 4 Atg5 Atg7 Atg12 Lc3 * # # # # rel.mRNAexpr. Gpbar1 -/- Naive Gpbar1 +/+ Naive Gpbar1 -/- HFD Gpbar1 +/+ HFD p62 LC3-II Gpbar1 +/+ Gpbar1 -/- Naive NaiveHFD HFD GAPDH 0.0 0.5 1.0 1.5 * LC3-II/GAPDH 0 1 2 3 4 Gpbar1+/+ Naive Gpbar1 +/+ HFD Gpbar1-/- Naive Gpbar1-/- HFD * p62/GAPDH LC3 Naive HFD HFD + BAR501 DAPI Merge 0.0 0.5 1.0 1.5 Atg5 Atg12 Lc3Atg7 * * # # # * * # rel.mRNAexpr. 0 1 2 3 4 Atg5 Atg12 Lc3Atg7 # # rel.mRNAexpr. 0 1 2 3 Srebp1c Fas ApoC2 Cpt1 * * * * rel.mRNAexpr. 0 1 2 3 4 GcK Pdk4 Pfk2 Pgc1α # * # # rel.mRNAexpr. LC3 DAPI Merge + Chlor (50 µM)LC3-I LC3-II Not treated GAPDH + +- - - Starvation BAR501 Figure 1: BAR501 reduced NASH live feature and lipid partition in mice fed HFD-F Mice were fed a HFD and fructose for 18 weeks. BAR501 was administered at the dose of 15 mg/kg/day starting on day 63 (week 9) for additional 9 weeks. The data shown are (A) body weight (% delta weight); (B) Glycemic response to oral glucose tolerance test (OGTT) after 15 weeks of HFD. The data shown in Panels A-B, are mean ± SE of 9 mice. (C) Hematoxylin and eosin (H&E) staining and (D) Sirius Red staining of liver tissues. The data are mean ± SE of 9 mice. Panels E-F. Impact of BAR501 on (E) steatosis (steatosis score), inflammation (inflammation score), (F) Fibrosis score and hepatic expression of αSMA and COL1α1 mRNA. Results are the mean ± SE of 5-9 mice per group. *p<0.05 versus naive mice, # p<0.05 versus HFD mice. (Figure 1, A - F). A. B. C. E. D. F. A. B. C. Figure 2: BAR501 improved morphometry and promotes the browning of epWAT. (A) H&E staining on mice epWAT tissues. Magnification is 20X; (B) Immunohistochemistry analysis of UCP1 in epWAT. Magnification is 20x. (C) Effects of BAR501 on epWAT and BAT weight. Panels D-E: Changes in mRNA expression of epWAT genes: (D) brite/beige transdifferentiation, (E) adipose tissue inflammation. Results are the mean ± SE of 5 mice per group. *p<0.05 versus naive mice, # p<0.05 versus HFD mice. (Figure 2, A - E). D. E. A. B. C. Figure 3: Effects of BAR501 on liver, muscle and intestinal metabolism. (A) Change in transcript levels of genes involved in regulating Triacylglycerols and fatty acid metabolism and Cholesterol metabolism, in liver. (B) mRNA relative expression of Gpbar1-target genes PDK4, PGC1α, Pfk2 in the liver and GLP-1, Fgf15 in intestine. Results are the mean ± SE of 5 mice per group. *p<0.05 versus naive mice, # p<0.05 versus HFD mice. (Figure 3, A - C). Figure 4: BAR501 activates autophagy. (A) Immunofluorescence analysis of LC3 in liver sections from mice fed with normal chow diet or HFD-F and then treated with BAR501. Magnification is 63x. BAR501 administration increased LC3 staining level and autophagosomes formation compared to control mice and mice feed or HFD-F. Analysis of mRNA expression of genes involved in autophagy in the (B) Liver and (C) epWAT Results are the mean ± SE of 5-9 mice per group. *p<0.05 versus naive mice, # p<0.05 versus HFD mice. (Figure 4, A – C). Figure 5: Feeding a HFD-F impact differentially on autophagy in wild type and Gpbar1-/- mice. Mice were fed a HFD and fructose for 18 weeks. (A) Immunofluorescence analysis of LC3 in liver sections from Gpbar1+/+ and -/- mice treated with a HFD-F or normal chow diet. Magnification is 63x. (B) HFD impact on autophagic flow: representative western blots with p62, LC3-I/LC3-II and GAPDH antibodies; densitometric analysis from blots corresponding to all samples; data are presented as mean ± SE relative to GAPDH. The blots shown are cutouts relative to a single blot. *p<0.05 versus naive mice, # p<0.05 versus HFD mice. (Figure 5, A – C). A. B. C. A. B. C. A. B. E. F. Figure 6: Exposure of 3T3-L1 cells to BAR501 induces autophagy and brite transdifferentiation. 3T3-L1 were differentiated 4 days and then stimulated 24 hours with 50 μM BAR501. Total RNA was extracted from cells and used to evaluate the relative mRNA expression of (A) adipogenic marker genes, (B) genes involved in brite differentiation and (C) autophagic genes by RT-PCR. Results are the mean ± SE of 2 experiments. *p<0.05 versus undifferentiated cells (Day 0); # p<0.05 versus differentiated cells (Day 4). Values are normalized to GAPDH, the relative mRNA expression is expressed as 2(-ΔΔCt) . Autophagy activation was detected by a LC3 staining on 3T3-L1 differentiated cells. (B) Immunofluorescence revealed that cells treated with BAR501 (50 µM) 18h (pre-starved or not) showed an enhanced LC3 staining as well as chloroquine treated cells and starved cells (positive controls) compared with control cells. Magnification 63x. (C) Identification of active form of LC3 (LC3-II) by Western blot analysis: exposure of 3T3–L1 cells to BAR501 in presence of chloroquine (50 µM) (used as lysosomes inhibitor) increased the ratio LC3-II/LC3-I protein. The blot shown is representative of two others showing the same pattern. *p<0.05 versus Not Treated cells. (Figure 6, A - F). C. D.