SHALINI JOSHI
 P.B.B.Sc.NSG Iind YEAR
STATE COLLEGE OF NSG
INTRODUCTION
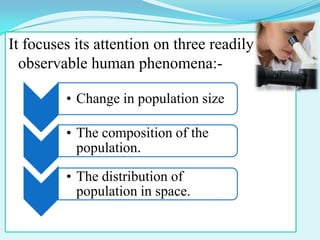
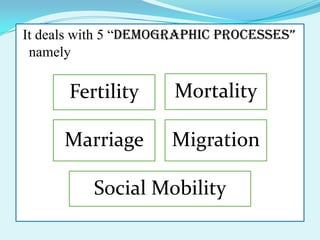
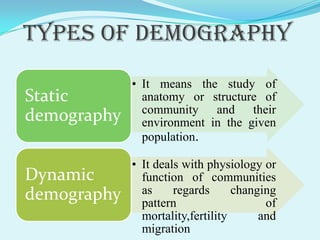
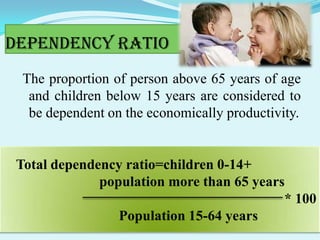
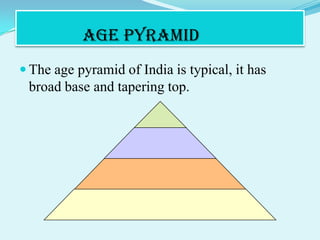
 Demography is the study of human population.
It focuses its attention on three readily
  observable human phenomena:-

         • Change in population size

         • The composition of the
           population.

         • The distribution of
           population in space.
It deals with 5 “Demographic processes”
 namely

      Fertility      Mortality

     Marriage        Migration

          Social Mobility
definition
    It can be defined as “the scientific study of
human population, focusing attention on
readily observable human phenomena, eg.
Change in population size, its composition and
distribution in space”
types of demography
             • It means the study of
Static         anatomy or structure of
               community and their
demography     environment in the given
               population.

             • It deals with physiology or
Dynamic        function of communities
demography     as     regards      changing
               pattern                   of
               mortality,fertility      and
               migration
demographic cycle
                High
             stationary

                            Early
   Decline
                          expanding


       Low               Late
    stationary        expanding
Population of india
Growth rate
 When the crude death rate is substracted from
  the crude birth rate the net residual is the
  current annual growth rate.
 There is deep relation between the growth rate
  and population increase


  Growth rate =crude birth rate – crude death rate
Silent features of population
growth:-
 Approximately 95% of growth is occuring in
  developing countries.
 Currently one third of world population is
  under the age of 15 and will soon enter the
  reproductive bracket.
 Estimates shows that world population is likely
  to reach 10 billion people by 2050.
 The fertility rate in global is 2.5.
Age composition
 The proportion of population below 15
 years(34.33%) is showing decline, where as
 proportion of elderly i.e. population aged above
 60 years (6.77%) is increasing.
Sex ratio

 Sex ratio is defined as “ the number of females
  per 1000 males”
 The sex ratio in India is adverse to women
Sex ratio in india
Year      female/1000 male
1921      955
1931      950
1941      945
1951      946
1961      941
1971      930
1981      934
1991      927
2001      933
2011      940
Dependency ratio
  The proportion of person above 65 years of age
   and children below 15 years are considered to
   be dependent on the economically productivity.


 Total dependency ratio=children 0-14+
              population more than 65 years
                                           * 100
                 Population 15-64 years
Age pyramid
 The age pyramid of India is typical, it has
 broad base and tapering top.
Density of population
 In the Indian census density is defined as “the
  number of persons living per square kilo meter.
 In 2005 the density of population in India was
  345per square kilo meter.
Family size
 Family size refers to as the total number of
  person in a family.
 In demography family size means “the total
  number of children borne by a woman during
  her child bearing age.
urbanization
 The proportion of the urban population in india
 has been increased 28.4% by the natural
 growth and migration from villages.
Literacy and education
 A person is deemed literate if he or she can
  read and write with understanding in any
  language.
 The literacy rate of India for 2011 is 74.04%..
Literacy rates in india
      1951-2011
80
                                                            74.04
70                                                 65.38
60
                                          52.21
50
                                 43.57
40
                        34.45
30            28.30

20   18.33

10
0
       1951      1962     1971     1981     1991     2001     2011
Life expectancy

 Life expectancy or expectation of life –at a
 given age is the average number of years which
 a person of that age may expect to live
 according to the mortality pattern prevalent in
 that country.

Demography

  • 1.
    SHALINI JOSHI P.B.B.Sc.NSGIind YEAR STATE COLLEGE OF NSG
  • 2.
    INTRODUCTION  Demography isthe study of human population.
  • 3.
    It focuses itsattention on three readily observable human phenomena:- • Change in population size • The composition of the population. • The distribution of population in space.
  • 4.
    It deals with5 “Demographic processes” namely Fertility Mortality Marriage Migration Social Mobility
  • 5.
    definition It can be defined as “the scientific study of human population, focusing attention on readily observable human phenomena, eg. Change in population size, its composition and distribution in space”
  • 6.
    types of demography • It means the study of Static anatomy or structure of community and their demography environment in the given population. • It deals with physiology or Dynamic function of communities demography as regards changing pattern of mortality,fertility and migration
  • 7.
    demographic cycle High stationary Early Decline expanding Low Late stationary expanding
  • 9.
  • 11.
    Growth rate  Whenthe crude death rate is substracted from the crude birth rate the net residual is the current annual growth rate.  There is deep relation between the growth rate and population increase Growth rate =crude birth rate – crude death rate
  • 12.
    Silent features ofpopulation growth:-  Approximately 95% of growth is occuring in developing countries.  Currently one third of world population is under the age of 15 and will soon enter the reproductive bracket.  Estimates shows that world population is likely to reach 10 billion people by 2050.  The fertility rate in global is 2.5.
  • 13.
    Age composition  Theproportion of population below 15 years(34.33%) is showing decline, where as proportion of elderly i.e. population aged above 60 years (6.77%) is increasing.
  • 14.
    Sex ratio  Sexratio is defined as “ the number of females per 1000 males”  The sex ratio in India is adverse to women
  • 15.
    Sex ratio inindia Year female/1000 male 1921 955 1931 950 1941 945 1951 946 1961 941 1971 930 1981 934 1991 927 2001 933 2011 940
  • 16.
    Dependency ratio The proportion of person above 65 years of age and children below 15 years are considered to be dependent on the economically productivity. Total dependency ratio=children 0-14+ population more than 65 years * 100 Population 15-64 years
  • 17.
    Age pyramid  Theage pyramid of India is typical, it has broad base and tapering top.
  • 18.
    Density of population In the Indian census density is defined as “the number of persons living per square kilo meter.  In 2005 the density of population in India was 345per square kilo meter.
  • 19.
    Family size  Familysize refers to as the total number of person in a family.  In demography family size means “the total number of children borne by a woman during her child bearing age.
  • 20.
    urbanization  The proportionof the urban population in india has been increased 28.4% by the natural growth and migration from villages.
  • 21.
    Literacy and education A person is deemed literate if he or she can read and write with understanding in any language.  The literacy rate of India for 2011 is 74.04%..
  • 22.
    Literacy rates inindia 1951-2011 80 74.04 70 65.38 60 52.21 50 43.57 40 34.45 30 28.30 20 18.33 10 0 1951 1962 1971 1981 1991 2001 2011
  • 23.
    Life expectancy  Lifeexpectancy or expectation of life –at a given age is the average number of years which a person of that age may expect to live according to the mortality pattern prevalent in that country.