Downloaded 313 times
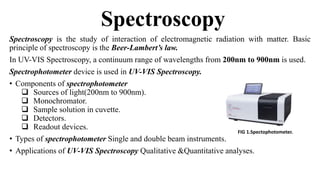
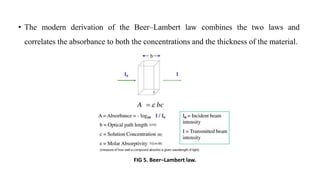
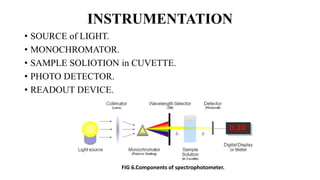
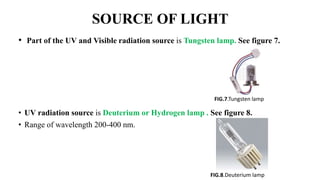
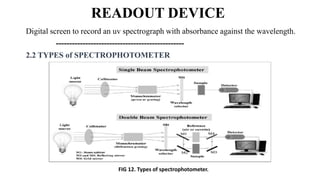


The document discusses UV-Vis spectroscopy, detailing its principles, components, and applications in analytical chemistry and biology. It highlights the Beer-Lambert law as the foundation for absorbance measurements and describes the structure and function of spectrophotometers. Key applications include analyzing chemical compounds and quantifying biological samples, with noted advantages and disadvantages of the technique.


![Complexation and Protein Binding: Unit IV (ii) [BP302T] .pptx](https://cdn.slidesharecdn.com/ss_thumbnails/unitiviicomplexationandproteinbinding-251207164128-8b45a45b-thumbnail.jpg?width=640&height=640&fit=bounds)

![Complexation and Protein Binding: Unit IV (i) [BP302T].pptx](https://cdn.slidesharecdn.com/ss_thumbnails/unitivicomplexationandproteinbinding-251207163820-1722f0aa-thumbnail.jpg?width=640&height=640&fit=bounds)


![Surface and Interfacial Phenomena: Unit III Physical Pharmaceutics-I [BP302T]...](https://cdn.slidesharecdn.com/ss_thumbnails/unitiiiphysicalpharmaceutics-ibp302t-251207163200-ab3370a1-thumbnail.jpg?width=640&height=640&fit=bounds)

![PELLETS - BASIC AND COMPOSITION UNIT DOSAGE FORM [Industrial Pharmacy-I].pdf](https://cdn.slidesharecdn.com/ss_thumbnails/pellets-basicandcompositionunitdosageform-241029091949-dd0369dc-thumbnail.jpg?width=640&height=640&fit=bounds)


![Software Used In Formulation Design Process- Minor Project [Bachelor].pdf](https://cdn.slidesharecdn.com/ss_thumbnails/softwareusedinformulationdesignprocess-minorprojectbachelor-240423141933-4b6eee88-thumbnail.jpg?width=640&height=640&fit=bounds)


