QSE Gains 0.46% as Real Estate Leads Trading
•
1 like•279 views

The QSE Index gained 0.46% over the week to close at 11,347.15, with market capitalization increasing slightly to QR598.9 billion. Trading value rose 1.51% to QR2.34 billion, led by the Banks and Financial Services sector. Trading volume increased 6.88% to 57.9 million shares, led by the Real Estate sector. Foreign institutions turned bullish and net bought QR384.9 million worth of stocks, while Qatari institutions net sold QR211.7 million worth.

Recommended
More Related Content
What's hot
What's hot (20)
Similar to QSE Gains 0.46% as Real Estate Leads Trading
Similar to QSE Gains 0.46% as Real Estate Leads Trading (20)
More from QNB Group
More from QNB Group (20)
Recently uploaded
Recently uploaded (20)
QSE Gains 0.46% as Real Estate Leads Trading
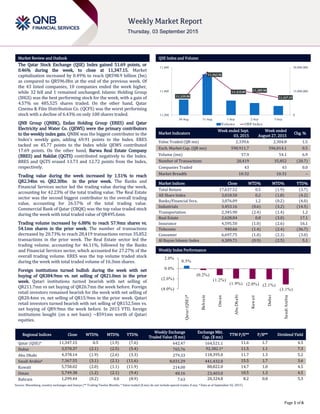
- 1. ` Page 1 of 6 Market Review and Outlook QSE Index and Volume The Qatar Stock Exchange (QSE) Index gained 51.69 points, or 0.46% during the week, to close at 11,347.15. Market capitalization increased by 0.49% to reach QR598.9 billion (bn) as compared to QR596.0bn at the end of the previous week. Of the 43 listed companies, 10 companies ended the week higher, while 32 fell and 1 remained unchanged. Islamic Holding Group (IHGS) was the best performing stock for the week, with a gain of 4.57% on 485,525 shares traded. On the other hand, Qatar Cinema & Film Distribution Co. (QCFS) was the worst performing stock with a decline of 6.43% on only 100 shares traded. QNB Group (QNBK), Ezdan Holding Group (ERES) and Qatar Electricity and Water Co. (QEWS) were the primary contributors to the weekly index gain. QNBK was the biggest contributor to the Index’s weekly gain, adding 69.91 points to the Index. ERES tacked on 45.77 points to the Index while QEWS contributed 17.69 points. On the other hand, Barwa Real Estate Company (BRES) and Nakilat (QGTS) contributed negatively to the Index. BRES and QGTS erased 13.73 and 12.72 points from the Index, respectively. Trading value during the week increased by 1.51% to reach QR2.34bn vs. QR2.30bn in the prior week. The Banks and Financial Services sector led the trading value during the week, accounting for 42.23% of the total trading value. The Real Estate sector was the second biggest contributor to the overall trading value, accounting for 26.57% of the total trading value. Commercial Bank of Qatar (CBQK) was the top value traded stock during the week with total traded value of QR495.6mn. Trading volume increased by 6.88% to reach 57.9mn shares vs. 54.1mn shares in the prior week. The number of transactions decreased by 20.73% to reach 28,419 transactions versus 35,852 transactions in the prior week. The Real Estate sector led the trading volume, accounting for 46.11%, followed by the Banks and Financial Services sector, which accounted for 27.27% of the overall trading volume. ERES was the top volume traded stock during the week with total traded volume of 16.3mn shares. Foreign institutions turned bullish during the week with net buying of QR384.9mn vs. net selling of QR21.0mn in the prior week. Qatari institutions turned bearish with net selling of QR211.7mn vs net buying of QR26.7mn the week before. Foreign retail investors remained bearish for the week with net selling of QR20.4mn vs. net selling of QR15.9mn in the prior week. Qatari retail investors turned bearish with net selling of QR152.5mn vs. net buying of QR9.9mn the week before. In 2015 YTD, foreign institutions bought (on a net basis) ~$591mn worth of Qatari equities. Market Indicators Week ended Sept. 03, 2015 Week ended August 27, 2015 Chg. % Value Traded (QR mn) 2,339.6 2,304.8 1.5 Exch. Market Cap. (QR mn) 598,911.7 596,014.1 0.5 Volume (mn) 57.9 54.1 6.9 Number of Transactions 28,419 35,852 (20.7) Companies Traded 43 43 0.0 Market Breadth 10:32 10:31 – Market Indices Close WTD% MTD% YTD% Total Return 17,637.52 0.5 (1.9) (3.7) All Share Index 3,018.50 0.2 (1.8) (4.2) Banks/Financial Svcs. 3,076.09 1.2 (0.2) (4.0) Industrials 3,453.16 (0.6) (3.2) (14.5) Transportation 2,345.90 (2.4) (1.4) 1.2 Real Estate 2,628.84 0.8 (3.0) 17.1 Insurance 4,595.50 (1.0) (2.6) 16.1 Telecoms 940.66 (1.4) (2.4) (36.7) Consumer 6,697.75 (1.0) (2.3) (3.0) Al Rayan Islamic Index 4,309.71 (0.9) (2.5) 5.1 Market Indices Weekly Index Performance Regional Indices Close WTD% MTD% YTD% Weekly Exchange Traded Value ($ mn) Exchange Mkt. Cap. ($ mn) TTM P/E** P/B** Dividend Yield Qatar (QSE)* 11,347.15 0.5 (1.9) (7.6) 642.47 164,521.1 11.6 1.7 4.5 Dubai 3,570.37 (2.1) (2.5) (5.4) 765.76 92,382.1# 11.5 1.1 7.3 Abu Dhabi 4,378.14 (1.9) (2.6) (3.3) 279.33 118,395.0 11.7 1.3 5.2 Saudi Arabia# 7,367.55 (3.1) (2.1) (11.6) 8,031.29 441,432.8 15.5 1.7 3.6 Kuwait 5,758.02 (2.0) (1.1) (11.9) 214.00 88,822.0 14.7 1.0 4.5 Oman 5,749.38 (1.2) (2.1) (9.4) 48.16 23,403.0 10.5 1.3 4.5 Bahrain 1,299.44 (0.2) 0.0 (8.9) 7.63 20,324.8 8.2 0.8 5.3 Source: Bloomberg, country exchanges and Zawya (** Trailing Twelve Months; * Value traded ($ mn) do not include special trades, if any; # Data as of September 02, 2015) 11,339.50 11,563.56 11,415.09 11,385.90 11,347.15 0 15,000,000 30,000,000 11,200 11,400 11,600 30-Aug 31-Aug 1-Sep 2-Sep 3-Sep Volume QSEIndex 0.5% (0.2%) (1.2%) (1.9%) (2.0%) (2.1%) (3.1%)(4.0%) (2.0%) 0.0% 2.0% Qatar(QSE)* Bahrain Oman AbuDhabi Kuwait Dubai SaudiArabia
- 2. Page 2 of 6 News Economic News BMI: Qatar construction to grow by an average of 10.4% till 2022; little impact due to oil fall – BMI Research has said that Qatar’s infrastructure spending will be “insulated” despite lower oil prices, as it forecasts the “strongest” construction industry growth in the GCC for the country with average annual real growth of 10.4% up to 2022. The 2022 FIFA World Cup is a “catalyst” for growth, but Qatar’s need to diversify its economy will mean most of the major infrastructure projects would be needed, even with the event. The industry is navigating capacity constraints seemingly well, although BMI believes wage and material price pressures will be a drag. Qatar is the fastest growing construction & infrastructure market in the GCC and remains one of BMI’s “favorite” construction markets, buoyed by huge government investment, a stable business environment and growing consumer demand. BMI’s country risk team believes Qatari economic activity will continue to expand at a strong pace throughout 2015, driven primarily by growth in the non-oil sector. Therefore, the dramatic fall in oil prices witnessed over recent quarters would have little impact on growth. Robust private consumption, on the back of a fast-growing population, large government spending commitments, and continued progress on infrastructure projects will lead the residential and non-residential sector, in particular, to outperform over the long term. BMI said oil prices are a minimal downside risk to its forecast, as Qatar is the least exposed out of the six GCC economies to the drop in oil prices. The agency does not expect government spending or consumer confidence to be impacted over coming quarters. (Gulf-Times.com) Market & Corporate News Qatar issued QR15bn of bonds on September 1 – Qatar issued QR15bn of bonds on September 1, 2015 as the country takes advantage of low borrowing costs to deepen the market. The Qatar Central Bank Governor HE Sheikh Abdulla Bin Saoud Al- Thani said that the sale was intended to boost the local capital markets and was part of the coordination between fiscal and monetary policies. The issuance was four times oversubscribed. Meanwhile, the QCB Governor has stressed the need for GCC countries to take adequate measures to deal with any possible aftershocks of the current volatile global economic conditions. (Bloomberg, Peninsula Qatar) QCB auctions T-bills worth QR4bn on September 1 – The Qatar Central Bank (QCB) has auctioned treasury bills worth QR4bn on September 1, 2015 for which it received bids totaling QR7.05bn. T-bills worth QR2bn with a three-month maturity period were auctioned at a yield of 0.85%. T-bills worth QR1bn with a six- month maturity period were sold at a yield of 0.87%, while T-bills worth QR1bn with a nine-month maturity period were auctioned at a yield of 0.96%. (QCB) QGTS clarifies purpose of amending Article 6 and postpones its EGM to Sep. 7, 2015 due lack of Legal Quorum; doubling of FOL to 49% from 25% is the key item on the agenda – Qatar Gas Transport Company (QGTS or Nakilat) will now hold its extraordinary general meeting (EGM) on September 7, 2015 at the same venue, Sharq Village Resort and Spa, at 6:30 p.m., at Al Sonbok Ballroom. As we have stated before, a key item on the agenda is a proposed increased of its FOL to 49% from 25% currently. QGTS has also clarified the purpose of the proposed amendment to Article (6) of the Article of Association. QGTS said that the amendment is aimed at correcting information pertaining to the number of issued share capital, of which 5,973,640 shares were wrongly underwritten at the time of the initial public offering (IPO). The proposed amendment is consistent with the presented share capital in the company’s financial statements, with no change in the previously reported share capital. We note as we have stated before that the company currently has and will continue to maintain an authorized share capital of 560mn shares and an issued share capital of 554mn shares. We maintain our Accumulate rating on QGTS with a price target of QR24.70. (QNBFS Research, QSE) IHGS secures MoEC nod for 50% capital increase – Islamic Holding Group (IHGS) said that the Corporate Supervision Department of the Ministry of Economy & Commerce (MoEC) has approved IHGS board’s proposal to increase the company’s capital by 50%, which is equivalent to 2mn shares at a nominal value of QR10 per share and an issuing premium of QR40 per share (therefore amounting to a total of QR50 per share). The company also said that it was in the process of getting the MoEC to approve a date to convene an extraordinary general assembly meeting in order to adopt and ratify this transaction. (QSE) Qatar to finish work on first World Cup venue by 2016 – According to the Project Manager, Mansoor Saleh Al-Muhannadi, Qatar will complete work on the first venue for the 2022 FIFA World Cup by 2016. It is also the venue for the 2019 World Athletics Championships, the first time that the games will be held in the Middle East. The 40,000-seater Khalifa International Stadium is scheduled to host group stage, round of 16 and quarter-final matches during the 2022 FIFA World Cup. The Khalifa Stadium, located in the west of Doha, was originally built in 1976 as a 20,000-seater Stadium but is undergoing major renovation for 2022. (Gulf-Times.com) QPMC increases gabbro berth terminal capacity to 58mn tpy – Qatar Primary Materials Company (QPMC) has increased its gabbro berth terminal capacity across the country to 58mn tons per year (tpy) even as QPMC began selling quality primary materials to the public and private sectors. QPMC said it had commenced gabbro sale to contractors from its stockpiles and storage areas in Mesaieed and Lusail. The company added it will supply gabbro and limestone, to both the private and government sectors to ensure the stability of prices of primary infrastructure materials in the local market and provide the required quantities to all concerned as part of its mission to help the country’s infrastructure development. (Gulf-Times.com) QCB extends deadline for insurance regulations – The Qatar Central bank (QCB) has extended the deadline set for insurance, reinsurance and Takaful companies to implement its new regulations. As per the original schedule, the institutions were supposed to comply with the new regulations from the end of May. Al Sharq reported that after realizing that the insurance companies needed more time to reposition themselves to implement the new regulations, the central bank had extended the deadline to November 30. The new operational instructions to the insurance sector is intended to further tightening the control over the agencies engaged in the business and their representative offices. The proposed regulations restrict the companies and insurance practitioners from getting involved in cross-border activities. QCB’s new regulations demand better transparency, good governance and effective risk management from the companies. The regulatory body will suspend or cancel the operational license of a company if it fails to adhere to the regulations, without prior notice. The review mechanism will have the legitimacy of Shari’ah Supervisory Board. (Peninsula Qatar)
- 3. Page 3 of 6 Qatar Stock Exchange Top Gainers Top Decliners Source: Qatar Stock Exchange (QSE) Source: Qatar Stock Exchange (QSE) Most Active Shares by Value (QR Million) Most Active Shares by Volume (Million) Source: Qatar Stock Exchange (QSE) Source: Qatar Stock Exchange (QSE) Investor Trading Percentage to Total Value Traded Net Traded Value by Nationality (QR Million) Source: Qatar Stock Exchange (QSE) Source: Qatar Stock Exchange (QSE) 4.6% 4.4% 4.0% 3.2% 1.6% 0.0% 2.0% 4.0% 6.0% Islamic Holding Group QNB Group Qatar Electricity and Water Ezdan Real Estate Commercial Bank of Qatar -6.4% -6.1% -5.8% -5.6% -4.4% -9.0% -6.0% -3.0% 0.0% Qatar Cinema & Film Distribution Qatar Industrial Manufacturing Qatari Investors Group Al Ahli Bank MannaiCorp. 495.6 304.1 215.8 201.0 162.6 0.0 170.0 340.0 510.0 Commercial Bank of Qatar Ezdan Real Estate Barwa Real Estate QNB Group Gulf International Services 16.3 8.8 5.0 3.8 3.2 0.0 6.0 12.0 18.0 Ezdan Real Estate Commercial Bank of Qatar Barwa Real Estate Vodafone Qatar Mazaya Qatar 0% 20% 40% 60% 80% 100% Buy Sell 27.64% 34.16% 7.12% 16.17%12.13% 13.00% 53.11% 36.66% Qatari Individuals Qatari Institutions Non-Qatari Individuals Non-Qatari Institutions 813 1,526 1,178 1,162 (364) 365 (500) - 500 1,000 1,500 2,000 Qatari Non-Qatari Net Investment Total Sold Total Bought
- 4. Page 4 of 6 TECHNICAL ANALYSIS OF THE QSE INDEX Source: Bloomberg The QSE Index lost 0.44% vs. the previous week. The RSI is moving close to the oversold zone, while the MACD is also in a bearish territory. However, the creation of the hammer candlestick created on the weekly chart with high volumes is a good sign, suggesting a possibility of a rebound from the current level. On the other hand traders may need to keep a close watch on the 10,900 level, as any break below that level portends further weakness. We update our weekly support and resistance levels between 10,900 and 11,800 points, respectively. DEFINITIONS OF KEY TERMS USED IN TECHNICAL ANALYSIS RSI (Relative Strength Index) indicator – RSI is a momentum oscillator that measures the speed and change of price movements. The RSI oscillates between 0 to 100. The index is deemed to be overbought once the RSI approaches the 70 level, indicating that a correction is likely. On the other hand, if the RSI approaches 30, it is an indication that the index may be getting oversold and therefore likely to bounce back. MACD (Moving Average Convergence Divergence) indicator – The indicator consists of the MACD line and a signal line. The divergence or the convergence of the MACD line with the signal line indicates the strength in the momentum during the uptrend or downtrend, as the case may be. When the MACD crosses the signal line from below and trades above it, it gives a positive indication. The reverse is the situation for a bearish trend. Candlestick chart – A candlestick chart is a price chart that displays the high, low, open, and close for a security. The ‘body’ of the chart is portion between the open and close price, while the high and low intraday movements form the ‘shadow’. The candlestick may represent any time frame. We use a one-day candlestick chart (every candlestick represents one trading day) in our analysis. Doji candlestick pattern – A Doji candlestick is formed when a security's open and close are practically equal. The pattern indicates indecisiveness, and based on preceding price actions and future confirmation, may indicate a bullish or bearish trend reversal. Shooting Star/Inverted Hammer candlestick patterns – These candlestick patterns have a small real body (open price and close price are near to each other), and a long upper shadow (large intraday movement on the upside). The Shooting Star is a bearish reversal pattern that forms after a rally. The Inverted Hammer looks exactly like a Shooting Star, but forms after a downtrend. Inverted Hammers represent a potential bullish trend reversal.
- 5. Page 5 of 6 Source: Bloomberg Company Name Price (Sept 03) % Change 5- Day % Change YTD Market Cap. QR Million TTM P/E P/B Div. Yield Qatar National Bank 184.50 4.36 (13.34) 129,100 11.8 2.3 4.1 Qatar Islamic Bank 111.10 0.27 8.71 26,252 15.0 1.8 3.8 Commercial Bank of Qatar 56.00 1.63 (10.07) 18,291 9.7 1.1 5.7 Doha Bank 51.10 (1.73) (10.35) 13,203 9.6 1.0 7.8 Al Ahli Bank 47.10 (5.61) (5.11) 8,559 13.4 2.0 2.9 Qatar International Islamic Bank 74.40 (1.46) (8.94) 11,262 13.1 2.2 5.4 Masraf Al Rayan 42.55 (0.82) (3.73) 31,913 15.2 3.2 4.1 Al Khaliji Bank 21.00 (0.52) (4.76) 7,560 12.4 1.3 4.8 National Leasing 17.00 (3.24) (15.00) 841 N/A 0.7 5.0 Dlala Holding 19.37 (3.87) (42.07) 550 N/A 1.9 N/A Qatar & Oman Investment 13.50 (3.23) (12.34) 425 6.6 1.2 5.9 Islamic Holding Group 114.50 4.57 (8.03) 458 31.5 7.4 2.6 Banking and Financial Services 248,414 Zad Holding 91.50 (1.08) 8.93 1,197 10.3 1.5 4.4 Qatar German Co. for Medical Devices 13.55 (4.31) 33.50 157 N/A 1.0 N/A Salam International Investment 12.40 (2.67) (21.77) 1,418 18.2 0.9 4.8 Medicare Group 165.00 0.30 41.03 4,644 23.6 5.3 1.1 Qatar Cinema & Film Distribution 39.30 (6.43) (1.75) 247 19.0 1.8 2.3 Qatar Fuel 153.20 (1.48) (25.01) 12,939 11.3 2.0 5.9 Qatar Meat and Livestock 52.50 (3.67) (13.08) 945 15.4 4.0 4.8 Al Meera Consumer Goods 255.50 0.59 27.75 5,110 23.8 3.9 3.5 Consumer Goods and Services 26,656 Qatar Industrial Manufacturing 41.80 (6.07) (3.58) 1,986 12.0 1.4 7.2 Qatar National Cement 103.00 0.10 (14.17) 5,563 13.1 2.1 3.5 Industries Qatar 128.10 0.23 (23.75) 77,501 13.1 2.4 5.5 Qatari Investors Group 45.70 (5.77) 10.39 5,682 24.3 2.5 1.6 Qatar Electricity and Water 210.00 3.96 12.00 23,100 14.5 3.5 3.6 Mannai Corp. 95.70 (4.40) (12.20) 4,366 8.9 2.0 6.3 Aamal 13.56 0.00 (6.27) 8,543 13.5 1.2 7.0 Gulf International Services 58.30 (2.83) (39.96) 10,835 7.0 2.9 9.4 Mesaieed Petrochemical Holding 21.09 (2.81) -28.5 26,496 20.5 2.0 5.2 Industrials 164,070 Qatar Insurance 95.20 (0.63) 20.84 17,576 18.6 3.1 2.3 Doha Insurance 24.80 (1.20) (14.48) 1,240 14.0 1.1 4.0 Qatar General Insurance & Reinsurance 55.00 (1.61) 7.20 4,375 4.6 0.8 3.2 Al Khaleej Takaful Insurance 33.50 (1.76) (24.16) 855 15.8 1.3 3.9 Qatar Islamic Insurance 74.90 (3.97) (5.19) 1,124 15.0 3.6 5.4 Insurance 25,170 United Development 22.83 (3.63) (3.22) 8,084 11.8 0.7 5.5 Barw a Real Estate 42.45 (2.41) 1.31 16,518 2.7 0.9 5.2 Ezdan Real Estate 18.45 3.19 23.66 48,939 33.5 1.7 2.2 Mazaya Qatar Real Estate Development 15.57 (4.13) (14.63) 1,635 9.5 1.2 1.8 Real Estate 75,176 Qatar Telecom 67.90 (1.45) (45.20) 21,750 15.2 1.0 5.9 Vodafone Qatar 13.77 (1.29) (16.29) 11,641 N/A 2.2 1.5 Telecoms 33,391 Qatar Navigation (Milaha) 96.50 (1.23) (3.02) 11,052 9.3 0.8 5.7 Gulf Warehousing 64.00 (3.76) 13.48 3,044 19.0 3.4 2.3 Qatar Gas Transport (Nakilat) 21.32 (3.13) (7.71) 11,939 12.5 3.0 5.6 Transportation 26,035 Qatar Exchange 598,912
- 6. Contacts Saugata Sarkar Sahbi Kasraoui QNB Financial Services SPC Head of Research Head of HNI Contact Center: (+974) 4476 6666 Tel: (+974) 4476 6534 Tel: (+974) 4476 6544 PO Box 24025 saugata.sarkar@qnbfs.com.qa sahbi.alkasraoui@qnbfs.com.qa Doha, Qatar Disclaimer and Copyright Notice: This publication has been prepared by QNB Financial Services SPC (“QNBFS”) a wholly-owned subsidiary of QNB SAQ (“QNB”). QNBFS is regulated by the Qatar Financial Markets Authority and the Qatar Exchange QNB SAQ is regulated by the Qatar Central Bank. This publication expresses the views and opinions of QNBFS at a given time only. It is not an offer, promotion or recommendation to buy or sell securities or other investments, nor is it intended to constitute legal, tax, accounting, or financial advice. QNBFS accepts no liability whatsoever for any direct or indirect losses arising from use of this report. Any investment decision should depend on the individual circumstances of the investor and be based on specifically engaged investment advice. We therefore strongly advise potential investors to seek independent professional advice before making any investment decision. Although the information in this report has been obtained from sources that QNBFS believes to be reliable, we have not independently verified such information and it may not be accurate or complete. QNBFS does not make any representations or warranties as to the accuracy and completeness of the information it may contain, and declines any liability in that respect. For reports dealing with Technical Analysis, expressed opinions and/or recommendations may be different or contrary to the opinions/recommendations of QNBFS Fundamental Research as a result of depending solely on the historical technical data (price and volume). QNBFS reserves the right to amend the views and opinions expressed in this publication at any time. It may also express viewpoints or make investment decisions that differ significantly from, or even contradict, the views and opinions included in this report. This report may not be reproduced in whole or in part without permission from QNBFS COPYRIGHT: No part of this document may be reproduced without the explicit written permission of QNBFS. Page 6 of 6