(ANIKA) Budhwar Peth Call Girls Just Call 7001035870 [ Cash on Delivery ] Pun...
Weekly market report
1. Page 1 of 5
Market Review and Outlook QE Index and Volume
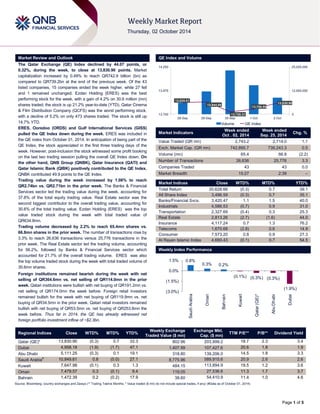
The Qatar Exchange (QE) Index declined by 44.07 points, or
0.32%, during the week, to close at 13,830.90 points. Market
capitalization increased by 0.49% to reach QR742.9 billion (bn) as
compared to QR739.2bn at the end of the previous week. Of the 43
listed companies, 15 companies ended the week higher, while 27 fell
and 1 remained unchanged. Ezdan Holding (ERES) was the best
performing stock for the week, with a gain of 4.2% on 30.6 million (mn)
shares traded; the stock is up 21.2% year-to-date (YTD). Qatar Cinema
& Film Distribution Company (QCFS) was the worst performing stock,
with a decline of 5.2% on only 473 shares traded. The stock is still up
14.7% YTD.
ERES, Ooredoo (ORDS) and Gulf International Services (GISS)
pulled the QE Index down during the week. ERES was included in
the QE index from October 01, 2014. In anticipation of being part of the
QE Index, the stock appreciated in the first three trading days of the
week. However, post-inclusion the stock witnessed some profit booking
on the last two trading session pulling the overall QE Index down. On
the other hand, QNB Group (QNBK), Qatar Insurance (QATI) and
Qatar Islamic Bank (QIBK) positively contributed to the QE Index.
QNBK contributed 49.9 points to the QE Index.
Trading value during the week increased by 1.08% to reach
QR2.74bn vs. QR2.71bn in the prior week. The Banks & Financial
Services sector led the trading value during the week, accounting for
37.8% of the total equity trading value. Real Estate sector was the
second biggest contributor to the overall trading value, accounting for
30.6% of the total trading value. Ezdan Holding (ERES) was the top
value traded stock during the week with total traded value of
QR634.8mn.
Trading volume decreased by 2.2% to reach 65.4mn shares vs.
66.8mn shares in the prior week. The number of transactions rose by
3.3% to reach 26,636 transactions versus 25,776 transactions in the
prior week. The Real Estate sector led the trading volume, accounting
for 56.2%, followed by Banks & Financial Services sector which
accounted for 21.7% of the overall trading volume. ERES was also
the top volume traded stock during the week with total traded volume of
30.6mn shares.
Foreign institutions remained bearish during the week with net
selling of QR364.6mn vs. net selling of QR114.0mn in the prior
week. Qatari institutions were bullish with net buying of QR191.2mn vs.
net selling of QR174.0mn the week before. Foreign retail investors
remained bullish for the week with net buying of QR119.9mn vs. net
buying of QR34.5mn in the prior week. Qatari retail investors remained
bullish with net buying of QR53.5mn vs. net buying of QR253.8mn the
week before. Thus far in 2014, the QE has already witnessed net
foreign portfolio investment inflow of ~$2.3bn.
Market Indicators
Week ended
Oct . 02, 2014
Week ended
Sep. 25, 2014
Chg. %
Value Traded (QR mn) 2,743.2 2,714.0 1.1
Exch. Market Cap. (QR mn) 742,895.7 739,243.3 0.5
Volume (mn) 65.4 66.8 (2.2)
Number of Transactions 26,636 25,776 3.3
Companies Traded 43 43 0.0
Market Breadth 15:27 2:39 –
Market Indices Close WTD% MTD% YTD%
Total Return 20,628.66 (0.3) 0.7 39.1
All Share Index 3,496.59 (0.3) 0.7 35.1
Banks/Financial Svcs. 3,420.47 1.1 1.5 40.0
Industrials 4,586.53 (0.7) 0.9 31.0
Transportation 2,327.69 (0.4) 0.3 25.3
Real Estate 2,813.26 (2.7) (1.6) 44.0
Insurance 4,117.24 0.7 1.3 76.2
Telecoms 1,670.68 (2.8) 0.6 14.9
Consumer 7,573.20 0.8 0.9 27.3
Al Rayan Islamic Index 4,690.43 (0.1) 0.7 54.5
Market Indices
Weekly Index Performance
Regional Indices Close WTD% MTD% YTD%
Weekly Exchange
Traded Value ($ mn)
Exchange Mkt.
Cap. ($ mn)
TTM P/E** P/B** Dividend Yield
Qatar (QE)* 13,830.90 (0.3) 0.7 33.3 802.96 203,999.2 18.7 2.3 3.4
Dubai 4,958.18 (1.9) (1.7) 47.1 1,407.99 107,427.6 20.6 1.8 1.9
Abu Dhabi 5,111.25 (0.3) 0.1 19.1 318.80 139,206.0 14.5 1.8 3.3
Saudi Arabia# 10,849.61 0.8 (0.0) 27.1 8,775.96 589,915.6 20.9 2.6 2.6
Kuwait 7,647.98 (0.1) 0.3 1.3 484.15 113,894.9 19.5 1.2 3.6
Oman 7,479.57 0.3 (0.1) 9.4 119.05 27,536.6 11.3 1.7 3.7
Bahrain 1,472.39 0.2 (0.2) 17.9 38.60 54,410.9 11.4 1.0 4.6
Source: Bloomberg, country exchanges and Zawya (** Trailing Twelve Months; * Value traded ($ mn) do not include special trades, if any) (#Data as of October 01, 2014)
13,835.01
13,844.08
13,728.31
13,758.55
13,830.90
0
12,500,000
25,000,000
13,700
13,975
14,250
28-Sep 29-Sep 30-Sep 1-Oct 2-Oct
Volume QE Index
0.8%
0.3% 0.2%
(0.1%) (0.3%) (0.3%)
(1.9%)
(3.0%)
(1.5%)
0.0%
1.5%
Saudi Arabia
Oman
Bahrain
Kuwait
Qatar (QE)*
Abu Dhabi
Dubai
2. Page 2 of 5
News
Economic News
S&P affirms AA/A-1+ for Qatar, outlook stable – Standard & Poor's (S&P) Ratings Services has affirmed its ‘AA’ long-term and ‘A-1+’ short-term foreign and local currency sovereign credit ratings on Qatar. The outlook is stable. S&P also affirmed the ‘AA’ long-term issue ratings on the bonds issued by Qatari Diar Finance and SoQ Sukuk A. The ratings reflect S&P’s view of Qatar’s high economic wealth and strong fiscal and external balance sheets. (Bloomberg)
Qatar population rises to 2.18mn – According to the statistics released by the Ministry of Development Planning & Statistics (MDPS), Qatar’s population grew by 7.5% year-on-year to reach an all-time high of 2,187,326 as of September 30. There are 1,634,088 males and 553,238 females as of September 30. This compares to the August 31 population figure of 2,077,357. (Gulf- Times.com)
Reuters: Qatar to outperform GCC states with 6.7% growth – According to a Reuters poll of analysts, Qatar’s economy is expected to keep outperforming the other five GCC states with a 6.7% growth in 2015, much faster than the 6.0% forecasted in April, as the country spends billions of dollars on infrastructure as it gears up to host the 2022 FIFA World Cup. However, the higher growth forecast also means that the price pressures in the world’s top liquefied natural gas exporter are expected to intensify, taking the inflation rate to 4.0% in 2015 and 4.5% in 2016, the highest among the Gulf countries. Masraf Al Rayan’s (MARK) Senior Economist Farah Ahmed Hersi said that the capital investment into the economy is expanding, population is growing at a double-digit rate and projects are getting fully underway. Despite all these infrastructure-building activity, the construction inflation in the country is still remarkably low. The poll showed that Gulf Arab economies are likely to grow slightly faster in 2015, driven by strong private business activity despite further falls in oil prices. (Reuters)
Non-oil sector seen infusing 9.1% growth to Qatar’s GDP – GCC business consultant Dr. Abdul Latif Al-Khaja said that industries in the non-hydrocarbon sector are expected to contribute 9.1% to Qatar’s GDP growth between 2013 and 2016. According to Al-Khaja, Qatar’s GDP growth is expected to reach 6.9% between 2013 and 2016 with the oil & gas sector contributing an expected 4.4% and the non-hydrocarbon industries 9.1%. While the government has focused on developing Qatar’s energy sector in the past, Al-Khaja said the oil & gas industry would take a back seat as investment in the non-hydrocarbon industries will drive the economy. (Gulf- Times.com)
Market & Corporate News
Eid Al-Adha holiday for Qatar Exchange – According to a circular issued by Qatar Central Bank (QCB), the Qatar Exchange (QE) will remain closed for five days in view of Eid Al-Adha, starting October 5, 2014 till October 9, 2014 (Sunday to Thursday). The QE will resume work on October 12, 2014. (QE)
BRES sells land plot worth QR2.54bn – Barwa Real Estate Company (BRES) has signed a QR2.54bn agreement with the government under which the latter purchased a plot of land in Lusail City. BRES said that the deal will maximize the group’s profit and consequently shareholders returns. BRES has received QR1.04bn in cash, while the remainder (QR1.5bn) was settled against bank facilities. (Gulf-Times.com)
CBQK denies news about discussing financing real estate project with Kuwaiti firm – The Commercial Bank of Qatar (CBQK) denies the news published on the “Mubasher” website about a Kuwaiti Company discussing the financing of a big real estate project in Doha with the bank. CBQK confirmed that no such discussion has taken place. (QE)
ABQK secures $200mn syndicated term loan – Ahli Bank (ABQK) has successfully closed a three-year $200mn syndicated term loan facility, which it said will be used for general corporate funding purposes. The loan facility carries a margin of 120 basis points over LIBOR. The initial mandated lead arrangers and bookrunners are Barclays Bank, Commerzbank, First Gulf Bank and HSBC Middle East Limited. Syndication was launched in an initial amount of $100mn and closed significantly oversubscribed. The other participating banks are Arab Banking Corporation, Abu Dhabi Commercial Bank, ING Bank, Mizuho Bank, National Bank of Bahrain, Standard Chartered Bank and Commercial Bank of Dubai. (QE)
Ashghal begins construction of Mashaf-Mesaieed road – The Public Works Authority (Ashghal) has started constructing the Al Wakrah parallel road that extends from Al Mashaf to Mesaieed. The entire project costs QR2.2bn and is expected to be completed by 2017. The road is 11 kilometers long with five lanes on both sides. The project also includes pedestrian crossing, bridge and separate lanes for motorbikes and pedestrians in addition to a tunnel. (Peninsula Qatar)
ABQK to announce results on October 16 – Ahli Bank (ABQK) announced its intent to disclose 3Q2014 financial statements on October 16, 2014. (QE)
MCGS to announce results on October 19 – Medicare Group (MCGS) will announce its 3Q2014 financial statements on October 19, 2014. (QE)
KCBK to disclose results on October 20 – Al Khalij Commercial Bank (KCBK) will disclose its 3Q2014 financial statements on October 20, 2014. (QE)
QIBK to disclose results on October 20 – Qatar Islamic Bank (QIBK) will disclose its 3Q2014 financial statements on October 20, 2014. (QE)
QIGD to disclose results on October 21 – Qatari Investors Group (QIGD) will disclose its 3Q2014 financial statements on October 21, 2014. (QE)
MARK to disclose results on October 21 – Masraf Al Rayan (MARK) will disclose its 3Q2014 financial statements on October 21, 2014. (QE)
ORDS to announce 3Q2014 results on October 27 – Ooredoo (ORDS) will disclose its 3Q2014 financial statements on October 27, 2014. (QE)
QFLS to announce results on October 28 – Woqod (QFLS) will announce its 3Q2014 financial statements on October 28, 2014. (QE)
NLCS to publish results on October 29 – Alijarah Holding Company (NLCS) will disclose its 3Q2014 financial statements on October 29, 2014. (QE)
QNNS to disclose results on October 29 – Qatar Navigation (QNNS) will disclose its 3Q2014 financial statements on October 29, 2014. (QE)
3. Page 3 of 5
Qatar Exchange
Top 5 Gainers Top 5 Decliners
Source: Qatar Exchange (QE)
Source: Qatar Exchange (QE)
Most Active Shares by Value (QR Million) Most Active Shares by Volume (Million)
Source: Qatar Exchange (QE)
Source: Qatar Exchange (QE)
Investor Trading Percentage to Total Value Traded Net Traded Value by Nationality (QR Million)
Source: Qatar Exchange (QE)
Source: Qatar Exchange (QE)
4.2%
3.9%
2.4% 2.3%
2.0%
0.0%
1.5%
3.0%
4.5%
Ezdan Real
Estate
Islamic
Holding Group
QNB Group Qatar
Insurance
Al Meera
Consumer
Goods
-5.2%
-4.4%
-3.8%
-3.6%
-1.9%
-6.0%
-4.0%
-2.0%
0.0%
Qatar Cinema &
Film Distribution
Doha Insurance Qatar General
Insurance &
Reinsurance
Ooredoo Widam Food Co.
634.8
271.8 257.0
220.9
149.3
0.0
225.0
450.0
675.0
Ezdan Real
Estate
QNB Group Industries
Qatar
Masraf Al
Rayan
Doha Bank
30.6
4.2 4.0
2.8 2.5
0.0
11.0
22.0
33.0
Ezdan Real
Estate
Vodafone Qatar Masraf Al Rayan Barwa Real
Estate
Doha Bank
0%
20%
40%
60%
80%
100%
Buy Sell
39.80% 37.85%
22.56%
15.59%
15.89%
11.52%
21.75%
35.04%
Qatari Individuals Qatari Institutions
Non-Qatari Individuals Non-Qatari Institutions
1,711
1,033
1,466
1,277
245
(245)
(500) - 500 1,000 1,500 2,000
Qatari
Non-Qatari
Net Investment Total Sold Total Bought
4. Page 4 of 5
TECHNICAL ANALYSIS OF THE QE INDEX
Source: Bloomberg
The QE Index declined around 44 points and drifted lower for the second consecutive week. The index failed to make any further headway above 13,900.0 and retreated, as the bulls were unable to push through. However, the index managed to stay above the 13,750.0-13,800.0 support zone after testing these levels few times in the week. This proves the index has strong support and attracts buying interest near this support band. The intermediate trend formed due to the current fall is not alarming as the index is trading above its strong support zone. Such corrections are a part of the bull-phase. Going ahead, 13,750.0-13,800.0 will be the key band to watch out for, as it will act as a make or break level for the index. Bulls need not worry until the index stays above this support band. Any penetration below this band may result in selling pressure and would pull the index toward the 55-day moving average. In case of sustained weakness, the next support level will be at 13,500.0. On the positive side, technically, the big rally may only resume when the index breaches the 21-day moving average. Meanwhile, both the momentum indicators are providing mixed signals, indicating lack of clarity in index’s current direction. Thus, the traders may expect a volatile week ahead.
DEFINITIONS OF KEY TERMS USED IN TECHNICAL ANALYSIS
RSI (Relative Strength Index) indicator – RSI is a momentum oscillator that measures the speed and change of price movements. The RSI oscillates between 0 to 100. The index is deemed to be overbought once the RSI approaches the 70 level, indicating that a correction is likely. On the other hand, if the RSI approaches 30, it is an indication that the index may be getting oversold and therefore likely to bounce back.
MACD (Moving Average Convergence Divergence) indicator – The indicator consists of the MACD line and a signal line. The divergence or the convergence of the MACD line with the signal line indicates the strength in the momentum during the uptrend or downtrend, as the case may be. When the MACD crosses the signal line from below and trades above it, it gives a positive indication. The reverse is the situation for a bearish trend.
Candlestick chart – A candlestick chart is a price chart that displays the high, low, open, and close for a security. The ‘body’ of the chart is portion between the open and close price, while the high and low intraday movements form the ‘shadow’. The candlestick may represent any time frame. We use a one-day candlestick chart (every candlestick represents one trading day) in our analysis.
Doji candlestick pattern – A Doji candlestick is formed when a security's open and close are practically equal. The pattern indicates indecisiveness, and based on preceding price actions and future confirmation, may indicate a bullish or bearish trend reversal.
Shooting Star/Inverted Hammer candlestick patterns – These candlestick patterns have a small real body (open price and close price are near to each other), and a long upper shadow (large intraday movement on the upside). The Shooting Star is a bearish reversal pattern that forms after a rally. The Inverted Hammer looks exactly like a Shooting Star, but forms after a downtrend. Inverted Hammers represent a potential bullish trend reversal.
5. Contacts
Saugata Sarkar Abdullah Amin, CFA Shahan Keushgerian
Head of Research Senior Research Analyst Senior Research Analyst
Tel: (+974) 4476 6534 Tel: (+974) 4476 6569 Tel: (+974) 4476 6509
saugata.sarkar@qnbfs.com.qa abdullah.amin@qnbfs.com.qa shahan.keushgerian@qnbfs.com.qa
Sahbi Kasraoui Ahmed Al-Khoudary QNB Financial Services SPC
Manager – HNWI Head of Sales Trading – Institutional Contact Center: (+974) 4476 6666
Tel: (+974) 4476 6544 Tel: (+974) 4476 6548 PO Box 24025
sahbi.alkasraoui@qnbfs.com.qa ahmed.alkhoudary@qnbfs.com.qa Doha, Qatar
DISCLAIMER: This publication has been prepared by QNB Financial Services SPC (“QNBFS”) a wholly-owned subsidiary of Qatar National Bank (“QNB”). QNBFS is regulated by the Qatar
Financial Markets Authority and the Qatar Exchange; QNB is regulated by the Qatar Central Bank. This publication expresses the views and opinions of QNBFS at a given time only. It is not an
offer, promotion or recommendation to buy or sell securities or other investments, nor is it intended to constitute legal, tax, accounting, or financial advice. We therefore strongly advise potential
investors to seek independent professional advice before making any investment decision. Although the information in this report has been obtained from sources that QNBFS believes to be
reliable, we have not independently verified such information and it may not be accurate or complete. While this publication has been prepared with the utmost degree of care by our analysts,
QNBFS does not make any representations warranties as to the accuracy and completeness of the information it may contain, and declines any liability in that respect. QNBFS reserves the right
to amend the views and opinions expressed in this publication at any time. It may also express viewpoints or make investment decisions that differ significantly from, or even contradict, the views
and opinions included in this report.
COPYRIGHT: No part of this document may be reproduced without the explicit written permission of QNBFS.
Page 5 of 5
Source: Bloomberg
Company NamePrice(October 02) % Change 5-Day% Change YTDMarket Cap. QR MillionTTM P/EP/BDiv. YieldQatar National Bank207.902.4120.87145,474 14.82.83.4Qatar Islamic Bank114.501.3365.9427,056 19.12.33.5Commercial Bank of Qatar72.501.5422.8821,528 13.41.32.3Doha Bank59.000.171.3715,244 10.71.47.6Al Ahli Bank53.10(0.75)25.518,772 15.72.3N/AQatar International Islamic Bank89.60(0.99)45.2213,563 17.22.64.2Masraf Al Rayan55.80(0.18)78.2741,850 23.44.12.7Al Khaliji Bank22.20(0.05)11.067,992 15.31.44.5National Leasing27.70(1.07)(8.13)1,371 32.91.15.4Dlala Holding61.800.32179.641,372 17.45.1N/AQatar & Oman Investment17.88(0.11)42.81563 22.91.73.4Islamic Holding Group124.203.85170.00497 40.78.31.4Banking and Financial Services285,280 Zad Holding88.40(1.78)27.191,156 10.71.54.0Qatar German Co. for Medical Devices13.69(1.16)(1.16)158 N/M0.9N/ASalam International Investment19.84(0.70)52.502,268 15.91.45.0Medicare Group130.700.15148.953,678 29.44.51.4Qatar Cinema & Film Distribution46.00(5.15)14.71263 22.41.9N/AQatar Fuel227.401.474.0519,206 16.13.13.4Qatar Meat and Livestock62.70(1.88)21.281,129 20.14.63.3Al Meera Consumer Goods186.202.0339.683,724 14.42.94.3Consumer Goods and Services31,582 Qatar Industrial Manufacturing47.30(0.73)12.172,248 11.11.5N/AQatar National Cement141.70(0.56)19.086,958 15.92.84.2Industries Qatar190.00(0.52)12.49114,950 18.33.85.8Qatari Investors Group58.700.3434.327,298 31.93.41.3Qatar Electricity and Water190.100.5814.9620,911 14.33.53.6Mannai Corp.115.501.3228.485,269 9.42.74.8Aamal15.70(0.57)4.679,420 17.61.3N/AGulf International Services122.40(1.77)150.8222,747 26.87.01.3Mesaieed Petrochemical Holding33.30(0.75)N/A41,835 N/A3.11.1Industrials231,636 Qatar Insurance100.502.3488.9116,134 16.53.02.0Doha Insurance33.00(4.35)32.001,650 11.51.66.1Qatar General Insurance & Reinsurance44.30(3.80)10.983,064 2.10.62.8Al Khaleej Takaful Insurance47.00(0.84)67.401,043 12.21.6N/AQatar Islamic Insurance86.70(1.48)49.741,301 15.54.64.3Insurance23,193 United Development28.90(0.34)34.2110,233 20.61.03.3Barwa Real Estate41.451.3439.0916,129 12.41.24.8Ezdan Real Estate20.604.2021.1854,641 42.31.91.5Mazaya Qatar Real Estate Development24.05(0.62)115.122,405 13.52.03.1Real Estate83,409 Qatar Telecom132.90(3.63)(3.13)42,571 17.01.73.0Vodafone Qatar21.45(0.42)100.2818,134 N/M3.20.8Telecoms60,704 Qatar Navigation (Milaha)95.80(0.52)15.4210,972 12.20.95.2Gulf Warehousing52.000.0025.302,473 21.13.12.9Qatar Gas Transport (Nakilat)24.37(0.33)20.3513,647 16.63.74.5Transportation27,092 Qatar Exchange742,896