VIP Call Girls Service Dilsukhnagar Hyderabad Call +91-8250192130
Weekly market report
1. `
Page 1 of 6
Market Review and Outlook QSE Index and Volume
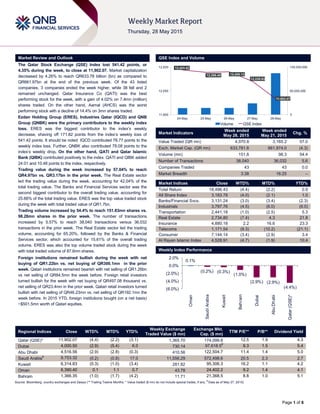
The Qatar Stock Exchange (QSE) Index lost 541.42 points, or
4.35% during the week, to close at 11,902.07. Market capitalization
decreased by 4.26% to reach QR633.78 billion (bn) as compared to
QR661.97bn at the end of the previous week. Of the 43 listed
companies, 3 companies ended the week higher, while 38 fell and 2
remained unchanged. Qatar Insurance Co (QATI) was the best
performing stock for the week, with a gain of 4.02% on 7.4mn (million)
shares traded. On the other hand, Aamal (AHCS) was the worst
performing stock with a decline of 14.4% on 3mn shares traded.
Ezdan Holding Group (ERES), Industries Qatar (IQCD) and QNB
Group (QNBK) were the primary contributors to the weekly index
loss. ERES was the biggest contributor to the index’s weekly
decrease, shaving off 171.82 points from the index’s weekly loss of
541.42 points. It should be noted IQCD contributed 78.77 points to the
weekly index loss. Further, QNBK also contributed 78.08 points to the
index’s weekly drop. On the other hand, QATI and Qatar Islamic
Bank (QIBK) contributed positively to the index. QATI and QIBK added
24.01 and 10.48 points to the index, respectively.
Trading value during the week increased by 57.04% to reach
QR4.97bn vs. QR3.17bn in the prior week. The Real Estate sector
led the trading value during the week, accounting for 42.04% of the
total trading value. The Banks and Financial Services sector was the
second biggest contributor to the overall trading value, accounting for
25.66% of the total trading value. ERES was the top value traded stock
during the week with total traded value of QR1.7bn.
Trading volume increased by 54.4% to reach 151.83mn shares vs.
98.28mn shares in the prior week. The number of transactions
increased by 5.57% to reach 38,040 transactions versus 36,032
transactions in the prior week. The Real Estate sector led the trading
volume, accounting for 65.20%, followed by the Banks & Financial
Services sector, which accounted for 15.61% of the overall trading
volume. ERES was also the top volume traded stock during the week
with total traded volume of 87.6mn shares.
Foreign institutions remained bullish during the week with net
buying of QR1.22bn vs. net buying of QR300.1mn in the prior
week. Qatari institutions remained bearish with net selling of QR1.26bn
vs net selling of QR84.5mn the week before. Foreign retail investors
turned bullish for the week with net buying of QR497.08 thousand vs.
net selling of QR23.4mn in the prior week. Qatari retail investors turned
bullish with net selling of QR46.23mn vs. net selling of QR192.1mn the
week before. In 2015 YTD, foreign institutions bought (on a net basis)
~$501.5mn worth of Qatari equities.
Market Indicators
Week ended
May 28, 2015
Week ended
May 21, 2015
Chg. %
Value Traded (QR mn) 4,970.8 3,165.2 57.0
Exch. Market Cap. (QR mn) 633,781.6 661,974.0 (4.3)
Volume (mn) 151.8 98.3 54.4
Number of Transactions 38,040 36,032 5.6
Companies Traded 43 43 0.0
Market Breadth 3:38 16:25 –
Market Indices Close WTD% MTD% YTD%
Total Return 18,496.43 (4.4) (2.2) 0.9
All Share Index 3,183.78 (4.0) (2.1) 1.0
Banks/Financial Svcs. 3,131.24 (3.0) (3.4) (2.3)
Industrials 3,797.76 (4.5) (6.0) (6.0)
Transportation 2,441.18 (1.0) (2.5) 5.3
Real Estate 2,734.80 (7.4) 4.3 21.8
Insurance 4,880.18 2.2 16.6 23.3
Telecoms 1,171.54 (9.3) (10.2) (21.1)
Consumer 7,144.14 (3.4) (2.9) 3.4
Al Rayan Islamic Index 4,528.91 (4.7) (1.9) 10.4
Market Indices
Weekly Index Performance
Regional Indices Close WTD% MTD% YTD%
Weekly Exchange
Traded Value ($ mn)
Exchange Mkt.
Cap. ($ mn)
TTM P/E** P/B** Dividend Yield
Qatar (QSE)* 11,902.07 (4.4) (2.2) (3.1) 1,365.70 174,099.8 12.5 1.9 4.3
Dubai 4,000.50 (2.9) (5.4) 6.0 730.14 97,618.5#
9.3 1.5 5.4
Abu Dhabi 4,516.56 (2.9) (2.8) (0.3) 410.56 122,504.7 11.4 1.4 5.0
Saudi Arabia#
9,753.32 (0.2) (0.8) 17.0 11,556.29 572,498.6 20.5 2.3 2.7
Kuwait 6,314.83 (0.3) (1.0) (3.4) 281.82 95,306.3 16.2 1.1 4.2
Oman 6,390.40 0.1 1.1 0.7 43.78 24,402.2 9.2 1.4 4.1
Bahrain 1,366.35 (1.0) (1.7) (4.2) 11.71 21,368.5 8.8 1.0 5.1
Source: Bloomberg, country exchanges and Zawya (** Trailing Twelve Months; * Value traded ($ mn) do not include special trades, if any;
#
Data as of May 27, 2015)
12,443.42
12,399.49 12,409.13
12,228.83
11,902.07
0
50,000,000
100,000,000
11,600
12,050
12,500
24-May 25-May 26-May 27-May 28-May
Volume QSE Index
0.1%
(0.2%) (0.3%)
(1.0%)
(2.9%) (2.9%)
(4.4%)(6.0%)
(4.0%)
(2.0%)
0.0%
2.0%
Oman
SaudiArabia
Kuwait
Bahrain
Dubai
AbuDhabi
Qatar(QSE)*
2. Page 2 of 6
News
Economic News
MDPS: Qatar’s PPI for industrial sector declines in March –
According to data released by the Ministry of Development
Planning and Statistics (MDPS), Qatar’s Producer Price Index
(PPI) of the industrial sector declined 41.41% YoY in March
2015. The PPI for March 2015 stood at 102.7, showing a
decrease of 5.2% QoQ. On a YoY basis, the mining group
(77% weight) PPI dropped by 44.5%, mainly led by a price
decline of similar order in crude petroleum & natural gas. The
manufacturing group (21% weight) PPI showed a decline of
29.8% in March 2015, whereas the PPI for electricity & water
(2% weight) showed a decrease of 0.7%. On a MoM basis, in
the mining group, the fall is primarily noticed in crude petroleum
& natural gas by 5.8%. The manufacturing group PPI declined
by 3.2%, while the PPI for electricity & water was down by
1.7%. The PPI is a measure of the average selling prices
received by domestic producers for their output. (Peninsula
Qatar)
MDPS: Qatar’s trade surplus declines in 1Q2015 –
According to figures released by the Ministry of Development
Planning & Statistics (MDPS), Qatar’s trade surplus dropped by
50% YoY in 1Q2015, weighed down by lower value of energy
exports. The value of Qatar’s total exports amounted to
QR82.1bn in 1Q2015, down 38% YoY. The decline was
QR22.1bn or 21.2% on a QoQ basis. The YoY decline in total
export value was mainly due to lower exports of mineral fuels,
lubricants and related materials by QR49.6bn. On the other
hand, the value of Qatar’s imports reached QR29.3bn in
1Q2015, up by QR3bn or 11.4% as compared to QR26.3bn in
1Q2014. The YoY increase in imports reflected increases
mainly in machinery and transport equipment, manufactured
goods, food and live animals. However, the imports decreased
by QR1.4bn or 4.6% on a QoQ basis. As a result, the country’s
trade balance surplus fell to QR52.8bn from QR106.2bn
recorded in 1Q2014. Japan was the major export destination
with QR20.5bn, (25.0% share of the total exports), followed by
South Korea with QR13.9bn and India with QR8.8bn. China
was the principal origin of the imports with QR3.4bn, (11.5% of
the total imports), followed by Japan with QR1.9bn and India
with QR1.1bn. (Peninsula Qatar)
Market & Corporate News
Qatar to set up IWPP worth QR3bn – Qatar will set up an
integrated water and power project (IWPP) worth QR3bn, with a
capacity of generating 2,520 megawatts of electricity and
136.5mlgd (million gallons a day) of potable water in Umm Al
Houl. Qatar Electricity & Water Company, Qatar Petroleum,
Qatar Foundation and Japan’s Mitsubishi Corporation will hold
a 60%, 5%, 5% and 30% stake in the project, respectively. The
project would be executed in two phases, of which the first one
would be ready in 2017 and the final completion is expected
one year later. The new IWPP project, one of the largest in the
Middle East region, would help the country in meeting its ever-
growing power and water requirements in a big way when it is
completed. (Gulf-Times.com)
Nebras Power signs MoU for energy project in Senegal –
Qatar-based Nebras Power has signed a memorandum of
understanding (MoU) with the National Electricity Company of
Senegal and Mitsui Company of Japan for studying an energy-
related project in the Republic of Senegal. Under the terms of
the MoU, both Nebras Power and Mitsui will conduct a
feasibility study for a project which includes development,
financing, construction, operation and maintenance of Floating
Storage & Regasification Units (FSRU) and a power plant that
would use the natural gas as fuel in the Republic of Senegal.
This project will sell the electricity generated to the National
Electricity Company of Senegal through a long-term power
purchase agreement (PPA). (Peninsula Qatar)3
Kuwait’s UFIG planning to set up new company in Qatar –
The financial portal Mubasher reported that Kuwaiti listed firm
United Foodstuff Industries Group (UFIG) is working toward
establishing a new company in Qatar. UFIG will control 50%
stake in the new company. (Peninsula Qatar)
BRES liquidates Nuzul Qatar – Barwa Real Estate Company
(BRES) liquidated Nuzul, and assigned Mr. Adel Abdulla Al
Abdulghani as a liquidator with the accompanying privileges to
complete this task. Nuzul Qatar has been dormant and is not
generating any revenue. (QSE)
Airport City to accommodate over 200,000 residents –
Engineer Badr Al Meer, Executive Director for Operations at the
Hamad International Airport (HIA), said that the Airport City,
which could accommodate more than 200,000 residents, is
expected to be completed by 2022. The city would include
headquarters of the Qatar Civil Aviation Authority and Qatar
Airways will have a center for transport and facilities, cargo and
storage facilities and cultural and entertainment activities
among its features. (Peninsula Qatar)
MERS opens 41st branch in Muraikh – Al Meera Consumer
Goods Company (MERS) has opened its 41st branch in
Muraikh and also soft launched the Jeryan Nejaima branch as
part of its expansion strategy. Dr. Mohamed Nasser Al-Qahtani,
Deputy CEO of MERS, said that the company will be
inaugurating five other branches in Thakhira, Al Wakrah, Al
Thumama, Al Wajba, and Rawdat Ekdeem in 2015. In addition,
MERS is currently constructing 14 new shopping centers in
Sailiya North, Bu Sidra, Al Wakra 2, Umm Salal, Leabaib 1,
Leabaib 2, Rawdat Aba El-Herran, Azghawa, Al Khor, Um
Qarn, Rawdat Al Hamama, Jeryan Junaihat, Al Sailiya, and Ain
Khaled. Al- Qahtani said that MERS will be ready to open its
new branches post completion, after obtaining the necessary
approvals and licenses from the relevant authorities taking its
network of branches in Qatar to 56, plus five other outlets in
Oman. He added that the company is also keen on opening
other branches in Jordan and Egypt. Meanwhile, MERS has
announced that it would be selling around 1,000 goods at cost,
including 750 promotional packages, as part of its annual
Ramadan campaign. (Gulf-Times.com)
Gulf Automobile to start vehicle plant in Qatar by mid-2016
– Gulf Automobile Industry Corporation’s Chairman, Dr. Nasser
Al-Hajiri said that the company has recently started a
production line in Qatar where forklifts and vehicle bodies are
manufactured. He said the firm is set to start a big vehicle plant
in Qatar and it is expected to be ready for production by the
middle of 2016. (Gulf-Times.com)
3. Page 3 of 6
Qatar Stock Exchange
Top Gainers Top Decliners
Source: Qatar Stock Exchange (QSE) Source: Qatar Stock Exchange (QSE)
Most Active Shares by Value (QR Million) Most Active Shares by Volume (Million)
Source: Qatar Stock Exchange (QSE) Source: Qatar Stock Exchange (QSE)
Investor Trading Percentage to Total Value Traded Net Traded Value by Nationality (QR Million)
Source: Qatar Stock Exchange (QSE) Source: Qatar Stock Exchange (QSE)
4.0%
1.5%
0.4%
0.0% 0.0%
0.0%
2.0%
4.0%
6.0%
Qatar
Insurance
Qatar Islamic
Bank
National
Leasing
Al Khaliji Medicare
Group
-14.0%
-12.8%
-10.5%
-7.9% -7.6%
-18.0%
-12.0%
-6.0%
0.0%
Aamal Vodafone Qatar Ezdan Real
Estate
Ooredoo Al Meera
Consumer Goods
1,674.2
730.8
342.9 304.5
223.9
0.0
600.0
1,200.0
1,800.0
Ezdan Real
Estate
Qatar
Insurance
Doha Bank Barwa Real
Estate
Masraf Al
Rayan
87.6
7.4 6.3 6.0 5.1
0.0
33.3
66.7
100.0
Ezdan Real
Estate
Qatar Insurance Doha Bank Barwa Real
Estate
National Leasing
0%
20%
40%
60%
80%
100%
Buy Sell
29.24% 28.31%
8.67%
34.09%9.44%
9.43%
52.65%
28.17%
Qatari Individuals Qatari Institutions
Non-Qatari Individuals Non-Qatari Institutions
1,884
3,086
3,102
1,869
(1,217)
1,217
(2,000) (1,000) - 1,000 2,000 3,000 4,000
Qatari
Non-Qatari
Net Investment Total Sold Total Bought
4. Page 4 of 6
TECHNICAL ANALYSIS OF THE QSE INDEX
Source: Bloomberg
The QSE Index ended the week deep in the red and lost 4.35%. As we mentioned the week before, the Index is positioned between a medium-term
downtrend and a long-term uptrend lines. Indicators are flat, caused by the trading range created last December. The Index is oscillating between the two
lines and this dip effect may get neutralized around the 11,700 support level. A sustained break below the mentioned level is expected to have a negative
impact on the medium term.
DEFINITIONS OF KEY TERMS USED IN TECHNICAL ANALYSIS
RSI (Relative Strength Index) indicator – RSI is a momentum oscillator that measures the speed and change of price movements. The RSI oscillates
between 0 to 100. The index is deemed to be overbought once the RSI approaches the 70 level, indicating that a correction is likely. On the other hand, if
the RSI approaches 30, it is an indication that the index may be getting oversold and therefore likely to bounce back.
MACD (Moving Average Convergence Divergence) indicator – The indicator consists of the MACD line and a signal line. The divergence or the
convergence of the MACD line with the signal line indicates the strength in the momentum during the uptrend or downtrend, as the case may be. When the
MACD crosses the signal line from below and trades above it, it gives a positive indication. The reverse is the situation for a bearish trend.
Candlestick chart – A candlestick chart is a price chart that displays the high, low, open, and close for a security. The ‘body’ of the chart is portion between
the open and close price, while the high and low intraday movements form the ‘shadow’. The candlestick may represent any time frame. We use a one-day
candlestick chart (every candlestick represents one trading day) in our analysis.
Doji candlestick pattern – A Doji candlestick is formed when a security's open and close are practically equal. The pattern indicates indecisiveness, and
based on preceding price actions and future confirmation, may indicate a bullish or bearish trend reversal.
Shooting Star/Inverted Hammer candlestick patterns – These candlestick patterns have a small real body (open price and close price are near to each
other), and a long upper shadow (large intraday movement on the upside). The Shooting Star is a bearish reversal pattern that forms after a rally. The
Inverted Hammer looks exactly like a Shooting Star, but forms after a downtrend. Inverted Hammers represent a potential bullish trend reversal.
5. Page 5 of 6
Source: Bloomberg
Company Name
Price
(May 28)
% Change 5-
Day
% Change
YTD
Market Cap.
QR Million TTM P/E P/B Div. Yield
Qatar National Bank 192.10 (4.38) (11.74) 131,479 12.3 2.5 4.0
Qatar Islamic Bank 104.70 1.52 4.50 25,236 15.3 2.4 4.0
Commercial Bank of Qatar 56.30 (4.42) (13.28) 17,638 9.8 1.1 5.9
Doha Bank 55.10 (3.78) (6.14) 13,823 10.0 1.3 7.5
Al Ahli Bank 47.00 (4.91) (6.32) 8,450 13.6 2.1 2.9
Qatar International Islamic Bank 78.00 (2.62) (4.53) 11,807 14.2 2.4 5.1
Masraf Al Rayan 44.85 (2.84) 0.68 33,375 16.0 3.2 3.9
Al Khaliji Bank 21.62 0.00 (0.23) 7,920 13.2 1.4 4.5
National Leasing 21.50 0.43 6.15 1,050 37.9 0.9 4.0
Dlala Holding 27.30 (5.27) (22.09) 740 13.1 2.5 N/A
Qatar & Oman Investment 15.91 (2.59) 2.60 498 16.2 1.4 5.1
Islamic Holding Group 142.00 (0.92) 12.21 559 33.7 9.4 2.1
Banking and Financial Services 252,575
Zad Holding 99.10 (0.50) 17.98 1,296 11.7 1.6 4.0
Qatar German Co. for Medical Devices 18.05 (2.44) 73.00 203 N/A 1.3 N/A
Salam International Investment 13.97 (2.40) (12.93) 1,578 19.7 1.0 4.3
Medicare Group 170.10 0.00 45.30 4,784 24.3 5.7 1.1
Qatar Cinema & Film Distribution 41.50 (2.67) 14.13 287 23.0 2.0 2.0
Qatar Fuel 175.10 (3.84) (15.42) 14,595 12.8 2.4 5.2
Qatar Meat and Livestock 59.20 (2.79) (1.82) 1,067 19.8 4.1 4.2
Al Meera Consumer Goods 235.00 (7.63) 13.75 4,550 19.7 3.6 4.0
Consumer Goods and Services 28,360
Qatar Industrial Manufacturing 46.90 (0.43) 7.27 2,210 14.4 1.6 6.5
Qatar National Cement 122.00 (1.63) 0.83 6,535 15.7 2.6 3.0
Industries Qatar 137.80 (5.56) (20.18) 81,131 14.2 2.7 5.2
Qatari Investors Group 52.70 (3.52) 25.85 6,477 28.0 2.9 1.4
Qatar Electricity and Water 213.80 (0.98) 13.60 23,430 14.4 3.8 3.5
Mannai Corp. 112.80 (1.58) 2.75 5,109 9.4 2.5 5.4
Aamal 15.00 (14.00) (1.91) 8,940 15.1 1.3 6.7
Gulf International Services 78.20 (2.15) (20.49) 14,347 9.1 4.1 7.1
Mesaieed Petrochemical Holding 25.20 (1.96) -15.3 31,408 21.7 2.4 4.4
Industrials 179,587
Qatar Insurance 95.80 4.02 28.07 18,628 19.0 3.3 2.2
Doha Insurance 26.90 (2.22) (8.97) 1,320 12.2 1.3 3.8
Qatar General Insurance & Reinsurance 56.20 (1.93) 8.96 4,447 4.9 0.8 3.1
Al Khaleej Takaful Insurance 43.35 (1.61) (3.11) 1,093 14.7 1.7 3.0
Qatar Islamic Insurance 83.00 (2.81) 5.06 1,245 14.8 4.4 4.8
Insurance 26,733
United Development 23.20 (3.85) (3.60) 8,052 15.0 0.8 5.5
Barw a Real Estate 51.50 (1.96) 19.33 19,456 3.3 1.1 4.4
Ezdan Real Estate 20.30 (10.49) 22.45 48,461 34.0 1.6 2.2
Mazaya Qatar Real Estate Development 18.99 (2.06) 4.12 1,994 11.5 1.5 1.5
Real Estate 77,963
Qatar Telecom 92.70 (7.92) (28.65) 28,316 16.2 1.3 4.5
Vodafone Qatar 17.15 (12.75) (5.17) 13,188 N/A 2.4 1.1
Telecoms 41,505
Qatar Navigation (Milaha) 98.00 (1.12) (2.51) 11,109 10.4 0.9 5.7
Gulf Warehousing 71.50 (0.68) 29.08 3,462 22.8 4.1 2.1
Qatar Gas Transport (Nakilat) 22.20 (0.98) (3.46) 12,488 13.6 4.2 5.4
Transportation 27,059
Qatar Exchange 633,782
6. Contacts
Saugata Sarkar Sahbi Kasraoui QNB Financial Services SPC
Head of Research Head of HNI Contact Center: (+974) 4476 6666
Tel: (+974) 4476 6534 Tel: (+974) 4476 6544 PO Box 24025
saugata.sarkar@qnbfs.com.qa sahbi.alkasraoui@qnbfs.com.qa Doha, Qatar
Disclaimer and Copyright Notice: This publication has been prepared by QNB Financial Services SPC (“QNBFS”) a wholly-owned subsidiary of QNB SAQ (“QNB”). QNBFS is regulated by the
Qatar Financial Markets Authority and the Qatar Exchange QNB SAQ is regulated by the Qatar Central Bank. This publication expresses the views and opinions of QNBFS at a given time only. It is
not an offer, promotion or recommendation to buy or sell securities or other investments, nor is it intended to constitute legal, tax, accounting, or financial advice. QNBFS accepts no liability
whatsoever for any direct or indirect losses arising from use of this report. Any investment decision should depend on the individual circumstances of the investor and be based on specifically
engaged investment advice. We therefore strongly advise potential investors to seek independent professional advice before making any investment decision. Although the information in this report
has been obtained from sources that QNBFS believes to be reliable, we have not independently verified such information and it may not be accurate or complete. QNBFS does not make any
representations or warranties as to the accuracy and completeness of the information it may contain, and declines any liability in that respect. For reports dealing with Technical Analysis,
expressed opinions and/or recommendations may be different or contrary to the opinions/recommendations of QNBFS Fundamental Research as a result of depending solely on the historical
technical data (price and volume). QNBFS reserves the right to amend the views and opinions expressed in this publication at any time. It may also express viewpoints or make investment
decisions that differ significantly from, or even contradict, the views and opinions included in this report. This report may not be reproduced in whole or in part without permission from QNBFS
COPYRIGHT: No part of this document may be reproduced without the explicit written permission of QNBFS.
Page 6 of 6