High Class Call Girls Nagpur Grishma Call 7001035870 Meet With Nagpur Escorts
Weekly market report
1. Page 1 of 6
Market Review and Outlook QSE Index and Volume
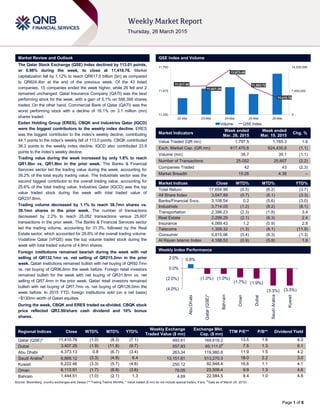
The Qatar Stock Exchange (QSE) Index declined by 113.01 points,
or 0.98% during the week, to close at 11,410.76. Market
capitalization fell by 1.12% to reach QR617.5 billion (bn) as compared
to QR624.4bn at the end of the previous week. Of the 43 listed
companies, 15 companies ended the week higher, while 26 fell and 2
remained unchanged. Qatar Insurance Company (QATI) was the best
performing stock for the week, with a gain of 5.1% on 556,358 shares
traded. On the other hand, Commercial Bank of Qatar (QATI) was the
worst performing stock with a decline of 16.1% on 3.1 million (mn)
shares traded.
Ezdan Holding Group (ERES), CBQK and Industries Qatar (IQCD)
were the biggest contributors to the weekly index decline. ERES
was the biggest contributor to the index’s weekly decline, contributing
44.1 points to the index’s weekly fall of 113.0 points. CBQK contributed
38.3 points to the weekly index decline. IQCD also contributed 23.9
points to the index’s weekly decline.
Trading value during the week increased by only 1.8% to reach
QR1.8bn vs. QR1.8bn in the prior week. The Banks & Financial
Services sector led the trading value during the week, accounting for
39.2% of the total equity trading value. The Industrials sector was the
second biggest contributor to the overall trading value, accounting for
25.6% of the total trading value. Industries Qatar (IQCD) was the top
value traded stock during the week with total traded value of
QR237.8mn.
Trading volume decreased by 1.1% to reach 38.7mn shares vs.
39.1mn shares in the prior week. The number of transactions
decreased by 2.2% to reach 25,052 transactions versus 25,607
transactions in the prior week. The Banks & Financial Services sector
led the trading volume, accounting for 31.3%, followed by the Real
Estate sector, which accounted for 29.8% of the overall trading volume.
Vodafone Qatar (VFQS) was the top volume traded stock during the
week with total traded volume of 4.9mn shares.
Foreign institutions remained bearish during the week with net
selling of QR132.1mn vs. net selling of QR215.2mn in the prior
week. Qatari institutions remained bullish with net buying of QR92.7mn
vs. net buying of QR96.6mn the week before. Foreign retail investors
remained bullish for the week with net buying of QR31.8mn vs. net
selling of QR7.4mn in the prior week. Qatari retail investors remained
bullish with net buying of QR7.7mn vs. net buying of QR126.0mn the
week before. In 2015 YTD, foreign institutions sold (on a net basis)
~$130mn worth of Qatari equities.
During the week, CBQK and ERES traded ex-divided. CBQK stock
price reflected QR3.50/share cash dividend and 10% bonus
shares.
Market Indicators
Week ended
Mar. 26, 2015
Week ended
Mar. 19, 2015
Chg. %
Value Traded (QR mn) 1,797.5 1,765.3 1.8
Exch. Market Cap. (QR mn) 617,470.8 624,435.9 (1.1)
Volume (mn) 38.7 39.1 (1.1)
Number of Transactions 25,052 25,607 (2.2)
Companies Traded 42 43 (2.3)
Market Breadth 15:26 4:38 –
Market Indices Close WTD% MTD% YTD%
Total Return 17,654.96 (0.5) (6.2) (3.7)
All Share Index 3,047.89 (0.7) (6.1) (3.3)
Banks/Financial Svcs. 3,108.54 0.2 (5.6) (3.0)
Industrials 3,714.05 (1.2) (8.2) (8.1)
Transportation 2,396.23 (2.3) (1.8) 3.4
Real Estate 2,299.29 (2.1) (6.3) 2.4
Insurance 4,069.43 1.2 (0.9) 2.8
Telecoms 1,309.32 (1.3) (8.1) (11.9)
Consumer 6,815.96 (0.4) (6.3) (1.3)
Al Rayan Islamic Index 4,168.53 (0.9) (5.9) 1.6
Market Indices
Weekly Index Performance
Regional Indices Close WTD% MTD% YTD%
Weekly Exchange
Traded Value ($ mn)
Exchange Mkt.
Cap. ($ mn)
TTM P/E** P/B** Dividend Yield
Qatar (QSE)* 11,410.76 (1.0) (8.3) (7.1) 493.61 169,619.2 13.5 1.8 4.3
Dubai 3,407.25 (1.9) (11.8) (9.7) 557.93 85,111.0#
7.5 1.3 6.1
Abu Dhabi 4,373.13 0.8 (6.7) (3.4) 263.34 119,980.8 11.9 1.5 4.2
Saudi Arabia#
8,868.12 (3.3) (4.8) 6.4 13,151.81 513,270.3 18.0 2.2 3.0
Kuwait 6,222.46 (3.3) (5.7) (4.8) 250.12 92,948.4 16.6 1.1 4.1
Oman 6,112.91 (1.7) (6.8) (3.6) 78.05 23,509.4 9.9 1.3 4.6
Bahrain 1,444.51 (1.0) (2.1) 1.3 4.69 22,584.5 9.4 1.0 4.8
Source: Bloomberg, country exchanges and Zawya (** Trailing Twelve Months; * Value traded ($ mn) do not include special trades, if any;
#
Data as of March 25, 2015)
11,517.48
11,521.29
11,673.45
11,503.72
11,410.76
0
7,000,000
14,000,000
11,250
11,475
11,700
22-Mar 23-Mar 24-Mar 25-Mar 26-Mar
Volume QSE Index
0.8%
(1.0%) (1.0%)
(1.7%) (1.9%)
(3.3%) (3.3%)(4.0%)
(2.0%)
0.0%
2.0%
AbuDhabi
Qatar(QSE)*
Bahrain
Oman
Dubai
SaudiArabia
Kuwait
2. Page 2 of 6
News
Economic News
StanChart: Qatar ‘better positioned’ to face lower LNG
prices than other producers, inflation to rise to 4.2% by
2015-end – Standard Chartered Bank (StanChart) in its latest
“Global focus” report said that Qatar can “better withstand”
lower prices than many of the new supply points coming online,
as the “world’s lowest-cost producer” of liquefied natural gas.
StanChart said LNG from markets such as Australia and
Mozambique is much more expensive to produce. The key for
Qatar in the long run is to ensure it maintains market share by
adapting rapidly to the changing market dynamics. StanChart
saw little near-term impact on Qatar’s fiscal receipts from LNG
sales. However, in the long run, Qatar’s ‘sweet spot’ for pricing
LNG is likely to tighten further. Asia accounts for around 80% of
Qatar’s LNG exports, while demand is likely to rise further,
supported by lower prices; Qatar’s ability to maintain its pricing
advantage will be challenged as these markets benefit from
new supply sources and lower prices. StanChart forecasted
Qatar’s GDP growth at 5.4% in 2015. Meanwhile, StanChart
said citing “rising population” as a key driver that Qatar’s
inflation that reached 3.4% in January 2015 was expected to
climb to 4.2% by 2015-end. (Gulf-Times.com)
Local banks register growth in loans, deposits in February
– The loan book grew by 1.7% MoM (flattish YTD) after
receding by 1.4% MoM in January 2015. Deposits followed suit
and gained by 2.4% MoM (flattish YTD) in the month of
February 2015. Public sector drove total credit growth with a
gain of 1.5% MoM (down 5.7% YTD). Moreover, public sector
deposits expanded by 5.2% MoM (down 1.0% YTD). Thus, the
LDR stood at 109% vs. 110% at the end of January. (QCB,
QNBFS Research)
Market & Corporate News
Qatar to amend classification of GCC citizens invested in
QE listed companies starting from tomorrow – Qatar
Central Depository Securities will be amending the foreign
ownership percentages for the citizens of the Gulf Cooperation
Council (GCC) and treating them as local shareholders as of
Thursday, 26th
of March, 2015, based on the provisions of Law
No. (9) for the year 2014. (QCSD)
QNB Group to disclose 1Q2015 results on April 08 – QNB
Group (QNBK) has announced that its 1Q2015 financial results
will be disclosed on April 08, 2015. (QSE)
UDCD to disclose 1Q2015 results on April 26 – United
Development Company (UDCD) has announced that its
1Q2015 financial results will be disclosed on April 26, 2015.
(QSE)
GWCS to disclose 1Q2015 results on April 23 – Gulf
Warehousing Company (GWCS) has announced that its
1Q2015 financial results will be disclosed on April 23, 2015.
(QSE)
GWCS establishes fully owned subsidiary in Bahrain – Gulf
Warehousing Company (GWCS) has established a 100%
owned subsidiary in the Kingdom of Bahrain carrying out some
of the main Company’s activities under the name of GWC
Logistics S.P.C. (QSE)
QPMC cement silos to be operational by 2015-end – Qatar
Primary Materials Company’s (QPMC) upcoming cement
storage and conveying plant (silos) in Mesaieed will be
completed by the end of 2015. The facility has been designed
to discharge 1.8mn tons of cement per year into 12 silos
(circular structures for storing bulk materials) with a total
storage capacity of 60,000 cubic meters. Once operational, the
plant will be able to load 1,000 tons of cement per hour in
trucks, which will significantly reduce the truck loading time to
around 90 seconds per truck. (Peninsula Qatar)
LREDC awards construction contracts worth QR6.2bn –
Lusail City Real Estate Development Company (LREDC) has
announced QR6.2bn worth development works in Lusail City.
The projects will be located within the Central Zone of the
Lusail City spread over 38 square kilometers and will include
development packages for Lusail Plaza, Commercial Street and
a unique crescent-shaped street. The Qatari Diar-Bin Laden
Construction joint venture is the contractor of Lusail Plaza. The
QR4.12bn estimated project will be linked with internal roads
connected to trams and underground rails. A joint venture of
WCT and Al Ahli has bagged the QR1.21bn worth contract for
the Commercial Street project, while the third package for the
Crescent Street includes the development of 3 km-long stretch
at QR918m. (Peninsula Qatar)
VFQS’ shares soar after becoming Shari’ah compliant –
Vodafone Qatar’s (VFQS) shares jumped 18.99% MoM in
February 2015, after the company announced it had switched
its financial activity to Islamic transactions. In February 2015,
VFQS announced it had successfully refinanced its
conventional interest-bearing borrowings with a Shari’ah-
compliant Wakala investment agreement in December 2014.
The transition was completed in accordance with the current
laws that do not contradict Shari’ah rules. (Peninsula Qatar)
NPPSC awards QR239mn Hamad Port contract to Belgian
firm – The New Port Project Steering Committee (NPPSC) has
awarded a QR239mn contract for the Hamad Port project to
Gulf Earth Moving Company, a Qatar-based subsidiary of the
Belgian group Aertssen. Under the contract terms, Gulf Earth
will install a causeway and coastal protection by placing armor
rocks over a length of 1,350 meters and undertake the
necessary soil improvements before filling the lagoon area with
9mn cubic meters of processed materials. (Gulf-Times.com)
QPMC signs deal with Rent-A-Port to develop quarry, jetty
in Oman – Qatar Primary Materials Company (QPMC) and
Belgian port & logistical operator, Rent-A-Port have signed an
agreement to initiate work on a limestone and gabbro quarry
besides a 1-kilometer long jetty in Oman. The jetty will be used
to transport more than 3mn tons of gabbro and primary
materials by barges to Qatar. The agreement commissions
Rent-A-Port to provide consultancy and manage the project and
related operations at Khatmat Malaha, Oman. QPMC has
recently acquired two licenses to set up mining operations in
Khatmat Malaha. (Gulf-Times.com)
QNNS’ subsidiary launches NDX service between Qatar,
India – Milaha Maritime & Logistics (MML), a subsidiary of
Milaha (QNNS), has launched its first direct container service,
known as the ‘Nhava Sheva Doha Express’ (NDX), between
Doha port in Qatar and Nhava Sheva port in Mumbai, India.
The new service will facilitate the growing trade activities
between the two countries by enabling direct shipments without
the need for transshipment in Jebel Ali or elsewhere, thus
reducing costs. (QSE)
3. Page 3 of 6
Qatar Stock Exchange
Top Gainers Top Decliners
Source: Qatar Stock Exchange (QSE) Source: Qatar Stock Exchange (QSE)
Most Active Shares by Value (QR Million) Most Active Shares by Volume (Million)
Source: Qatar Stock Exchange (QSE) Source: Qatar Stock Exchange (QSE)
Investor Trading Percentage to Total Value Traded Net Traded Value by Nationality (QR Million)
Source: Qatar Stock Exchange (QSE) Source: Qatar Stock Exchange (QSE)
5.1%
4.0% 3.9%
3.7%
3.3%
0.0%
2.0%
4.0%
6.0%
Qatar
Insurance
Al Khaliji Qatar
Electricity and
Water
Zad Holding Al Meera
Consumer
Goods
-16.1%
-12.9%
-9.3% -8.9%
-7.2%
-18.0%
-12.0%
-6.0%
0.0%
Commercial Bank
of Qatar
Qatar & Oman
Investment
Mannai Corp. Qatar General
Insurance &
Reinsurance
Dlala Holding
237.8
192.1
177.6 177.0
114.1
0.0
80.0
160.0
240.0
Industries
Qatar
QNB Group Commercial
Bank of Qatar
Barwa Real
Estate
Gulf
International
Services
4.9
3.9 3.8
3.1
2.2
0.0
2.0
4.0
6.0
Vodafone Qatar Ezdan Real
Estate
Barwa Real
Estate
Commercial
Bank of Qatar
National Leasing
0%
20%
40%
60%
80%
100%
Buy Sell
37.09% 36.66%
23.43% 18.27%
16.04%
14.27%
23.44%
30.79%
Qatari Individuals Qatari Institutions
Non-Qatari Individuals Non-Qatari Institutions
1,088
710
987
810
100
(100)
(200) - 200 400 600 800 1,000 1,200
Qatari
Non-Qatari
Net Investment Total Sold Total Bought
4. Page 4 of 6
TECHNICAL ANALYSIS OF THE QSE INDEX
Source: Bloomberg
The QSE Index closed at the 11,410.76 level and lost 0.98% from the week before. The Index maintained its level above the 11,300 level which is an
essential support level to be sustained. The traded volumes were low and this could be a positive sign for a rebound. It should be noted that the RSI and the
MACD are pointing downwards. In conclusion, the strong support level stays at the 11,300; while the resistance level remains around the 12,000 level.
DEFINITIONS OF KEY TERMS USED IN TECHNICAL ANALYSIS
RSI (Relative Strength Index) indicator – RSI is a momentum oscillator that measures the speed and change of price movements. The RSI oscillates
between 0 to 100. The index is deemed to be overbought once the RSI approaches the 70 level, indicating that a correction is likely. On the other hand, if
the RSI approaches 30, it is an indication that the index may be getting oversold and therefore likely to bounce back.
MACD (Moving Average Convergence Divergence) indicator – The indicator consists of the MACD line and a signal line. The divergence or the
convergence of the MACD line with the signal line indicates the strength in the momentum during the uptrend or downtrend, as the case may be. When the
MACD crosses the signal line from below and trades above it, it gives a positive indication. The reverse is the situation for a bearish trend.
Candlestick chart – A candlestick chart is a price chart that displays the high, low, open, and close for a security. The ‘body’ of the chart is portion between
the open and close price, while the high and low intraday movements form the ‘shadow’. The candlestick may represent any time frame. We use a one-day
candlestick chart (every candlestick represents one trading day) in our analysis.
Doji candlestick pattern – A Doji candlestick is formed when a security's open and close are practically equal. The pattern indicates indecisiveness, and
based on preceding price actions and future confirmation, may indicate a bullish or bearish trend reversal.
Shooting Star/Inverted Hammer candlestick patterns – These candlestick patterns have a small real body (open price and close price are near to each
other), and a long upper shadow (large intraday movement on the upside). The Shooting Star is a bearish reversal pattern that forms after a rally. The
Inverted Hammer looks exactly like a Shooting Star, but forms after a downtrend. Inverted Hammers represent a potential bullish trend reversal.
5. Page 5 of 6
Source: Bloomberg
Company Name
Price
(March 26)
% Change
5-Day
% Change
YTD
Market Cap.
QR Million TTM P/E P/B Div. Yield
Qatar National Bank 187.10 0.05 (12.12) 130,919 12.5 2.3 4.0
Qatar Islamic Bank 99.50 0.91 (2.64) 23,511 14.8 1.9 4.3
Commercial Bank of Qatar 56.80 (7.71) (8.79) 18,553 9.9 1.1 5.6
Doha Bank 49.65 (0.70) (12.89) 12,828 9.5 1.1 8.1
Al Ahli Bank 48.00 (2.04) (3.30) 8,722 14.5 2.1 2.8
Qatar International Islamic Bank 76.60 0.79 (6.24) 11,595 14.1 2.2 5.2
Masraf Al Rayan 45.85 1.21 3.73 34,388 17.2 3.0 3.8
Al Khaliji Bank 20.80 4.00 (5.67) 7,488 13.2 1.3 4.8
National Leasing 20.70 2.07 3.50 1,024 23.7 0.8 4.1
Dlala Holding 35.25 (7.24) (17.64) 783 11.7 2.7 N/A
Qatar & Oman Investment 13.76 (12.91) (10.65) 433 16.7 1.2 5.8
Islamic Holding Group 116.00 (3.09) (6.83) 464 28.9 6.8 2.6
Banking and Financial Services 250,708
Zad Holding 93.30 3.67 11.07 1,220 6.0 0.9 3.8
Qatar German Co. for Medical Devices 10.15 (3.70) 0.00 117 N/A 0.7 N/A
Salam International Investment 12.75 (3.34) (19.56) 1,458 19.0 0.9 4.7
Medicare Group 142.50 1.06 21.79 4,011 22.1 4.3 1.3
Qatar Cinema & Film Distribution 49.00 0.00 11.36 280 22.7 1.9 N/A
Qatar Fuel 178.50 (1.65) (12.63) 15,076 13.3 2.2 5.0
Qatar Meat and Livestock 56.00 (2.61) (7.28) 1,008 16.2 3.7 3.7
Al Meera Consumer Goods 215.90 3.25 7.95 4,318 19.1 3.1 3.7
Consumer Goods and Services 27,488
Qatar Industrial Manufacturing 45.00 0.00 3.81 2,138 13.3 1.4 6.7
Qatar National Cement 116.80 (1.93) (2.67) 6,308 15.0 2.4 3.1
Industries Qatar 132.20 (1.78) (21.31) 79,981 12.6 2.4 5.3
Qatari Investors Group 38.40 (2.78) (7.25) 4,774 21.1 2.1 2.0
Qatar Electricity and Water 186.00 3.85 (0.80) 20,460 13.0 3.0 4.0
Mannai Corp. 103.40 (9.30) (5.14) 4,717 8.9 2.2 5.8
Aamal 14.98 (4.46) 3.55 9,437 16.4 1.3 6.4
Gulf International Services 87.20 1.28 (10.20) 16,205 11.5 N/A 6.3
Mesaieed Petrochemical Holding 25.75 (2.65) -12.7 32,350 18.0 2.2 5.6
Industrials 176,372
Qatar Insurance 77.90 5.13 (1.12) 14,382 14.4 2.5 2.8
Doha Insurance 26.65 (0.37) (8.10) 1,333 10.4 1.2 3.8
Qatar General Insurance & Reinsurance 55.20 (8.91) 7.59 4,391 5.0 0.8 3.2
Al Khaleej Takaful Insurance 43.10 0.23 (2.43) 1,100 14.8 1.7 3.0
Qatar Islamic Insurance 77.00 (3.75) (2.53) 1,155 15.7 3.7 5.2
Insurance 22,361
United Development 21.12 (3.78) (10.47) 7,478 11.9 0.7 5.9
Barw a Real Estate 45.40 (3.61) 8.35 17,666 6.1 1.1 4.4
Ezdan Real Estate 14.85 (3.57) (0.47) 39,390 29.3 1.3 2.7
Mazaya Qatar Real Estate Development 17.47 (3.48) (8.77) 1,747 10.3 1.3 4.3
Real Estate 66,281
Qatar Telecom 103.00 (2.37) (16.87) 32,993 15.8 1.4 3.9
Vodafone Qatar 17.34 1.70 5.41 14,659 N/A 2.6 1.0
Telecoms 47,652
Qatar Navigation (Milaha) 99.70 (1.19) 0.20 11,418 10.8 0.8 5.5
Gulf Warehousing 58.00 1.75 2.84 2,759 19.7 3.2 2.6
Qatar Gas Transport (Nakilat) 22.20 (4.10) (3.90) 12,432 13.8 3.2 5.4
Transportation 26,609
Qatar Exchange 617,471
6. Contacts
Saugata Sarkar Ahmed Al-Khoudary Sahbi Kasraoui
Head of Research Head of Sales Trading – Institutional Manager – HNWI
Tel: (+974) 4476 6534 Tel: (+974) 4476 6548 Tel: (+974) 4476 6544
saugata.sarkar@qnbfs.com.qa ahmed.alkhoudary@qnbfs.com.qa sahbi.alkasraoui@qnbfs.com.qa
QNB Financial Services SPC
Contact Center: (+974) 4476 6666
PO Box 24025
Doha, Qatar
Disclaimer and Copyright Notice: This publication has been prepared by QNB Financial Services SPC (“QNBFS”) a wholly-owned subsidiary of QNB SAQ (“QNB”). QNBFS is regulated by the
Qatar Financial Markets Authority and the Qatar Exchange QNB SAQ is regulated by the Qatar Central Bank. This publication expresses the views and opinions of QNBFS at a given time only. It is
not an offer, promotion or recommendation to buy or sell securities or other investments, nor is it intended to constitute legal, tax, accounting, or financial advice. QNBFS accepts no liability
whatsoever for any direct or indirect losses arising from use of this report. Any investment decision should depend on the individual circumstances of the investor and be based on specifically
engaged investment advice. We therefore strongly advise potential investors to seek independent professional advice before making any investment decision. Although the information in this report
has been obtained from sources that QNBFS believes to be reliable, we have not independently verified such information and it may not be accurate or complete. QNBFS does not make any
representations or warranties as to the accuracy and completeness of the information it may contain, and declines any liability in that respect. For reports dealing with Technical Analysis,
expressed opinions and/or recommendations may be different or contrary to the opinions/recommendations of QNBFS Fundamental Research as a result of depending solely on the historical
technical data (price and volume). QNBFS reserves the right to amend the views and opinions expressed in this publication at any time. It may also express viewpoints or make investment
decisions that differ significantly from, or even contradict, the views and opinions included in this report. This report may not be reproduced in whole or in part without permission from QNBFS
COPYRIGHT: No part of this document may be reproduced without the explicit written permission of QNBFS.
Page 6 of 6