QSE Index Falls 1.42% as Trading Value Declines 28.9
•
1 like•261 views

The Qatar Stock Exchange (QSE) Index decreased by 125.10 points, or 1.42% during the trading week (Wednesday and Thursday) to close at 8,675.46.

Recommended
More Related Content
What's hot
What's hot (20)
Similar to QSE Index Falls 1.42% as Trading Value Declines 28.9
Similar to QSE Index Falls 1.42% as Trading Value Declines 28.9 (20)
More from QNB Group
More from QNB Group (20)
Recently uploaded
Recently uploaded (20)
QSE Index Falls 1.42% as Trading Value Declines 28.9
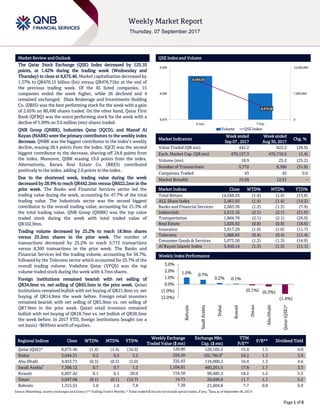
- 1. ` Page 1 of 6 Market Review and Outlook QSE Index and Volume The Qatar Stock Exchange (QSE) Index decreased by 125.10 points, or 1.42% during the trading week (Wednesday and Thursday) to close at 8,675.46. Market capitalization decreased by 1.37% to QR470.15 billion (bn) versus QR476.71bn at the end of the previous trading week. Of the 45 listed companies, 15 companies ended the week higher, while 26 declined and 4 remained unchanged. Dlala Brokerage and Investments Holding Co. (DBIS) was the best performing stock for the week with a gain of 2.65% on 80,490 shares traded. On the other hand, Qatar First Bank (QFBQ) was the worst performing stock for the week with a decline of 5.99% on 3.6 million (mn) shares traded. QNB Group (QNBK), Industries Qatar (IQCD), and Masraf Al Rayan (MARK) were the primary contributors to the weekly index decrease. QNBK was the biggest contributor to the index’s weekly decline, erasing 28.4 points from the index. IQCD was the second biggest contributor to the decrease, shaving off 24.8 points from the index. Moreover, QIBK erasing 19.0 points from the index. Alternatively, Barwa Real Estate Co. (BRES) contributed positively to the index, adding 2.6 points to the index. Due to the shortened week, trading value during the week decreased by 28.9% to reach QR442.2mn versus QR622.2mn in the prior week. The Banks and Financial Services sector led the trading value during the week, accounting for 47.7% of the total trading value. The Industrials sector was the second biggest contributor to the overall trading value, accounting for 21.3% of the total trading value. QNB Group (QNBK) was the top value traded stock during the week with total traded value of QR102.9mn. Trading volume decreased by 25.2% to reach 18.9mn shares versus 25.2mn shares in the prior week. The number of transactions decreased by 25.2% to reach 5,772 transactions versus 8,360 transactions in the prior week. The Banks and Financial Services led the trading volume, accounting for 36.7%, followed by the Telecoms sector which accounted for 25.7% of the overall trading volume. Vodafone Qatar (VFQS) was the top volume traded stock during the week with 4.7mn shares. Foreign institutions remained bearish with net selling of QR34.6mn vs. net selling of QR65.5mn in the prior week. Qatari institutions remained bullish with net buying of QR21.8mn vs. net buying of QR14.9mn the week before. Foreign retail investors remained bearish with net selling of QR5.9mn vs. net selling of QR7.9mn in the prior week. Qatari retail investors remained bullish with net buying of QR18.7mn vs. net bullish of QR58.5mn the week before. In 2017 YTD, foreign institutions bought (on a net basis) ~$693mn worth of equities. Market Indicators Week ended Sep 07 , 2017 Week ended Aug 30, 2017 Chg. % Value Traded (QR mn) 442.2 622.2 (28.9) Exch. Market Cap. (QR mn) 470,157.3 476,710.5 (1.4) Volume (mn) 18.9 25.2 (25.2) Number of Transactions 5,772 8,360 (31.0) Companies Traded 43 43 0.0 Market Breadth 15:26 12:31 – Market Indices Close WTD% MTD% YTD% Total Return 14,548.24 (1.4) (1.4) (13.8) ALL Share Index 2,461.03 (1.4) (1.4) (14.2) Banks and Financial Services 2,683.36 (1.3) (1.3) (7.9) Industrials 2,612.16 (2.1) (2.1) (21.0) Transportation 1,884.78 (2.1) (2.1) (26.0) Real Estate 1,826.92 (0.8) (0.8) (18.6) Insurance 3,917.29 (1.0) (1.0) (11.7) Telecoms 1,068.65 (0.4) (0.4) (11.4) Consumer Goods & Services 5,073.50 (1.3) (1.3) (14.0) Al Rayan Islamic Index 3,450.14 (1.3) (1.3) (11.1) Market Indices Weekly Index Performance Regional Indices Close WTD% MTD% YTD% Weekly Exchange Traded Value ($ mn) Exchange Mkt. Cap. ($ mn) TTM P/E** P/B** Dividend Yield Qatar (QSE)* 8,675.46 (1.4) (1.4) (16.9) 120.86 129,105.2 15.0 1.5 4.0 Dubai 3,644.31 0.2 0.2 3.2 256.20 102,780.8# 24.2 1.3 3.9 Abu Dhabi 4,453.71 (0.3) (0.3) (2.0) 335.93 116,900.2 16.4 1.3 4.6 Saudi Arabia# 7,306.12 0.7 0.7 1.3 1,104.81 460,261.5 17.8 1.7 3.3 Kuwait 6,897.42 0.1 0.1 20.0 154.50 99,485.3 18.2 1.2 5.3 Oman 5,047.08 (0.1) (0.1) (12.7) 14.71 20,699.0 11.7 1.1 5.2 Bahrain 1,315.55 1.0 1.0 7.8 7.38 21,604.8 7.7 0.8 6.0 Source: Bloomberg, country exchanges and Zawya (** Trailing Twelve Months; * Value traded ($ mn) do not include special trades, if any; # Data as of September 06, 2017) 8,684.55 8,675.46 0 7,000,000 14,000,000 8,670 8,680 8,690 6-Sep 7-Sep Volume QSE Index 1.0% 0.7% 0.2% 0.1% (0.1%) (0.3%) (1.4%)(2.0%) (1.0%) 0.0% 1.0% 2.0% 3.0% Bahrain SaudiArabia Dubai Kuwait Oman AbuDhabi Qatar(QSE)*
- 2. Page 2 of 6 News Economic & Corporate News GWCS enters FTSE Qatar Index – FTSE has added Gulf Warehousing Company (GWCS) to FTSE Qatar Index in its semi-annual review. In its periodical rebalancing, FTSE excluded Qatari Investor Group, Aamal Company and Qatar Navigation (Milaha) from the Index. The changes to the FTSE Qatar index will become effective on September 18, 2017, according to Qatar Stock Exchange (QSE). (Peninsula Qatar) VFQS’ board of directors to hold a meeting on September 19 – Vodafone Qatar (VFQS) announced that the board of directors will be holding a meeting on September 19, 2017 to discuss the invitation of the shareholders to the Extraordinary General Assembly meeting and other various business related items. (QSE) ABQK appoints Mahmoud Malkawi as Acting CEO – Ahli Bank (ABQK) announced that Mr. Mahmoud Malkawi has been appointed as Acting CEO of the company replacing Mr. Salah Murad. (QSE) Qatar's central bank raises yields in three-month, six-month Treasury-bill sale – Qatar's central bank said it sold QR1bn worth of Treasury-bills in a monthly auction on September 6, with yields higher than in its previous offer. The bank sold QR650mn of three-month notes with a yield of 2.25%, higher than the 2.14% yield, at which the bank sold QR750mn one month ago. It sold QR350mn Treasury-bills with a six-month maturity and a yield of 2.49%. (Zawya) QCB: Credit facilities drive QDB assets to QR9bn – Qatar Development Bank (QDB) assets have reached QR9bn in 2016- end, driven mainly by credit facilities and some increase in placements of its funds with the banks, according to a report. QDB assets stood at QR8bn in 2015, the Qatar Central Bank (QCB) has said in a report. Capital and reserves continued to record sharp growth during the year under review, QCB said. The share of capital and reserves relative to the balance sheet size is very high and has been increasing rapidly over the years. The ratio of capital and reserves to total assets has risen steadily from 69% in 2013 to 89% in 2015. Most of this is high quality capital as the share of paid up capital in the total capital and reserves has increased from 82% in 2013 to over 91% in 2016. (Gulf-Times.com) QCB: Interest rates on credit cards, vehicle loans rise in the range of 0.32% to 1.16% in Qatar last year – According to a Qatar Central Bank (QCB) report, interest rates on credit cards and vehicle loans in Qatar have gone up in the range of 0.32% to 1.16% (32-116 basis points) in 2016. In line with the interest rates on deposits, weighted average interest rates on credit facilities for all maturities, except that for 1-3 years, increased somewhat during 2016; the increase ranging between 12-38 basis points. The broad success of QCB’s liquidity management strategy in ensuring a stable interest rate regime to support diversified economic growth was also evident from the behavior of interest rates on customer deposits and credit facilities of banks. The weighted average interest rates on customer deposits for all maturities recorded some increase at the end of 2016 as compared to end of 2015, the increase ranging between 0.28% and 0.69% (28−69 basis points), QCB said in its 8th Financial Stability Review. (Gulf-Times.com) Hamad Port to push Qatar trade index growth, says Qatar Chamber official – Trade index between Qatar and its international partners is expected to expand further as the newly-inaugurated Hamad Port opens to more global markets, according to a Qatar Chamber official. Speaking on the sidelines of the official inauguration of Hamad Port, Qatar Chamber’s board member, Ali Abdullatif Al-Misnad underpinned the capacity of the $7.4bn mega infrastructure project to provide commercial access to more than 150 countries. Al-Misnad said, “We are very confident that this project, which was completed ahead of time, is more than capable of linking Qatar with the international market, and it serves as the country’s global gateway, which will enhance the trade index between Qatar and its commercial partners.” (Gulf- Times.com) UK remains important trade and investment destination for Qatar – A knowledge-sharing session on “Qatar – land of opportunities” was hosted by Doha Bank in London. Doha Bank’s CEO, R. Seetharaman was the keynote speaker and gave the concept note. On Qatar-UK bilateral relationships, he noted that Qatar-UK trade is worth more than £5bn. Food imports from UK have come to Qatar after the recent economic blockade. Nearly a third of UK gas imports come from Qatar. Qatar has already invested more than £40bn across Britain, including in iconic real estate including London’s Shard building and the Harrod’s department store. Despite the Brexit development impacting UK and the economic blockade impacting Qatar, UK has always remained an important trade and investment destination for Qatar and will remain so and hence Qatar and UK can continue to explore the growing synergistic opportunities between them. On Qatar economy, he showcased the various developments in the country since the beginning of the blockade and how it had managed the situation. He said, “Qatar has a reserve of $340bn including assets of its Sovereign Wealth Fund, QCB reserves cash and Gold. Together, Qatar’s reserves are more than 200% of its GDP. Qatar banking asset growth was close to 2.5% YTD till July 2017. The overall lending growth was close to 6% YTD until July 2017. The deposit growth was close to 6% YTD till July 2017. Qatar’s net trade surplus for July was QR11.9bn.” (Gulf-Times.com) Mwani Qatar, Oman’s Asyad sign MoU for logistics, passenger ferry services – Qatar Ports Management Company (Mwani Qatar) and Oman Global Logistics Group (Asyad) signed a memorandum of understanding (MoU) for the development of logistics services, shipping and passenger ferry services. The MoU aims to develop passenger ferry services between Qatar and Oman. (Gulf-Times.com)
- 3. Page 3 of 6 Qatar Stock Exchange Top Gainers Top Decliners Source: Qatar Stock Exchange (QSE) Source: Qatar Stock Exchange (QSE) Most Active Shares by Value (QR Million) Most Active Shares by Volume (Million) Source: Qatar Stock Exchange (QSE) Source: Qatar Stock Exchange (QSE) Investor Trading Percentage to Total Value Traded Net Traded Value by Nationality (QR Million) Source: Qatar Stock Exchange (QSE) Source: Qatar Stock Exchange (QSE) 2.7% 2.4% 1.7% 1.3% 1.0% 0.0% 1.0% 2.0% 3.0% Dlala Holding Qatar German Co. for Medical Devices Qatar General Insurance & Reinsurance Al Khaleej Takaful Insurance Vodafone Qatar -6.0% -4.2% -4.2% -3.8% -3.5% -9.0% -6.0% -3.0% 0.0% Qatar FirstBank Gulf International Services MannaiCorp. QatariInvestors Group Aamal 103.0 52.7 38.9 37.4 23.2 0.0 40.0 80.0 120.0 QNB Group Industries Qatar Vodafone Qatar Masraf Al Rayan Qatar First Bank 4.7 3.6 2.2 1.0 0.9 0.0 2.0 4.0 6.0 Vodafone Qatar Qatar First Bank Investment Holding group Masraf Al Rayan United Development 0% 20% 40% 60% 80% 100% Buy Sell 43.15% 38.92% 19.03% 14.09% 6.71% 8.06% 31.12% 38.94% Qatari Individuals Qatari Institutions Non-Qatari Individuals Non-Qatari Institutions 275 167 234 208 41 (41) (100) (50) - 50 100 150 200 250 300 Qatari Non-Qatari Net Investment Total Sold Total Bought
- 4. Page 4 of 6 TECHNICAL ANALYSIS OF THE QSE INDEX Source: Bloomberg The Index closed down by 1.42% from the week before and now 8,675.46; it should be noted that it has been a very short week (only two trading days). As a result, the current movement can possibly be insignificant due to the low traded volumes. We are looking at the 8,300 level as the next support and the resistance level remains around the 10,000 mark. DEFINITIONS OF KEY TERMS USED IN TECHNICAL ANALYSIS RSI (Relative Strength Index) indicator – RSI is a momentum oscillator that measures the speed and change of price movements. The RSI oscillates between 0 to 100. The index is deemed to be overbought once the RSI approaches the 70 level, indicating that a correction is likely. On the other hand, if the RSI approaches 30, it is an indication that the index may be getting oversold and therefore likely to bounce back. MACD (Moving Average Convergence Divergence) indicator – The indicator consists of the MACD line and a signal line. The divergence or the convergence of the MACD line with the signal line indicates the strength in the momentum during the uptrend or downtrend, as the case may be. When the MACD crosses the signal line from below and trades above it, it gives a positive indication. The reverse is the situation for a bearish trend. Candlestick chart – A candlestick chart is a price chart that displays the high, low, open, and close for a security. The ‘body’ of the chart is portion between the open and close price, while the high and low intraday movements form the ‘shadow’. The candlestick may represent any time frame. We use a one-day candlestick chart (every candlestick represents one trading day) in our analysis. Doji candlestick pattern – A Doji candlestick is formed when a security's open and close are practically equal. The pattern indicates indecisiveness, and based on preceding price actions and future confirmation, may indicate a bullish or bearish trend reversal. Shooting Star/Inverted Hammer candlestick patterns – These candlestick patterns have a small real body (open price and close price are near to each other), and a long upper shadow (large intraday movement on the upside). The Shooting Star is a bearish reversal pattern that forms after a rally. The Inverted Hammer looks exactly like a Shooting Star, but forms after a downtrend. Inverted Hammers represent a potential bullish trend reversal.
- 5. Page 5 of 6 Source: Bloomberg
- 6. Contacts Saugata Sarkar, CFA Shahan Keushgerian Zaid al-Nafoosi , CMT, CFTe Head of Research Senior Research Analyst Senior Research Analyst Tel: (+974) 4476 6534 Tel: (+974) 4476 6509 Tel: (+974) 4476 6535 saugata.sarkar@qnbfs.com.qa shahan.keushgerian@qnbfs.com.qa zaid.alnafoosi@qnbfs.com.qa Mohamed Abo Daff QNB Financial Services Co. W.L.L. Senior Research Analyst Contact Center: (+974) 4476 6666 Tel: (+974) 4476 6589 PO Box 24025 mohd.abodaff@qnbfs.com.qa Doha, Qatar Disclaimer and Copyright Notice: This publication has been prepared by QNB Financial Services Co. W.L.L. (“QNBFS”) a wholly-owned subsidiary of Qatar National Bank (Q.P.S.C.). QNBFS is regulated by the Qatar Financial Markets Authority and the Qatar Exchange. Qatar National Bank (Q.P.S.C.) is regulated by the Qatar Central Bank. This publication expresses the views and opinions of QNBFS at a given time only. It is not an offer, promotion or recommendation to buy or sell securities or other investments, nor is it intended to constitute legal, tax, accounting, or financial advice. QNBFS accepts no liability whatsoever for any direct or indirect losses arising from use of this report. Any investment decision should depend on the individual circumstances of the investor and be based on specifically engaged investment advice. We therefore strongly advise potential investors to seek independent professional advice before making any investment decision. Although the information in this report has been obtained from sources that QNBFS believes to be reliable, we have not independently verified such information and it may not be accurate or complete. QNBFS does not make any representations or warranties as to the accuracy and completeness of the information it may contain, and declines any liability in that respect. For reports dealing with Technical Analysis, expressed opinions and/or recommendations may be different or contrary to the opinions/recommendations of QNBFS Fundamental Research as a result of depending solely on the historical technical data (price and volume). QNBFS reserves the right to amend the views and opinions expressed in this publication at any time. It may also express viewpoints or make investment decisions that differ significantly from, or even contradict, the views and opinions included in this report. This report may not be reproduced in whole or in part without permission from QNBFS COPYRIGHT: No part of this document may be reproduced without the explicit written permission of QNBFS. Page 6 of 6