QNBFS Weekly Market Report June 07, 2018
•
0 likes•100 views

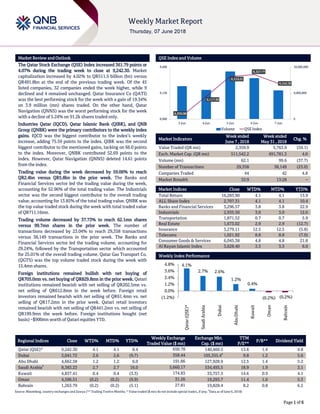
The Qatar Stock Exchange (QSE) Index increased 361.79 points or 4.07% during the trading week to close at 9,242.30.

Recommended
Recommended
More Related Content
What's hot
What's hot (20)
Similar to QNBFS Weekly Market Report June 07, 2018
Similar to QNBFS Weekly Market Report June 07, 2018 (20)
More from QNB Group
More from QNB Group (20)
Recently uploaded
Recently uploaded (20)
QNBFS Weekly Market Report June 07, 2018
- 1. ` Page 1 of 6 Market Review and Outlook QSE Index and Volume The Qatar Stock Exchange (QSE) Index increased 361.79 points or 4.07% during the trading week to close at 9,242.30. Market capitalization increased by 4.02% to QR511.5 billion (bn) versus QR491.8bn at the end of the previous trading week. Of the 45 listed companies, 32 companies ended the week higher, while 9 declined and 4 remained unchanged. Qatar Insurance Co (QATI) was the best performing stock for the week with a gain of 19.34% on 3.9 million (mn) shares traded. On the other hand, Qatar Navigation (QNNS) was the worst performing stock for the week with a decline of 5.24% on 91.2k shares traded only. Industries Qatar (IQCD), Qatar Islamic Bank (QIBK), and QNB Group (QNBK) were the primary contributors to the weekly index gains. IQCD was the biggest contributor to the index’s weekly increase, adding 75.59 points to the index. QIBK was the second biggest contributor to the mentioned gains, tacking on 66.0 points to the index. Moreover, QNBK contributed 52.69 points to the index. However, Qatar Navigation (QNNS) deleted 14.61 points from the index. Trading value during the week decreased by 59.06% to reach QR2.4bn versus QR5.8bn in the prior week. The Banks and Financial Services sector led the trading value during the week, accounting for 52.96% of the total trading value. The Industrials sector was the second biggest contributor to the overall trading value, accounting for 13.85% of the total trading value. QNBK was the top value traded stock during the week with total traded value of QR711.16mn. Trading volume decreased by 37.73% to reach 62.1mn shares versus 99.7mn shares in the prior week. The number of transactions decreased by 23.04% to reach 29,358 transactions versus 38,149 transactions in the prior week. The Banks and Financial Services sector led the trading volume, accounting for 29.24%, followed by the Transportation sector which accounted for 25.01% of the overall trading volume. Qatar Gas Transport Co. (QGTS) was the top volume traded stock during the week with 15.4mn shares. Foreign institutions remained bullish with net buying of QR705.0mn vs. net buying of QR829.8mn in the prior week. Qatari institutions remained bearish with net selling of QR202.5mn vs. net selling of QR612.8mn in the week before. Foreign retail investors remained bearish with net selling of QR61.4mn vs. net selling of QR17.2mn in the prior week. Qatari retail investors remained bearish with net selling of QR441.2mn vs. net selling of QR199.9mn the week before. Foreign institutions bought (net basis) ~$900mn worth of Qatari equities YTD. Market Indicators Week ended June 7 , 2018 Week ended May 31 , 2018 Chg. % Value Traded (QR mn) 2,359.9 5,763.9 (59.1) Exch. Market Cap. (QR mn) 511,542.2 491,781.3 4.0 Volume (mn) 62.1 99.6 (37.7) Number of Transactions 29,358 38,149 (23.0) Companies Traded 44 42 4.8 Market Breadth 32:9 13:28 – Market Indices Close WTD% MTD% YTD% Total Return 16,283.90 4.1 4.1 13.9 ALL Share Index 2,707.31 4.1 4.1 10.4 Banks and Financial Services 3,296.57 3.8 3.8 22.9 Industrials 2,935.50 3.0 3.0 12.0 Transportation 1,871.52 0.7 0.7 5.9 Real Estate 1,673.02 2.9 2.9 (12.7) Insurance 3,279.11 12.5 12.5 (5.8) Telecoms 1,021.92 8.8 8.8 (7.0) Consumer Goods & Services 6,045.38 4.8 4.8 21.8 Al Rayan Islamic Index 3,628.40 3.3 3.3 6.0 Market Indices Weekly Index Performance Regional Indices Close WTD% MTD% YTD% Weekly Exchange Traded Value ($ mn) Exchange Mkt. Cap. ($ mn) TTM P/E** P/B** Dividend Yield Qatar (QSE)* 9,242.30 4.1 4.1 8.4 650.78 140,469.5 13.8 1.4 4.8 Dubai 3,041.72 2.6 2.6 (9.7) 358.44 105,355.4# 9.8 1.2 5.6 Abu Dhabi 4,662.58 1.2 1.2 6.0 191.86 127,928.9 12.5 1.4 5.2 Saudi Arabia# 8,383.23 2.7 2.7 16.0 5,660.17 534,493.5 18.9 1.9 3.1 Kuwait 4,837.41 0.4 0.4 (3.3) 174.83 33,757.5 14.6 0.9 4.1 Oman 4,596.51 (0.2) (0.2) (9.9) 31.26 19,293.7 11.4 1.0 5.3 Bahrain 1,263.79 (0.2) (0.2) (5.1) 27.81 19,828.4 8.2 0.8 6.5 Source: Bloomberg, country exchanges and Zawya (** Trailing Twelve Months; * Value traded ($ mn) do not include special trades, if any; # Data as of June 6, 2018) 8,930.98 9,117.39 9,310.51 9,327.77 9,242.30 0 9,000,000 18,000,000 8,900 9,150 9,400 3-Jun 4-Jun 5-Jun 6-Jun 7-Jun Volume QSE Index 4.1% 2.7% 2.6% 1.2% 0.4% (0.2%) (0.2%)(1.2%) 0.0% 1.2% 2.4% 3.6% 4.8% Qatar(QSE)* SaudiArabia Dubai AbuDhabi Kuwait Oman Bahrain
- 2. Page 2 of 6 News Economic & Corporate News Qatar’s non-financial corporate sector stays healthy, says IMF – Qatar’s non-financial corporate (NFC) sector balance sheets have remained healthy and will be able to withstand adverse scenarios of higher interest rate and earnings shocks, according to the International Monetary Fund (IMF). The NFC sector in Qatar has remained broadly resilient under low oil prices and when put under interest and earnings shock, the IMF stated in its Article IV consultation with Qatar. Though profitability, as measured by return on equity and assets, of Qatari corporate sector has declined, it is still high, it stated, adding Qatari companies remain resilient in the face of moderate to severe interest and earnings shocks. Further, Qatar has ample fiscal space to continue with gradual fiscal consolidation to ensure sufficient saving of the hydrocarbon wealth for future generations, IMF stated. Strengthened expenditure control, with emphasis on further public service reform and accelerated reform of the public utility companies, would help improve economic efficiency. (Gulf-Times.com, Qatar Tribune) Barwa gets approval to raise non-Qatari shareholding – Barwa Real Estate Company yesterday held the company’s Extraordinary General Assembly (EGA) and got approval for all the items on the agenda of the meeting, including a proposal to increase the shareholding percentage of non-Qataris in the shares of the company from 25 percent to 49 percent of the total shares of the company. All necessary measures are to be taken in accordance with the relevant laws and procedures to implement the said decision, after obtaining the approval from the Ministry of Economy. (Peninsula) IMF: Qatari banks on solid footing to withstand macroeconomic shocks – Solid profitability, robust capital base, lower bad loans and adequate provisioning help Qatar’s banking sector withstand severe macroeconomic shocks, according to the International Monetary Fund (IMF). Given the strong starting position of Qatar’s financial system, with low NPLs (non-performing loans) adequate provisioning, and solid profitability, banks can comfortably withstand higher NPLs and lower profits brought about by macroeconomic shocks. The combined capital of banks in the sample would remain above the Qatar Central Bank’s prescribed regulatory minimum of 10% CAR (capital adequacy ratio) under the shock and severe shock scenarios. Under the shock scenario, the NPLs would rise to about 9% and CAR would drop to 15% two years after the shock. Qatar’s banking sector remains healthy overall, reflecting high asset quality and strong capitalization amid challenging conditions, IMF added. In the last one year since the blockade, Qatar’s banks have seen their profitability, assets and capital increasing, even as they managed to reduce costs. According to the IMF, Qatar’s banks had high capitalization (capital adequacy ratio of 15.4%), high profitability despite recent moderation (return on assets of 1.6%), low non-performing loans (ratio of 1.5%), and reasonable provisioning ratio of non-performing loans (85%), as at end-September 2017. (Gulf-Times.com) IMF: Qatar can withstand blockade effects – Considerable buffers and sound macroeconomic policies have helped Qatar absorb shocks from lower hydrocarbon prices and the diplomatic rift with some countries in the region, according to the International Monetary Fund (IMF). Qatar’s growth performance remains resilient and the direct economic and financial impact of the Gulf crisis has been manageable, IMF stated in its Article IV consultation with Qatar. The availability of significant external and fiscal buffers and the strong financial sector should enable the country to withstand downside risks, including lower-than-envisaged oil prices, tighter global conditions and an escalation of the diplomatic rift. Terming that the near-term growth outlook is broadly ‘Positive’, it stated overall, GDP growth of 2.6% is projected for 2018. Non-hydrocarbon real GDP growth is estimated to have moderated to about 4% in 2017 due to on-going fiscal consolidation and the effect of the diplomatic rift. (Gulf- Times.com) Qatar Petroleum acquires 30% stake in two ExxonMobil affiliates – Qatar Petroleum signed an agreement with ExxonMobil to become 30% equity holder in two ExxonMobil affiliates in Argentina that hold different interests in hydrocarbon licenses for seven blocks in the world-class Vaca Muerta play in the onshore Neuquén basin. Qatar Petroleum’s President and CEO, Saad Sherida Al Kaabi and ExxonMobil Corporation’s Senior Vice President and Principal Financial Officer, Andrew P Swiger signed agreements. The agreements will give Qatar Petroleum 30% shareholding in ExxonMobil Exploration Argentina SRL and Mobil Argentina SA, which hold rights with other partners for seven blocks under unconventional exploration licenses with active drilling plans, as well as exploitation licenses with pilot drilling and production. (Gulf-Times.com) Qatar Petroleum eyes oil production growth in next ten years – Qatar Petroleum is planning to expand its production capacity from its current 4.8mn barrels per day (bpd) equivalent of oil to 6.5mn bpd in the next eight to ten years, according to Qatar Petroleum’s President and CEO, Saad Sherida Al Kaabi. Al Kaabi said the planned growth in production capacity is part of Qatar Petroleum’s long-term strategy. Al Kaabi said, “It goes hand-in-hand with the planned expansion of our local production from the North Field, which will further boost Qatar’s leading global position by raising its LNG production from 77mn to 100mn tons per year; and with the recently announced Petrochemicals Complex project, which includes the largest ethane cracker in the Middle East, and one of the largest in the world.” (Gulf-Times.com)
- 3. Page 3 of 6 Qatar Stock Exchange Top Gainers Top Decliners Source: Qatar Stock Exchange (QSE) Source: Qatar Stock Exchange (QSE) Most Active Shares by Value (QR Million) Most Active Shares by Volume (Million) Source: Qatar Stock Exchange (QSE) Source: Qatar Stock Exchange (QSE) Investor Trading Percentage to Total Value Traded Net Traded Value by Nationality (QR Million) Source: Qatar Stock Exchange (QSE) Source: Qatar Stock Exchange (QSE) 19.3% 11.4% 11.1% 7.4% 7.0% 0.0% 7.0% 14.0% 21.0% Qatar Insurance Ooredoo Medicare Group Mazaya Qatar Qatar Islamic Bank -5.2% -3.5% -3.1% -2.8% -2.8% -6.0% -4.0% -2.0% 0.0% QatarNavigation SalamInternational Investment Al KhaleejTakaful Insurance QatarIndustrial Manufacturing GulfWarehousing 711.2 247.0 228.2 165.8 149.2 0.0 300.0 600.0 900.0 QNB Group Qatar Gas Transport (Nakilat) Qatar Islamic Bank Masraf Al Rayan Qatar Insurance 15.4 6.8 4.8 4.4 4.3 0.0 6.0 12.0 18.0 Qatar Gas Transport (Nakilat) Vodafone Qatar Masraf Al Rayan QNB Group Mesaieed Petrochemical Holding Company 0% 20% 40% 60% 80% 100% Buy Sell 24.27% 42.96% 10.76% 19.34% 6.12% 8.72% 58.86% 28.98% Qatari Individuals Qatari Institutions Non-Qatari Individuals Non-Qatari Institutions 827 1,533 1,470 890 (644) 644 (1,000) (500) - 500 1,000 1,500 2,000 Qatari Non-Qatari Net Investment Total Sold Total Bought
- 4. Page 4 of 6 TECHNICAL ANALYSIS OF THE QSE INDEX Source: Bloomberg The QE General Index closed up by 4.07% from the week before, and closed at 9,242.30 for Thursday’s close. The good news is that the Index closed above the 9,000 level, which puts our next resistance at the 9,500-9,600 level. However, how support remains around the 8,600 level. DEFINITIONS OF KEY TERMS USED IN TECHNICAL ANALYSIS RSI (Relative Strength Index) indicator – RSI is a momentum oscillator that measures the speed and change of price movements. The RSI oscillates between 0 to 100. The index is deemed to be overbought once the RSI approaches the 70 level, indicating that a correction is likely. On the other hand, if the RSI approaches 30, it is an indication that the index may be getting oversold and therefore likely to bounce back. MACD (Moving Average Convergence Divergence) indicator – The indicator consists of the MACD line and a signal line. The divergence or the convergence of the MACD line with the signal line indicates the strength in the momentum during the uptrend or downtrend, as the case may be. When the MACD crosses the signal line from below and trades above it, it gives a positive indication. The reverse is the situation for a bearish trend. Candlestick chart – A candlestick chart is a price chart that displays the high, low, open, and close for a security. The ‘body’ of the chart is portion between the open and close price, while the high and low intraday movements form the ‘shadow’. The candlestick may represent any time frame. We use a one-day candlestick chart (every candlestick represents one trading day) in our analysis. Doji candlestick pattern – A Doji candlestick is formed when a security's open and close are practically equal. The pattern indicates indecisiveness, and based on preceding price actions and future confirmation, may indicate a bullish or bearish trend reversal. Shooting Star/Inverted Hammer candlestick patterns – These candlestick patterns have a small real body (open price and close price are near to each other), and a long upper shadow (large intraday movement on the upside). The Shooting Star is a bearish reversal pattern that forms after a rally. The Inverted Hammer looks exactly like a Shooting Star, but forms after a downtrend. Inverted Hammers represent a potential bullish trend reversal.
- 5. Page 5 of 6 Source: Bloomberg Company Name Price June 07 % Change WTD % Change YTD Market Cap. QR Million TTM P/E P/B Div. Yield Qatar National Bank 164.00 3.39 30.15 151,477 12.0 2.5 3.7 Qatar Islamic Bank 122.80 6.98 26.60 29,017 13.1 2.1 4.1 Commercial Bank of Qatar 38.01 0.69 31.52 15,384 22.6 1.0 2.6 Doha Bank 27.16 4.26 (4.70) 8,421 8.7 1.0 11.0 Al Ahli Bank 30.20 0.67 (18.67) 6,353 9.7 1.3 3.2 Qatar International Islamic Bank 53.63 3.63 (1.78) 8,118 9.6 1.3 7.5 Masraf Al Rayan 35.01 4.60 (7.26) 26,258 12.8 2.2 5.7 Al Khalij Commercial Bank 10.90 (0.91) (23.24) 3,924 7.8 0.8 6.8 Qatar First Bank 5.41 0.00 (17.15) 1,082 N/A 0.7 N/A National Leasing 9.69 6.25 (9.52) 479 128.5 0.5 5.2 Dlala Holding 13.59 5.84 (7.55) 386 41.4 1.7 N/A Qatar & Oman Investment 6.25 4.17 (20.89) 197 38.0 0.7 8.0 Islamic Holding Group 27.90 1.09 (25.60) 158 N/A 1.2 N/A Banking and Financial Services 251,254 Zad Holding 80.36 0.70 9.13 1,156 9.8 1.5 7.3 Qatar German Co. for Medical Devices 5.35 3.28 (17.18) 62 N/A 1.2 N/A Salam International Investment 5.27 (3.48) (23.51) 602 N/A 0.4 N/A Medicare Group 62.98 11.06 (9.84) 1,773 21.4 2.0 2.9 Qatar Cinema & Film Distribution 22.00 0.00 (12.00) 138 18.1 1.0 4.5 Qatar Fuel 143.95 6.24 41.04 14,312 13.1 2.2 5.6 Widam Food Co. 60.90 1.50 (2.56) 1,096 9.8 3.8 7.0 Mannai Corp. 47.00 1.97 (21.01) 2,144 4.2 0.8 8.5 Al Meera Consumer Goods 152.00 2.46 4.90 3,040 15.4 2.4 5.6 Consumer Goods and Services 24,324 Qatar Industrial Manufacturing 40.23 (2.80) (7.94) 1,912 9.7 1.3 7.5 Qatar National Cement 55.60 (0.68) (11.61) 3,634 10.9 1.2 8.1 Industries Qatar 108.85 6.18 12.22 65,854 18.0 2.0 4.6 Qatari Investors Group 30.99 3.30 (15.33) 3,853 15.2 1.5 2.4 Qatar Electricity and Water 190.00 0.00 6.74 20,900 12.6 2.3 4.1 Aamal 9.24 0.22 6.45 5,821 11.6 0.7 6.5 Gulf International Services 17.29 2.43 (2.32) 3,213 40.6 0.9 N/A Mesaieed Petrochemical Holding 15.65 (1.45) 24.31 19,661 16.0 1.4 4.5 Invesment Holding Group 5.56 2.77 (8.85) 461 10.8 0.5 9.9 Industrials 125,310 Qatar Insurance 39.31 19.34 (13.08) 12,536 46.1 1.4 3.3 Doha Insurance 12.90 (0.77) (7.86) 645 15.1 0.6 5.8 Qatar General Insurance & Reinsurance 50.00 0.00 2.04 4,375 13.7 0.7 4.4 Al Khaleej Takaful Insurance 11.00 (3.08) (16.92) 281 41.9 0.6 4.5 Qatar Islamic Insurance 50.50 2.54 (8.13) 758 12.2 2.4 6.9 Insurance 18,595 United Development 14.75 1.72 2.57 5,223 10.0 0.5 8.5 Barw a Real Estate 34.63 0.99 8.22 13,475 8.3 0.7 7.2 Ezdan Real Estate 8.83 4.13 (26.90) 23,422 26.9 0.8 N/A Mazaya Qatar Real Estate Development 6.82 7.40 (24.22) 790 48.2 0.5 N/A Real Estate 42,909 Ooredoo 74.75 11.40 (17.63) 23,944 12.8 1.1 4.7 Vodafone Qatar 8.60 4.88 7.23 7,270 N/A 1.6 N/A Telecoms 31,214 Qatar Navigation (Milaha) 59.70 (5.24) 6.72 6,837 13.7 0.5 5.9 Gulf Warehousing 41.26 (2.80) (6.21) 2,418 10.9 1.6 4.1 Qatar Gas Transport (Nakilat) 15.67 6.60 (2.67) 8,682 10.0 1.5 6.4 Transportation 17,937 Qatar Exchange 511,542
- 6. Contacts Saugata Sarkar, CFA, CAIA Shahan Keushgerian Zaid al-Nafoosi , CMT, CFTe Head of Research Senior Research Analyst Senior Research Analyst Tel: (+974) 4476 6534 Tel: (+974) 4476 6509 Tel: (+974) 4476 6535 saugata.sarkar@qnbfs.com.qa shahan.keushgerian@qnbfs.com.qa zaid.alnafoosi@qnbfs.com.qa Mohamed Abo Daff QNB Financial Services Co. W.L.L. Senior Research Analyst Contact Center: (+974) 4476 6666 Tel: (+974) 4476 6589 PO Box 24025 mohd.abodaff@qnbfs.com.qa Doha, Qatar Disclaimer and Copyright Notice: This publication has been prepared by QNB Financial Services Co. W.L.L. (“QNBFS”) a wholly-owned subsidiary of Qatar National Bank (Q.P.S.C.). QNBFS is regulated by the Qatar Financial Markets Authority and the Qatar Exchange. Qatar National Bank (Q.P.S.C.) is regulated by the Qatar Central Bank. This publication expresses the views and opinions of QNBFS at a given time only. It is not an offer, promotion or recommendation to buy or sell securities or other investments, nor is it intended to constitute legal, tax, accounting, or financial advice. QNBFS accepts no liability whatsoever for any direct or indirect losses arising from use of this report. Any investment decision should depend on the individual circumstances of the investor and be based on specifically engaged investment advice. We therefore strongly advise potential investors to seek independent professional advice before making any investment decision. Although the information in this report has been obtained from sources that QNBFS believes to be reliable, we have not independently verified such information and it may not be accurate or complete. QNBFS does not make any representations or warranties as to the accuracy and completeness of the information it may contain, and declines any liability in that respect. For reports dealing with Technical Analysis, expressed opinions and/or recommendations may be different or contrary to the opinions/recommendations of QNBFS Fundamental Research as a result of depending solely on the historical technical data (price and volume). QNBFS reserves the right to amend the views and opinions expressed in this publication at any time. It may also express viewpoints or make investment decisions that differ significantly from, or even contradict, the views and opinions included in this report. This report may not be reproduced in whole or in part without permission from QNBFS COPYRIGHT: No part of this document may be reproduced without the explicit written permission of QNBFS. Page 6 of 6