

Recommended
Recommended
More Related Content
What's hot
What's hot (20)
Viewers also liked
Viewers also liked (19)
Similar to Weekly market report
Similar to Weekly market report (20)
More from QNB Group
More from QNB Group (20)
Recently uploaded
Recently uploaded (20)
Weekly market report
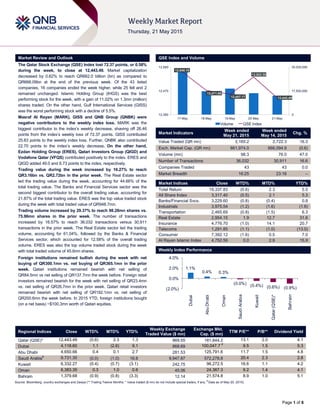
- 1. ` Page 1 of 6 Market Review and Outlook QSE Index and Volume The Qatar Stock Exchange (QSE) Index lost 72.37 points, or 0.58% during the week, to close at 12,443.49. Market capitalization decreased by 0.62% to reach QR662.0 billion (bn) as compared to QR666.09bn at the end of the previous week. Of the 43 listed companies, 16 companies ended the week higher, while 25 fell and 2 remained unchanged. Islamic Holding Group (IHGS) was the best performing stock for the week, with a gain of 11.02% on 1.3mn (million) shares traded. On the other hand, Gulf International Services (GISS) was the worst performing stock with a decline of 5.5%. Masraf Al Rayan (MARK), GISS and QNB Group (QNBK) were negative contributors to the weekly index loss. MARK was the biggest contributor to the index’s weekly decrease, shaving off 26.46 points from the index’s weekly loss of 72.37 points. GISS contributed 25.83 points to the weekly index loss. Further, QNBK also contributed 22.70 points to the index’s weekly decrease. On the other hand, Ezdan Holding Group (ERES), Qatari Investors Group (QIGD) and Vodafone Qatar (VFQS) contributed positively to the index. ERES and QIGD added 49.0 and 8.73 points to the index, respectively. Trading value during the week increased by 16.27% to reach QR3.16bn vs. QR2.72bn in the prior week. The Real Estate sector led the trading value during the week, accounting for 44.66% of the total trading value. The Banks and Financial Services sector was the second biggest contributor to the overall trading value, accounting for 21.87% of the total trading value. ERES was the top value traded stock during the week with total traded value of QR948.7mn. Trading volume increased by 29.37% to reach 98.28mn shares vs. 75.96mn shares in the prior week. The number of transactions increased by 16.57% to reach 36,032 transactions versus 30,911 transactions in the prior week. The Real Estate sector led the trading volume, accounting for 61.04%, followed by the Banks & Financial Services sector, which accounted for 12.58% of the overall trading volume. ERES was also the top volume traded stock during the week with total traded volume of 45.6mn shares. Foreign institutions remained bullish during the week with net buying of QR300.1mn vs. net buying of QR365.1mn in the prior week. Qatari institutions remained bearish with net selling of QR84.5mn vs net selling of QR137.7mn the week before. Foreign retail investors remained bearish for the week with net selling of QR23.4mn vs. net selling of QR26.7mn in the prior week. Qatari retail investors remained bearish with net selling of QR192.1mn vs. net selling of QR200.6mn the week before. In 2015 YTD, foreign institutions bought (on a net basis) ~$100.3mn worth of Qatari equities. Market Indicators Week ended May 21, 2015 Week ended May 14, 2015 Chg. % Value Traded (QR mn) 3,165.2 2,722.3 16.3 Exch. Market Cap. (QR mn) 661,974.0 666,094.9 (0.6) Volume (mn) 98.3 76.0 47.0 Number of Transactions 36,032 30,911 16.6 Companies Traded 43 43 0.0 Market Breadth 16:25 23:16 – Market Indices Close WTD% MTD% YTD% Total Return 19,337.83 (0.6) 2.3 5.5 All Share Index 3,317.40 (0.5) 2.1 5.3 Banks/Financial Svcs. 3,229.60 (0.8) (0.4) 0.8 Industrials 3,975.54 (1.2) (1.6) (1.6) Transportation 2,465.69 (0.8) (1.5) 6.3 Real Estate 2,954.15 1.9 12.7 31.6 Insurance 4,776.70 (1.0) 14.1 20.7 Telecoms 1,291.85 (1.1) (1.0) (13.0) Consumer 7,392.12 (1.6) 0.5 7.0 Al Rayan Islamic Index 4,752.59 0.0 2.9 15.9 Market Indices Weekly Index Performance Regional Indices Close WTD% MTD% YTD% Weekly Exchange Traded Value ($ mn) Exchange Mkt. Cap. ($ mn) TTM P/E** P/B** Dividend Yield Qatar (QSE)* 12,443.49 (0.6) 2.3 1.3 869.55 181,844.2 13.1 2.0 4.1 Dubai 4,118.60 1.1 (2.6) 9.1 868.69 100,047.7 # 9.5 1.5 5.3 Abu Dhabi 4,650.66 0.4 0.1 2.7 281.53 125,791.6 11.7 1.5 4.8 Saudi Arabia# 9,731.30 (0.0) (1.0) 16.8 9,947.87 572,278.8 20.4 2.3 2.8 Kuwait 6,332.27 (0.4) (0.7) (3.1) 242.75 96,272.5 16.6 1.1 4.2 Oman 6,383.35 0.3 1.0 0.6 45.06 24,367.3 9.2 1.4 4.1 Bahrain 1,379.68 (0.9) (0.8) (3.3) 12.14 21,574.8 8.9 1.0 5.1 Source: Bloomberg, country exchanges and Zawya (** Trailing Twelve Months; * Value traded ($ mn) do not include special trades, if any; # Data as of May 20, 2015) 12,540.10 12,471.89 12,457.17 12,522.30 12,443.49 0 17,500,000 35,000,000 12,380 12,470 12,560 17-May 18-May 19-May 20-May 21-May Volume QSE Index 1.1% 0.4% 0.3% (0.0%) (0.4%) (0.6%) (0.9%)(2.0%) 0.0% 2.0% 4.0% Dubai AbuDhabi Oman SaudiArabia Kuwait Qatar(QSE)* Bahrain
- 2. Page 2 of 6 News Market & Corporate News QNBFS: Qatari equities’ earnings remain resilient in 1Q2015 despite weak oil prices – QNB Financial Services (QNBFS) said in a report that Qatari equities’ (excluding Vodafone Qatar) earnings remained resilient in 1Q2015 despite weak oil prices and saw their net income grow 3.3% QoQ and a robust 21.9% YoY. The overall earnings of 43-listed stocks was driven by strong growth from real estate, banking, telecom and transportation sectors, but were constrained by a weak performance at industrials, insurance and consumer sectors. The earnings growth was restricted by a correction in commodity prices and the seasonal nature of some companies. Weak oil prices weighed heavily on investor sentiment as the Qatar Stock Exchange (the benchmark QSE Index) posted a decline of 4.7% in 1Q2015. Going forward, QNBFS believes Qatar’s long- term fundamental story remains intact. However, international oil prices will be the key to investor sentiment and the near-term direction of the market. (Gulf-Times.com) QNBK plans expansion in South East Asia – QNB Group (QNBK) CEO Ali Ahmed al-Kuwari, in the bank’s annual strategy conference held in Oman, said that QNBK is planning to expand in South East Asia given the growing ‘East-West’ trade between Qatar and Asia. He added that QNBK, which recently opened a representative office in Ho Chi Min City in Vietnam, views Asia as “strategically important”. The theme of the two- day conference was built around QNBK’s stated vision of being a “Middle East & Africa Icon” by 2017. QNBK’s presence through its subsidiaries and associates extends to more than 27 countries across three continents, providing a comprehensive range of value-added products and services. (Gulf-Times.com) KCBK, NBF successfully close landmark transaction for Pacific Controls – Al Khalij Commercial Bank (KCBK), along with the National Bank of Fujairah (NBF) have successfully closed a landmark transaction for Pacific Controls. KCBK, partnering with the NBF, acted as underwriter and mandated lead arranger for the syndicated term finance facility of AED750mn for Pacific Controls. The deal received an oversubscription of 33%, amounting to AED1bn. The syndicate of banks included Al Khaliji France, Dubai Islamic Bank, United Arab Bank, Ajman Bank, Sharjah Islamic Bank and National Bank of Oman. Pacific Controls is an international ICT (Information and Communication Technology) player. (QSE) QIIK signs Al Dhameen program portfolio agreement with QDB – Qatar International Islamic Bank (QIIK) has signed an Al Dhameen program portfolio agreement with the Qatar Development Bank (QDB). The ‘Al Dhameen portfolio’ is a portfolio worth QR100mn, aimed at facilitating approvals to guarantee the financing value provided by the partner bank to small & medium sized enterprises (SMEs) lacking sufficient guarantees. The agreement enables further expansion of SME financing. (QSE) QCSD raises CBQK’s foreign ownership to 49% – The Qatar Central Securities Depository (QCSD) has amended the foreign ownership percentage in the Commercial Bank of Qatar’s (CBQK) shares, increasing it to 49% of the total capital effective from May 18, 2015. This amendment is pursuant to Law no. 9 that allows foreign investors to own shares in listed companies by no more than 49% of each company’s capital listed on the Qatar Stock Exchange. The law also provides for the treatment of the GCC citizens as Qataris in terms of owning the shares of listed companies. (QSE) Al Rayan Bank plans expansion in Europe – Al Rayan Bank, owned by Masraf Al Rayan’s (MARK) UK subsidiary Al Rayan (UK) Limited, plans to expand into continental Europe. Al Rayan Bank CEO Sultan Choudhury said that the bank will study extending its operations to France in 2015. He added that the feasibility study will be done for the whole of Europe, with France being the first country assessed. Al Rayan also started a private banking branch in London’s Knightsbridge last week to target affluent clients from the Gulf Cooperation Council region, seeking to boost their contribution to revenue to a third from 20% at present. (Gulf-Times.com) QIBK to boost capital via bond sales; QIB-UK to offer investment solutions for London properties – Qatar Islamic Bank’s (QIBK) CFO, Gourang Hemani said that the bank expects to issue a Tier 1 capital-boosting bond between 2Q2015 and 3Q2015 to help boost core capital and comply with Basel III banking standards. The bond will have a perpetual tenor. The issue will most likely be through a private placement within Qatar. The bank had received shareholder’s approval to issue up to QR5.0bn to increase its core capital in February 2015. Meanwhile, QIBK’s wholly-owned subsidiary, QIB-UK is looking to develop suitable financial solutions for Qatari nationals, which meets their investment and financing needs in the UK as London is increasingly becoming a favorite destination for business, investment, educational or personal purposes. QIB-UK is well positioned to support interested customers throughout the process of identifying real estate opportunities, getting access to exclusive deals, obtaining the required financing and concluding the deal in an efficient manner. (GulfBase.com, Peninsula Qatar) MARK’s UK subsidiary opens branch for GCC clients in London – Masraf Al Rayan’s (MARK) UK subsidiary, Al Rayan Bank has officially opened its new private banking branch in Knightsbridge, London. The branch will provide exclusive private banking services to Gulf Cooperation Council (GCC) clients. (Gulf-Times.com)
- 3. Page 3 of 6 Qatar Stock Exchange Top Gainers Top Decliners Source: Qatar Stock Exchange (QSE) Source: Qatar Stock Exchange (QSE) Most Active Shares by Value (QR Million) Most Active Shares by Volume (Million) Source: Qatar Stock Exchange (QSE) Source: Qatar Stock Exchange (QSE) Investor Trading Percentage to Total Value Traded Net Traded Value by Nationality (QR Million) Source: Qatar Stock Exchange (QSE) Source: Qatar Stock Exchange (QSE) 11.0% 6.6% 5.3% 5.3% 4.5% 0.0% 4.0% 8.0% 12.0% Islamic Holding Group Qatar Cinema & Film Distribution Qatar German Co. for Medical Devices Doha Insurance Al Khaliji -5.5% -3.5% -3.2% -2.3% -2.3% -6.0% -4.0% -2.0% 0.0% Gulf International Services Aamal Zad Holding Mesaieed Petrochemical Holding Company Medicare Group 948.7 293.8 256.9 178.9 178.2 0.0 333.3 666.7 1,000.0 Ezdan Real Estate Barwa Real Estate Masraf Al Rayan Islamic Holding Group Qatar Insurance 45.6 7.9 7.1 5.8 5.5 0.0 16.7 33.3 50.0 Ezdan Real Estate Vodafone Qatar Mazaya Qatar Barwa Real Estate Masraf Al Rayan 0% 20% 40% 60% 80% 100% Buy Sell 45.68% 51.75% 14.15% 16.82% 16.97% 17.71% 23.20% 13.72% Qatari Individuals Qatari Institutions Non-Qatari Individuals Non-Qatari Institutions 1,894 1,271 2,170 995 (277) 277 (500) - 500 1,000 1,500 2,000 2,500 Qatari Non-Qatari Net Investment Total Sold Total Bought
- 4. Page 4 of 6 TECHNICAL ANALYSIS OF THE QSE INDEX Source: Bloomberg The QSE Index started the week up but then lost ground and ended the week in the red, losing 0.58% from last week’s closing. The Index almost reached the expected heavy resistance below the 12,800 level. Over the longer term, the Index is positioned between a medium-term downtrend and a long-term uptrend. As a result, the Index may oscillate between the two lines, giving the expected resistance level 12,800 and the support level of 12,000. DEFINITIONS OF KEY TERMS USED IN TECHNICAL ANALYSIS RSI (Relative Strength Index) indicator – RSI is a momentum oscillator that measures the speed and change of price movements. The RSI oscillates between 0 to 100. The index is deemed to be overbought once the RSI approaches the 70 level, indicating that a correction is likely. On the other hand, if the RSI approaches 30, it is an indication that the index may be getting oversold and therefore likely to bounce back. MACD (Moving Average Convergence Divergence) indicator – The indicator consists of the MACD line and a signal line. The divergence or the convergence of the MACD line with the signal line indicates the strength in the momentum during the uptrend or downtrend, as the case may be. When the MACD crosses the signal line from below and trades above it, it gives a positive indication. The reverse is the situation for a bearish trend. Candlestick chart – A candlestick chart is a price chart that displays the high, low, open, and close for a security. The ‘body’ of the chart is portion between the open and close price, while the high and low intraday movements form the ‘shadow’. The candlestick may represent any time frame. We use a one-day candlestick chart (every candlestick represents one trading day) in our analysis. Doji candlestick pattern – A Doji candlestick is formed when a security's open and close are practically equal. The pattern indicates indecisiveness, and based on preceding price actions and future confirmation, may indicate a bullish or bearish trend reversal. Shooting Star/Inverted Hammer candlestick patterns – These candlestick patterns have a small real body (open price and close price are near to each other), and a long upper shadow (large intraday movement on the upside). The Shooting Star is a bearish reversal pattern that forms after a rally. The Inverted Hammer looks exactly like a Shooting Star, but forms after a downtrend. Inverted Hammers represent a potential bullish trend reversal.
- 5. Page 5 of 6 Source: Bloomberg Company Name Price (May 21) % Change 5- Day % Change YTD Market Cap. QR Million TTM P/E P/B Div. Yield Qatar National Bank 196.50 (1.26) (7.70) 137,497 12.8 2.6 3.8 Qatar Islamic Bank 105.20 (0.47) 2.94 24,858 15.1 2.4 4.0 Commercial Bank of Qatar 56.50 (0.70) (9.27) 18,455 10.3 1.1 5.6 Doha Bank 55.60 0.36 (2.46) 14,365 10.4 1.3 7.2 Al Ahli Bank 48.90 1.88 (1.48) 8,886 14.3 2.2 2.8 Qatar International Islamic Bank 80.10 (0.87) (1.96) 12,125 14.6 2.4 5.0 Masraf Al Rayan 45.80 (2.24) 3.62 34,350 16.5 3.3 3.8 Al Khaliji Bank 22.00 4.51 (0.23) 7,920 13.2 1.4 4.6 National Leasing 21.14 1.39 5.70 1,046 38.1 0.8 4.0 Dlala Holding 27.50 (0.54) (17.76) 781 13.9 2.7 N/A Qatar & Oman Investment 16.22 (1.10) 5.32 511 16.6 1.5 4.9 Islamic Holding Group 141.00 11.02 13.25 564 34.1 9.5 2.1 Banking and Financial Services 261,358 Zad Holding 99.60 (3.21) 18.57 1,303 11.8 1.6 4.0 Qatar German Co. for Medical Devices 18.00 5.26 77.34 208 N/A 1.3 N/A Salam International Investment 14.14 (1.12) (10.79) 1,616 20.2 1.0 4.2 Medicare Group 170.00 (2.30) 45.30 4,784 24.3 5.7 1.1 Qatar Cinema & Film Distribution 46.90 6.59 17.25 295 23.7 2.1 1.9 Qatar Fuel 179.70 (1.26) (12.04) 15,177 13.3 2.5 5.0 Qatar Meat and Livestock 61.00 (1.61) 0.99 1,098 20.3 4.2 4.1 Al Meera Consumer Goods 246.30 (2.11) 23.15 4,926 21.4 3.9 3.6 Consumer Goods and Services 29,408 Qatar Industrial Manufacturing 46.70 1.52 7.73 2,219 14.4 1.6 6.4 Qatar National Cement 123.00 0.33 2.50 6,643 16.0 2.6 3.0 Industries Qatar 142.00 (0.35) (15.48) 85,910 15.1 2.8 4.9 Qatari Investors Group 54.00 4.05 30.43 6,714 29.0 3.0 1.4 Qatar Electricity and Water 215.10 (0.42) 14.72 23,661 14.6 3.8 3.5 Mannai Corp. 113.80 (1.04) 4.40 5,191 9.6 2.5 5.3 Aamal 16.50 (3.51) 14.06 10,395 17.6 1.5 5.8 Gulf International Services 78.90 (5.51) (18.74) 14,663 9.3 4.2 7.0 Mesaieed Petrochemical Holding 25.50 (2.30) -13.6 32,036 22.2 2.4 4.3 Industrials 187,433 Qatar Insurance 97.00 (2.02) 23.12 17,908 18.2 3.1 2.2 Doha Insurance 27.00 5.26 (6.90) 1,350 12.5 1.3 3.7 Qatar General Insurance & Reinsurance 57.00 1.24 11.10 4,534 5.0 0.8 3.1 Al Khaleej Takaful Insurance 43.50 (0.80) (1.53) 1,110 14.9 1.8 3.0 Qatar Islamic Insurance 85.40 (0.70) 8.10 1,281 15.3 4.5 4.7 Insurance 26,184 United Development 23.65 0.00 0.25 8,374 15.6 0.8 5.3 Barw a Real Estate 51.00 0.00 21.72 19,845 3.4 1.1 4.3 Ezdan Real Estate 20.41 3.08 36.80 54,137 38.0 1.8 2.0 Mazaya Qatar Real Estate Development 19.39 2.54 6.32 2,036 11.7 1.5 1.5 Real Estate 84,393 Qatar Telecom 96.00 (2.04) (22.52) 30,751 17.6 1.5 4.2 Vodafone Qatar 17.88 1.42 8.69 15,116 N/A 2.7 1.0 Telecoms 45,866 Qatar Navigation (Milaha) 98.10 (1.51) (1.41) 11,235 10.5 0.9 5.6 Gulf Warehousing 73.30 1.52 29.96 3,486 23.0 4.0 2.0 Qatar Gas Transport (Nakilat) 22.52 (0.88) (2.51) 12,611 13.7 4.3 5.3 Transportation 27,332 Qatar Exchange 661,974
- 6. Contacts Saugata Sarkar Sahbi Kasraoui QNB Financial Services SPC Head of Research Head of HNI Contact Center: (+974) 4476 6666 Tel: (+974) 4476 6534 Tel: (+974) 4476 6544 PO Box 24025 saugata.sarkar@qnbfs.com.qa sahbi.alkasraoui@qnbfs.com.qa Doha, Qatar Disclaimer and Copyright Notice: This publication has been prepared by QNB Financial Services SPC (“QNBFS”) a wholly-owned subsidiary of QNB SAQ (“QNB”). QNBFS is regulated by the Qatar Financial Markets Authority and the Qatar Exchange QNB SAQ is regulated by the Qatar Central Bank. This publication expresses the views and opinions of QNBFS at a given time only. It is not an offer, promotion or recommendation to buy or sell securities or other investments, nor is it intended to constitute legal, tax, accounting, or financial advice. QNBFS accepts no liability whatsoever for any direct or indirect losses arising from use of this report. Any investment decision should depend on the individual circumstances of the investor and be based on specifically engaged investment advice. We therefore strongly advise potential investors to seek independent professional advice before making any investment decision. Although the information in this report has been obtained from sources that QNBFS believes to be reliable, we have not independently verified such information and it may not be accurate or complete. QNBFS does not make any representations or warranties as to the accuracy and completeness of the information it may contain, and declines any liability in that respect. For reports dealing with Technical Analysis, expressed opinions and/or recommendations may be different or contrary to the opinions/recommendations of QNBFS Fundamental Research as a result of depending solely on the historical technical data (price and volume). QNBFS reserves the right to amend the views and opinions expressed in this publication at any time. It may also express viewpoints or make investment decisions that differ significantly from, or even contradict, the views and opinions included in this report. This report may not be reproduced in whole or in part without permission from QNBFS COPYRIGHT: No part of this document may be reproduced without the explicit written permission of QNBFS. Page 6 of 6