1. `
Page 1 of 6
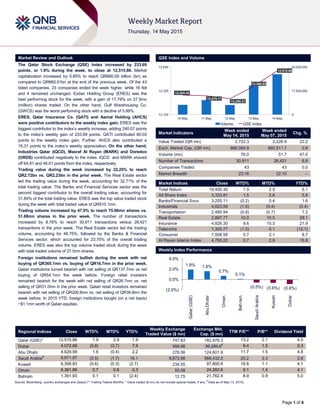
Market Review and Outlook QSE Index and Volume
The Qatar Stock Exchange (QSE) Index increased by 233.69
points, or 1.9% during the week, to close at 12,515.86. Market
capitalization increased by 0.85% to reach QR660.09 billion (bn) as
compared to QR660.51bn at the end of the previous week. Of the 43
listed companies, 23 companies ended the week higher, while 16 fell
and 4 remained unchanged. Ezdan Holding Group (ERES) was the
best performing stock for the week, with a gain of 17.79% on 27.5mn
(million) shares traded. On the other hand, Gulf Warehousing Co.
(GWCS) was the worst performing stock with a decline of 5.99%.
ERES, Qatar Insurance Co. (QATI) and Aamal Holding (AHCS)
were positive contributors to the weekly index gain. ERES was the
biggest contributor to the index’s weekly increase, adding 240.07 points
to the index’s weekly gain of 233.69 points. QATI contributed 80.03
points to the weekly index gain. Further, AHCS also contributed a
16.31 points to the index’s weekly appreciation. On the other hand,
Industries Qatar (IQCD), Masraf Al Rayan (MARK) and Ooredoo
(ORDS) contributed negatively to the index. IQCD and MARK shaved
off 64.81 and 46.61 points from the index, respectively.
Trading value during the week increased by 22.25% to reach
QR2.72bn vs. QR2.23bn in the prior week. The Real Estate sector
led the trading value during the week, accounting for 32.71% of the
total trading value. The Banks and Financial Services sector was the
second biggest contributor to the overall trading value, accounting for
31.84% of the total trading value. ERES was the top value traded stock
during the week with total traded value of QR510.1mn.
Trading volume increased by 47.0% to reach 75.96mn shares vs.
51.68mn shares in the prior week. The number of transactions
increased by 8.76% to reach 30,911 transactions versus 28,421
transactions in the prior week. The Real Estate sector led the trading
volume, accounting for 48.75%, followed by the Banks & Financial
Services sector, which accounted for 23.70% of the overall trading
volume. ERES was also the top volume traded stock during the week
with total traded volume of 27.5mn shares.
Foreign institutions remained bullish during the week with net
buying of QR365.1mn vs. buying of QR16.7mn in the prior week.
Qatari institutions turned bearish with net selling of QR137.7mn vs net
buying of QR54.1mn the week before. Foreign retail investors
remained bearish for the week with net selling of QR26.7mn vs. net
selling of QR31.0mn in the prior week. Qatari retail investors remained
bearish with net selling of QR200.6mn vs. net selling of QR39.9mn the
week before. In 2015 YTD, foreign institutions bought (on a net basis)
~$1.1mn worth of Qatari equities.
Market Indicators
Week ended
May 14, 2015
Week ended
May 07, 2015
Chg. %
Value Traded (QR mn) 2,722.3 2,226.9 22.2
Exch. Market Cap. (QR mn) 666,094.9 660,511.7 0.8
Volume (mn) 76.0 51.7 47.0
Number of Transactions 30,911 28,421 8.8
Companies Traded 43 43 0.0
Market Breadth 23:16 32:10 –
Market Indices Close WTD% MTD% YTD%
Total Return 19,450.30 1.9 2.9 6.1
All Share Index 3,333.81 1.5 2.6 5.8
Banks/Financial Svcs. 3,255.11 (0.2) 0.4 1.6
Industrials 4,023.58 (1.5) (0.4) (0.4)
Transportation 2,485.94 (0.8) (0.7) 7.2
Real Estate 2,897.77 10.0 10.5 29.1
Insurance 4,826.30 9.6 15.3 21.9
Telecoms 1,305.77 (1.5) 0.1 (12.1)
Consumer 7,508.58 0.7 2.1 8.7
Al Rayan Islamic Index 4,750.22 0.7 2.9 15.8
Market Indices
Weekly Index Performance
Regional Indices Close WTD% MTD% YTD%
Weekly Exchange
Traded Value ($ mn)
Exchange Mkt.
Cap. ($ mn)
TTM P/E** P/B** Dividend Yield
Qatar (QSE)* 12,515.86 1.9 2.9 1.9 747.83 182,976.3 13.2 2.1 4.0
Dubai 4,072.68 (0.8) (3.7) 7.9 959.96 99,289.6#
9.4 1.5 5.3
Abu Dhabi 4,629.99 1.6 (0.4) 2.2 276.56 124,601.9 11.7 1.5 4.8
Saudi Arabia#
9,671.97 (0.5) (1.7) 16.1 8,872.88 568,432.5 20.2 2.3 2.8
Kuwait 6,356.83 (0.6) (0.3) (2.7) 234.55 97,800.6 16.8 1.1 4.1
Oman 6,361.86 0.7 0.6 0.3 55.58 24,260.6 9.1 1.4 4.1
Bahrain 1,391.93 0.1 0.1 (2.4) 12.75 21,762.4 8.9 0.9 5.0
Source: Bloomberg, country exchanges and Zawya (** Trailing Twelve Months; * Value traded ($ mn) do not include special trades, if any;
#
Data as of May 13, 2015)
12,285.45
12,279.17
12,250.21
12,366.92
12,515.86
0
17,500,000
35,000,000
12,100
12,325
12,550
10-May 11-May 12-May 13-May 14-May
Volume QSE Index
1.9% 1.6%
0.7%
0.1%
(0.5%) (0.6%) (0.8%)(2.0%)
0.0%
2.0%
4.0%
Qatar(QSE)
AbuDhabi
Oman
Bahrain
SaudiArabia
Kuwait
Dubai
2. Page 2 of 6
News
Market & Corporate News
MSCI adds QATI and ERES to MSCI EM Index while
increasing DHBK’s Weight – MSCI concluded the
semi-annual index review on May 12, 2015 with the
following results: 1) Qatar Insurance Co. was added to
the index with a weight of 0.05% due to the FOL increase
(49.0% vs. 25.0% previously), 2) Ezdan Holding Group
(ERES) was also added with a weight of 0.07%, 3) Doha
Bank’s weight was doubled to 0.04% due to the increase
in FOL from 25.0% to 49.0%. (MSCI, QNBFS Research)
QSE awaiting regulatory nod to launch 3 live ETFs –
The Qatar Stock Exchange (QSE) said it is ready to
launch three live exchange-traded funds (ETFs) but is
awaiting final clearance from the regulator. The QSE said
ETFs provide investors with the ability to buy the index
through a single trade on the exchange and ETFs also
offer exposure to a diversified portfolio of stocks with a
single execution. They can also be used to provide
exposure to non-domestic markets using the local
currency. ETFs globally have $3tn of assets under
management. (Gulf-Times.com)
MARK mulls Sukuk issue – According to sources,
Masraf Al Rayan (MARK) may sell Qatar’s first Sukuk in
more than 17 months. MARK has received proposals
from banks for a benchmark sized, debut Shari’ah-
compliant offering. According to Bloomberg, seven Qatari
borrowers have sold Sukuk, compared with at least 35 in
the UAE. Ooredoo was the last Qatari issuer to tap the
market when it had raised $1.25bn in December 2013.
(Bloomberg)
Ashghal: Contracts worth QR3.3bn awarded for
building new roads – The Public Works Authority
(Ashghal) has awarded contracts worth QR3.3bn for
building new roads and developing essential basic
infrastructure in different parts of the country, especially
in Wukair and Wakrah, under its Construction &
Development of Infrastructure in Local Areas program.
Senior Engineer & President of Ashghal, Nasser Ali al-
Mawlawi said besides facilitating smooth traffic flow
along the areas where works are to be undertaken, the
connectivity across the country will shoot up considerably
once the projects are completed. (Gulf-Times.com)
Moody's assigns A3/Prime-2 rating to KCBK –
Moody's Investors Service for the first time has assigned
Al Khalij Commercial Bank (KCBK) long & short term
local and foreign currency deposit ratings of A3/Prime-2
and a Baseline Credit Assessment (BCA) of ba1. The
long-term ratings carry a stable outlook. (Moody’s)
Moody's upgrades QIIK’s issuer ratings – Moody's
Investors Service has upgraded Qatar International
Islamic Bank's (QIIK) long term and short term issuer
rating to A2/Prime-1 from A3/Prime-2, and changed
baseline credit assessment (BCA) and adjusted BCA to
baa3 from ba1. Moody's also changed the outlook on the
bank's long term ratings to stable. Meanwhile, Moody's
assigned a new Counterparty Risk Assessment of A1 to
QIIK. (Moody’s)
KCBK partners with UDCD to offer special rate on
properties – Al Khalij Commercial Bank (KCBK) has
collaborated with United Development Company (UDCD)
to showcase its personal banking business products &
services, and exclusively offer visitors of Cityscape Qatar
2015 a special interest rate of 3.7% on reducing
balances on property financing. KCBK said it is
presenting the exclusive offer on mortgage loans to
Qataris and expatriates with tailored financial solutions &
support for home buyers, property investors, and home
owners looking for new opportunities. (Gulf-Times.com)
QNBK: Qatar’s global reserves total $39.5bn in March
– QNB Group (QNBK) in its recent ‘monthly monitor’
report said that Qatar’s international reserves totaled
$39.5bn in March and is expected to scale up further in
2015 on continued current account surpluses amid lower
oil prices. The report showed the country’s international
reserves stood at $39.1bn at February-
end. Accordingly, the import cover rose slightly to 7.3
months as at March- end, well above the IMF-
recommended level of three months for pegged
exchange rates. Qatari oil prices fell slightly in March
owing to weaker global demand. The stagnant Eurozone
economy, the recession in Japan and the slowdown in
emerging markets, especially China, are contributing to
the weakness in hydrocarbon demand and an oil supply
glut, which has led to lower international oil prices.
Qatar’s crude oil production rose to 708,000 barrels per
day (bpd) in March. Qatar Petroleum (QP) is
implementing a redevelopment program to steady
production at its oil fields which should stabilize oil
production to around 700,000 bpd, going forward.
According to the monthly monitor, Qatar’s foreign
merchandise trade balance registered a surplus of
QR16.5bn in March 2015, down from QR35.6bn in March
2014 as total exports fell by 40.7% YoY while imports
rose strongly by 9.9% YoY. Japan was the top export
destination in March, accounting for 22.6% of Qatar’s
exports, followed by South Korea (18.4%) and India
(9.6%). China was the largest exporter to Qatar in March
(11.7%), followed by the US (10.9%) and the UAE
(9.1%). The Qatar Central Bank (QCB) Real Estate Index
rose 29.6% YoY in March 2015. Further, the report
expects Qatar’s population to grow by 7% in 2015,
reflecting the continued large influx of expatriate workers.
(Gulf-Times.com)
GWCS awarded ISO 27001:2013 certification – Qatar’s
leading logistics provider Gulf Warehousing Company
(GWCS) has recently been awarded the ISO 27001:2013
certification for information security management
systems (ISMS) after a “thorough audit” of its record
management services (RMS) department by Lloyd’s
Register Quality Assurance. (Gulf-Times.com)
3. Page 3 of 6
Qatar Stock Exchange
Top Gainers Top Decliners
Source: Qatar Stock Exchange (QSE) Source: Qatar Stock Exchange (QSE)
Most Active Shares by Value (QR Million) Most Active Shares by Volume (Million)
Source: Qatar Stock Exchange (QSE) Source: Qatar Stock Exchange (QSE)
Investor Trading Percentage to Total Value Traded Net Traded Value by Nationality (QR Million)
Source: Qatar Stock Exchange (QSE) Source: Qatar Stock Exchange (QSE)
17.8%
15.1%
7.0%
4.7%
4.0%
0.0%
7.0%
14.0%
21.0%
Ezdan Real
Estate
Qatar
Insurance
Zad Holding Aamal Qatar Cinema
& Film
Distribution
-6.0%
-5.0%
-4.4%
-4.1%
-3.8%
-9.0%
-6.0%
-3.0%
0.0%
Gulf Warehousing Qatar National
Cement
Industries Qatar Qatar German
Co. for Medical
Devices
MasrafAl Rayan
510.1
303.7 293.2
231.7
149.7
0.0
180.0
360.0
540.0
Ezdan Real
Estate
Barwa Real
Estate
Masraf Al
Rayan
Qatar
Insurance
QNB Group
27.5
6.2 5.9
4.3 3.8
0.0
10.0
20.0
30.0
Ezdan Real
Estate
Masraf Al Rayan Barwa Real
Estate
Vodafone Qatar Qatar & Oman
Investment
0%
20%
40%
60%
80%
100%
Buy Sell
40.69%
48.06%
11.98%
17.04%13.57%
14.55%
33.77%
20.36%
Qatari Individuals Qatari Institutions
Non-Qatari Individuals Non-Qatari Institutions
1,434
1,289
1,772
950
(338)
338
(500) - 500 1,000 1,500 2,000
Qatari
Non-Qatari
Net Investment Total Sold Total Bought
4. Page 4 of 6
TECHNICAL ANALYSIS OF THE QSE INDEX
Source: Bloomberg
The QSE Index gained 1.9% from last week’s closing. The Index met our expectations; it gained more ground and thus the positive pattern might continue.
The Index could be heading to the next important resistance level, which is positioned just below the 12,800 level. That resistance line could be stronger
than the usual because the 55SMA (Simple Moving Average) is verging near the downtrend resistance line. In addition, we see multiple previous tops and
bottoms were created around the mentioned level. As a result, we update the immediate resistance level to around 12,800 and the support level is located
above 12,000.
DEFINITIONS OF KEY TERMS USED IN TECHNICAL ANALYSIS
RSI (Relative Strength Index) indicator – RSI is a momentum oscillator that measures the speed and change of price movements. The RSI oscillates
between 0 to 100. The index is deemed to be overbought once the RSI approaches the 70 level, indicating that a correction is likely. On the other hand, if
the RSI approaches 30, it is an indication that the index may be getting oversold and therefore likely to bounce back.
MACD (Moving Average Convergence Divergence) indicator – The indicator consists of the MACD line and a signal line. The divergence or the
convergence of the MACD line with the signal line indicates the strength in the momentum during the uptrend or downtrend, as the case may be. When the
MACD crosses the signal line from below and trades above it, it gives a positive indication. The reverse is the situation for a bearish trend.
Candlestick chart – A candlestick chart is a price chart that displays the high, low, open, and close for a security. The ‘body’ of the chart is portion between
the open and close price, while the high and low intraday movements form the ‘shadow’. The candlestick may represent any time frame. We use a one-day
candlestick chart (every candlestick represents one trading day) in our analysis.
Doji candlestick pattern – A Doji candlestick is formed when a security's open and close are practically equal. The pattern indicates indecisiveness, and
based on preceding price actions and future confirmation, may indicate a bullish or bearish trend reversal.
Shooting Star/Inverted Hammer candlestick patterns – These candlestick patterns have a small real body (open price and close price are near to each
other), and a long upper shadow (large intraday movement on the upside). The Shooting Star is a bearish reversal pattern that forms after a rally. The
Inverted Hammer looks exactly like a Shooting Star, but forms after a downtrend. Inverted Hammers represent a potential bullish trend reversal.
5. Page 5 of 6
Source: Bloomberg
Company Name
Price
(May 14)
% Change 5-
Day
% Change
YTD
Market Cap.
QR Million TTM P/E P/B Div. Yield
Qatar National Bank 199.00 0.00 (6.53) 139,246 13.0 2.6 3.8
Qatar Islamic Bank 105.70 1.34 3.42 24,976 15.1 2.4 4.0
Commercial Bank of Qatar 56.90 0.89 (8.63) 18,585 10.3 1.1 5.6
Doha Bank 55.40 1.09 (2.81) 14,314 10.4 1.3 7.2
Al Ahli Bank 48.00 2.13 (3.30) 8,722 14.1 2.1 2.8
Qatar International Islamic Bank 80.80 0.87 (1.10) 12,231 14.7 2.5 5.0
Masraf Al Rayan 46.85 (3.80) 6.00 35,138 16.9 3.3 3.7
Al Khaliji Bank 21.05 3.59 (4.54) 7,578 12.6 1.4 4.8
National Leasing 20.85 0.77 4.25 1,032 37.6 0.8 4.1
Dlala Holding 27.65 (1.43) (17.31) 786 13.9 2.7 N/A
Qatar & Oman Investment 16.40 1.67 6.49 517 16.8 1.5 4.9
Islamic Holding Group 127.00 (1.55) 2.01 508 30.7 8.5 2.4
Banking and Financial Services 263,632
Zad Holding 102.90 6.96 22.50 1,346 12.2 1.7 3.9
Qatar German Co. for Medical Devices 17.10 (4.09) 68.47 198 N/A 1.2 N/A
Salam International Investment 14.30 0.00 (9.78) 1,635 20.4 1.0 4.2
Medicare Group 174.00 (0.80) 48.72 4,897 24.9 5.9 1.0
Qatar Cinema & Film Distribution 44.00 4.02 10.00 276 22.2 1.9 2.1
Qatar Fuel 182.00 0.94 (10.92) 15,372 13.5 2.5 4.9
Qatar Meat and Livestock 62.00 0.00 2.65 1,116 20.7 4.1 4.0
Al Meera Consumer Goods 251.60 0.64 25.80 5,032 21.8 4.0 3.6
Consumer Goods and Services 29,871
Qatar Industrial Manufacturing 46.00 (1.71) 6.11 2,186 14.2 1.4 6.5
Qatar National Cement 122.60 (4.96) 2.17 6,622 15.9 2.6 3.0
Industries Qatar 142.50 (4.36) (15.18) 86,213 15.1 2.8 4.9
Qatari Investors Group 51.90 3.18 25.36 6,453 27.9 2.9 1.4
Qatar Electricity and Water 216.00 1.50 15.20 23,760 14.6 3.8 3.5
Mannai Corp. 115.00 0.61 5.50 5,246 9.7 2.6 5.2
Aamal 17.10 4.72 18.20 10,773 18.2 1.5 5.6
Gulf International Services 83.50 (2.45) (14.01) 15,518 9.8 4.4 6.6
Mesaieed Petrochemical Holding 26.10 (0.19) -11.5 32,790 22.7 2.5 4.2
Industrials 189,559
Qatar Insurance 99.00 15.12 25.66 18,278 18.6 3.2 2.2
Doha Insurance 25.65 2.60 (11.55) 1,283 11.9 1.2 3.9
Qatar General Insurance & Reinsurance 56.30 (3.76) 9.74 4,479 4.9 0.8 3.1
Al Khaleej Takaful Insurance 43.85 (1.13) (0.73) 1,119 15.0 1.8 3.0
Qatar Islamic Insurance 86.00 1.18 8.86 1,290 15.4 4.1 4.7
Insurance 26,448
United Development 23.65 (2.67) 0.25 8,374 15.6 0.8 5.3
Barw a Real Estate 51.00 0.79 21.72 19,845 3.4 1.1 4.3
Ezdan Real Estate 19.80 17.79 32.71 52,519 36.9 1.8 2.0
Mazaya Qatar Real Estate Development 18.91 (0.68) 3.68 1,986 11.5 1.5 1.5
Real Estate 82,724
Qatar Telecom 98.00 (2.49) (20.90) 31,391 18.0 1.5 4.1
Vodafone Qatar 17.63 1.09 7.17 14,904 N/A 2.7 1.0
Telecoms 46,296
Qatar Navigation (Milaha) 99.60 0.00 0.10 11,407 10.7 0.9 5.5
Gulf Warehousing 72.20 (5.99) 28.01 3,434 22.6 3.9 2.1
Qatar Gas Transport (Nakilat) 22.72 0.04 (1.65) 12,723 13.9 4.3 5.3
Transportation 27,564
Qatar Exchange 666,095
6. Contacts
Saugata Sarkar Sahbi Kasraoui QNB Financial Services SPC
Head of Research Head of HNI Contact Center: (+974) 4476 6666
Tel: (+974) 4476 6534 Tel: (+974) 4476 6544 PO Box 24025
saugata.sarkar@qnbfs.com.qa sahbi.alkasraoui@qnbfs.com.qa Doha, Qatar
Disclaimer and Copyright Notice: This publication has been prepared by QNB Financial Services SPC (“QNBFS”) a wholly-owned subsidiary of QNB SAQ (“QNB”). QNBFS is regulated by the
Qatar Financial Markets Authority and the Qatar Exchange QNB SAQ is regulated by the Qatar Central Bank. This publication expresses the views and opinions of QNBFS at a given time only. It is
not an offer, promotion or recommendation to buy or sell securities or other investments, nor is it intended to constitute legal, tax, accounting, or financial advice. QNBFS accepts no liability
whatsoever for any direct or indirect losses arising from use of this report. Any investment decision should depend on the individual circumstances of the investor and be based on specifically
engaged investment advice. We therefore strongly advise potential investors to seek independent professional advice before making any investment decision. Although the information in this report
has been obtained from sources that QNBFS believes to be reliable, we have not independently verified such information and it may not be accurate or complete. QNBFS does not make any
representations or warranties as to the accuracy and completeness of the information it may contain, and declines any liability in that respect. For reports dealing with Technical Analysis,
expressed opinions and/or recommendations may be different or contrary to the opinions/recommendations of QNBFS Fundamental Research as a result of depending solely on the historical
technical data (price and volume). QNBFS reserves the right to amend the views and opinions expressed in this publication at any time. It may also express viewpoints or make investment
decisions that differ significantly from, or even contradict, the views and opinions included in this report. This report may not be reproduced in whole or in part without permission from QNBFS
COPYRIGHT: No part of this document may be reproduced without the explicit written permission of QNBFS.
Page 6 of 6