Independent Call Girl Number in Kurla Mumbai📲 Pooja Nehwal 9892124323 💞 Full ...
Weekly market report
1. `
Page 1 of 6
Market Review and Outlook QSE Index and Volume
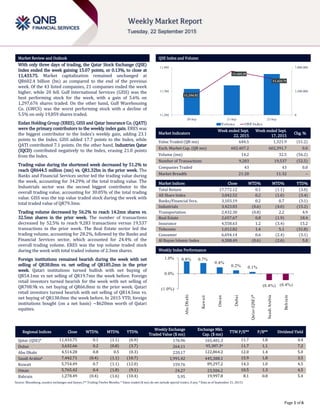
With only three days of trading, the Qatar Stock Exchange (QSE)
Index ended the week gaining 15.07 points, or 0.13%, to close at
11,433.75. Market capitalization remained unchanged at
QR602.4 billion (bn) as compared to the end of the previous
week. Of the 43 listed companies, 21 companies ended the week
higher, while 20 fell. Gulf International Services (GISS) was the
best performing stock for the week, with a gain of 5.6% on
1,297,676 shares traded. On the other hand, Gulf Warehousing
Co. (GWCS) was the worst performing stock with a decline of
5.5% on only 19,859 shares traded.
Ezdan Holding Group (ERES), GISS and Qatar Insurance Co. (QATI)
were the primary contributors to the weekly index gain. ERES was
the biggest contributor to the Index’s weekly gain, adding 23.1
points to the Index. GISS added 17.7 points to the Index, while
QATI contributed 7.1 points. On the other hand, Industries Qatar
(IQCD) contributed negatively to the Index, erasing 21.0 points
from the Index.
Trading value during the shortened week decreased by 51.2% to
reach QR644.5 million (mn) vs. QR1.32bn in the prior week. The
Banks and Financial Services sector led the trading value during
the week, accounting for 34.29% of the total trading value. The
Industrials sector was the second biggest contributor to the
overall trading value, accounting for 30.05% of the total trading
value. GISS was the top value traded stock during the week with
total traded value of QR79.3mn.
Trading volume decreased by 56.2% to reach 14.2mn shares vs.
32.5mn shares in the prior week. The number of transactions
decreased by 52.5% to reach 9,283 transactions versus 19,537
transactions in the prior week. The Real Estate sector led the
trading volume, accounting for 28.2%, followed by the Banks and
Financial Services sector, which accounted for 24.4% of the
overall trading volume. ERES was the top volume traded stock
during the week with total traded volume of 2.3mn shares.
Foreign institutions remained bearish during the week with net
selling of QR38.8mn vs. net selling of QR185.2mn in the prior
week. Qatari institutions turned bullish with net buying of
QR54.1mn vs net selling of QR19.7mn the week before. Foreign
retail investors turned bearish for the week with net selling of
QR708.9k vs. net buying of QR66.8mn in the prior week. Qatari
retail investors turned bearish with net selling of QR14.5mn vs.
net buying of QR138.0mn the week before. In 2015 YTD, foreign
institutions bought (on a net basis) ~$620mn worth of Qatari
equities.
Market Indicators
Week ended Sept.
22, 2015
Week ended Sept.
17, 2015
Chg. %
Value Traded (QR mn) 644.5 1,321.9 (51.2)
Exch. Market Cap. (QR mn) 602,407.2 602,391.7 0.0
Volume (mn) 14.2 32.5 (56.2)
Number of Transactions 9,283 19,537 (52.5)
Companies Traded 43 43 0.0
Market Breadth 21:20 11:32 –
Market Indices Close WTD% MTD% YTD%
Total Return 17,772.12 0.1 (1.1) (3.0)
All Share Index 3,042.52 0.2 (1.0) (3.4)
Banks/Financial Svcs. 3,103.19 0.2 0.7 (3.1)
Industrials 3,423.83 (0.6) (4.0) (15.2)
Transportation 2,432.30 (0.8) 2.2 4.9
Real Estate 2,657.67 0.8 (1.9) 18.4
Insurance 4,558.63 1.2 (3.4) 15.2
Telecoms 1,012.82 1.4 5.1 (31.8)
Consumer 6,694.14 0.6 (2.4) (3.1)
Al Rayan Islamic Index 4,308.49 (0.6) (2.6) 5.0
Market Indices
Weekly Index Performance
Regional Indices Close WTD% MTD% YTD%
Weekly Exchange
Traded Value ($ mn)
Exchange Mkt.
Cap. ($ mn)
TTM P/E** P/B** Dividend Yield
Qatar (QSE)* 11,433.75 0.1 (1.1) (6.9) 176.96 165,481.3 11.7 1.8 4.4
Dubai 3,632.66 0.2 (0.8) (3.7) 264.11 95,387.3# 11.7 1.1 7.2
Abu Dhabi 4,514.28 0.8 0.5 (0.3) 220.17 122,864.2 12.0 1.4 5.0
Saudi Arabia# 7,442.71 (0.4) (1.1) (10.7) 1,991.42 445,388.1 15.9 1.8 3.5
Kuwait 5,754.49 0.7 (1.1) (12.0) 159.76 89,297.2 14.3 1.0 4.5
Oman 5,765.42 0.4 (1.8) (9.1) 24.27 23,506.2 10.5 1.3 4.5
Bahrain 1,278.49 (0.4) (1.6) (10.4) 5.95 19,997.8 8.1 0.8 5.4
Source: Bloomberg, country exchanges and Zawya (** Trailing Twelve Months; * Value traded ($ mn) do not include special trades, if any; # Data as of September 21, 2015)
11,354.52
11,465.35
11,433.75
0
3,500,000
7,000,000
11,280
11,380
11,480
20-Sep 21-Sep 22-Sep
Volume QSEIndex
0.8% 0.7%
0.4%
0.2% 0.1%
(0.4%) (0.4%)
(1.0%)
0.0%
1.0%
AbuDhabi
Kuwait
Oman
Dubai
Qatar(QSE)*
SaudiArabia
Bahrain
2. Page 2 of 6
News
Economic News
Qatar to spend $220bn on major projects – Qatar is prioritizing
existing development projects in view of falling oil prices and
plans to award large-scale investment projects worth $220bn
over the next 10 years. Global credit rating agency Standard and
Poor's (S&P) said the investment program will focus on
infrastructure, education and health. S&P said it expects the
majority of the projects to be completed ahead of the 2022 FIFA
World Cup slated to be held in Qatar. The program will support
medium-term real economic growth, although it will contribute to
deterioration in fiscal and external balances, exacerbated by a
large fall in oil prices. Meanwhile, S&P affirmed its 'AA' long-term
and 'A-1+' short-term foreign and local currency sovereign credit
ratings on Qatar with a stable outlook. They also affirmed 'AA'
long-term issue ratings on the bonds issued by Qatari Diar
Finance and SoQ Sukuk A. (Zawya)
Qatar, France look to strengthen bilateral economic relations –
Qatar and France have explored options on mutual cooperation in
the areas of capital market in a bid to strengthen the bilateral
economic relations between the two countries. These were
discussed by the visiting delegation from France with the Qatar
Stock Exchange (QSE) officials at their recent meeting. French
Ambassador Eric Chevallier and Agathe Demarais, Economic
Adviser on Middle East Affairs at the French Ministry of Economy
& Finance; and the head of the Economic Department of the
French Embassy were part of the French delegation. (Gulf-
Times.com, QSE)
Qatar ranked fifth in Global Innovation Index – Qatar has been
ranked fifth in Northern Africa and Western Asia region in the
Global Innovation Index (GII) by leading business schools and
World Intellectual Property Organization. Meanwhile, Qatar has
been ranked third in the GCC region. In the category of Northern
Africa and Western Asia region, which has 19 countries, Cyprus is
second, Saudi Arabia third and the UAE fourth. In the overall
ranking of 141 countries around the world, Qatar has secured
50th rank. (Peninsula Qatar)
MEC awards QR1.3bn poultry firm contract – The Ministry of
Economy & Commerce (MEC) has awarded the first contract to a
private company to set up a QR1.3bn poultry company in Qatar as
part of its food security scheme. The project was awarded to Dar
Al Rayyan for Investment by the technical committee ‘for
encouraging private sector to participate in food security
projects’. The project aims to promote self-sufficiency in poultry
products by producing 40,000 tons of chicken and 7,500 tons of
eggs annually. This will be enough to meet 38% of the local
chicken demand. Currently, locally produced chicken meets only
7.7% of the demand and when the new company becomes
operational this will go up to 46%. As for eggs, the new company
will raise the share of the local produce to 42%, by adding 26.3%
to the existing 15.7%. The committee also conducted a study to
launch a similar project for dairy products involving the private
sector. It aims to reduce dependence on imported milk by
producing 20,000 tons of milk annually. (Peninsula Qatar)
QCB: NPL ratio of Qatari banks declined considerably in 2014; SIPS
transactions top QR3,211bn – According to the Qatar Central
Bank’s (QCB) latest financial stability report, the non-performing
loan (NPLs) ratio of local banks declined considerably in 2014,
indicating moderation of credit risk during the year. The growth
in NPLs during 2014 was merely 2.2% as compared to 25.8% in
2013. Intra-year variations indicate better asset quality
management in 2H2014. As in the previous two years, the share
of NPLs in the private corporate sector continued to moderate.
The share of NPLs outside Qatar after increasing for three years
was stable during 2014. The share of NPLs in the personal loans
category has been rising rapidly and the banks need to monitor
these loans more carefully to rein in the loans in this category. As
in the previous Financial Stability Reviews, stress-testing of credit
risk was done through potential deterioration in major segments
of private sector credit, viz. real estate, consumption and
contractors. The combined NPLs of these sectors were
progressively raised to find the breakeven point. The breakeven
capital adequacy ratio (CAR) has been raised to 12.5% as per the
capital requirements specified by the QCB under Basel III
guidelines for banks in Qatar. Meanwhile, the QCB said
transactions valued at QR3,211bn were processed through the
Systemically Important Payment Systems (SIPS) in Qatar during
2014, which indicates the growing popularity of electronic cash
settlement in the country. The QCB added the total value of all
transactions processed through SIPS accounted for 416% of the
country’s 2014 GDP. The total value of all transactions processed
through SIPS was 448% of 2013 GDP. (Gulf-Times.com)
Market & Corporate News
QNBK to disclose financial statements on October 7 – QNB Group
(QNBK) will announce its financial reports for the period ending
September 30, 2015 on October 7, 2015. (QSE)
KCBK to announce financials on October 20 – Al Khalij Commercial
Bank (KCBK) will announce its financial reports for the period
ending September 30, 2015 on October 20, 2015. (QSE)
IB-UK offers solutions for London investments – Qatar Islamic
Bank’s (QIBK) wholly-owned subsidiary, QIB-UK is offering
comprehensive and straight forward finance solutions for its
private customers interested in investing in the London real
estate market. As Eid Al Adha approaches, London remains a top
international destination for Qatari nationals travelling during the
break. With real estate in the thriving capital demonstrating solid
returns, it is a good time to consider a property investment. QIB-
UK, headquartered in London’s prestigious Mayfair district, is
situated to support interested customers throughout the process
of identifying real estate opportunities, accessing exclusive deals,
obtaining the required financing and efficiently concluding
transactions. (Peninsula Qatar)
ORDS outlines vision of ‘smart fleet’ future – Ooredoo (ORDS) has
outlined its vision for the “smart fleet” future of Qatar, which will
see transport companies use a range of innovative machine-to-
machine (M2M) solutions. ORDS’s Smart Fleet Management
Solution is an innovative cloud-based service that deploys GPS
and GSM technology to centralize and manage all transport-
related information, so that companies can plan fleet activities,
reduce operational costs and optimize resources. Meanwhile,
ORDS has pledged its commitment to the United Nations (UN)
Sustainable Development Goals (Global Goals), which aim to
eradicate extreme poverty, improve the lives of people and create
an all-round healthier world for tomorrow (Peninsula Qatar, Gulf-
Times.com)
3. Page 3 of 6
Qatar Stock Exchange
Top Gainers Top Decliners
Source: Qatar Stock Exchange (QSE) Source: Qatar Stock Exchange (QSE)
Most Active Shares by Value (QR Million) Most Active Shares by Volume (Million)
Source: Qatar Stock Exchange (QSE) Source: Qatar Stock Exchange (QSE)
Investor Trading Percentage to Total Value Traded Net Traded Value by Nationality (QR Million)
Source: Qatar Stock Exchange (QSE) Source: Qatar Stock Exchange (QSE)
5.6%
4.4%
3.1%
1.9% 1.8%
0.0%
2.0%
4.0%
6.0%
Gulf
International
Services
Doha
Insurance
Al Ahli Bank Ooredoo Qatar Islamic
Insurance
-5.5%
-5.2%
-3.5%
-2.7%
-2.5%
-6.0%
-4.0%
-2.0%
0.0%
Gulf Warehousing Qatar Cinema &
Film Distribution
Islamic Holding
Group
Aamal Mazaya Qatar
79.3
75.9
60.5 60.3
52.5
0.0
30.0
60.0
90.0
Gulf
International
Services
QNB Group Masraf Al
Rayan
Industries
Qatar
Ooredoo
2.3
1.8
1.4
1.3
0.7
0.0
1.0
2.0
3.0
Ezdan Real
Estate
Vodafone
Qatar
Masraf Al
Rayan
Gulf
International
Services
Ooredoo
0%
20%
40%
60%
80%
100%
Buy Sell
28.83% 31.08%
22.14% 13.75%
13.47%
13.58%
35.56% 41.59%
Qatari Individuals Qatari Institutions
Non-Qatari Individuals Non-Qatari Institutions
328
316
289
356
40
(40)
(100) - 100 200 300 400
Qatari
Non-Qatari
Net Investment Total Sold Total Bought
4. Page 4 of 6
TECHNICAL ANALYSIS OF THE QSE INDEX
Source: Bloomberg
Prior to Eid al-Adha holiday, volumes dropped significantly and with only three days of trading, the QSE Index inched up by only 0.13% vs the week before. Hence,
technical indicators did not move appreciably and our weekly expected support and resistance levels stay at 11,000 points and 12,000 points, respectively.
DEFINITIONS OF KEY TERMS USED IN TECHNICAL ANALYSIS
RSI (Relative Strength Index) indicator – RSI is a momentum oscillator that measures the speed and change of price movements. The RSI oscillates between 0 to
100. The index is deemed to be overbought once the RSI approaches the 70 level, indicating that a correction is likely. On the other hand, if the RSI approaches
30, it is an indication that the index may be getting oversold and therefore likely to bounce back.
MACD (Moving Average Convergence Divergence) indicator – The indicator consists of the MACD line and a signal line. The divergence or the convergence of the
MACD line with the signal line indicates the strength in the momentum during the uptrend or downtrend, as the case may be. When the MACD crosses the signal
line from below and trades above it, it gives a positive indication. The reverse is the situation for a bearish trend.
Candlestick chart – A candlestick chart is a price chart that displays the high, low, open, and close for a security. The ‘body’ of the chart is portion between the
open and close price, while the high and low intraday movements form the ‘shadow’. The candlestick may represent any time frame. We use a one-day
candlestick chart (every candlestick represents one trading day) in our analysis.
Doji candlestick pattern – A Doji candlestick is formed when a security's open and close are practically equal. The pattern indicates indecisiveness, and based on
preceding price actions and future confirmation, may indicate a bullish or bearish trend reversal.
Shooting Star/Inverted Hammer candlestick patterns – These candlestick patterns have a small real body (open price and close price are near to each other),
and a long upper shadow (large intraday movement on the upside). The Shooting Star is a bearish reversal pattern that forms after a rally. The Inverted Hammer
looks exactly like a Shooting Star, but forms after a downtrend. Inverted Hammers represent a potential bullish trend reversal.
5. Page 5 of 6
Source: Bloomberg
Company Name
Price
(Sept 22)
% Change
WTD
% Change
YTD
Market Cap.
QR Million TTM P/E P/B Div. Yield
Qatar National Bank 185.00 (0.27) (13.10) 129,450 11.8 2.3 4.1
Qatar Islamic Bank 115.90 0.78 13.41 27,386 15.7 1.9 3.7
Commercial Bank of Qatar 56.00 0.36 (10.07) 18,291 9.7 1.1 5.7
Doha Bank 50.50 1.41 (11.40) 13,048 9.5 1.0 7.9
Al Ahli Bank 49.50 3.13 (0.27) 8,995 14.1 2.1 2.8
Qatar International Islamic Bank 74.80 (0.27) (8.45) 11,322 13.2 2.2 5.3
Masraf Al Rayan 42.50 (0.47) (3.85) 31,875 15.2 3.2 4.1
Al Khaliji Bank 21.30 1.38 (3.40) 7,668 12.6 1.3 4.7
National Leasing 18.07 1.75 (9.65) 894 N/A 0.8 4.7
Dlala Holding 19.93 0.15 (40.40) 566 N/A 2.0 N/A
Qatar & Oman Investment 13.65 (0.73) (11.36) 430 6.7 1.2 5.9
Islamic Holding Group 112.10 (3.45) (9.96) 448 30.8 7.2 2.7
Banking and Financial Services 250,375
Zad Holding 91.10 (0.98) 8.45 1,192 10.3 1.5 4.4
Qatar German Co. for Medical Devices 13.16 (1.20) 29.66 152 N/A 1.0 N/A
Salam International Investment 12.32 0.41 (22.27) 1,408 18.1 0.9 4.9
Medicare Group 165.50 0.30 41.45 4,658 23.7 5.3 1.1
Qatar Cinema & Film Distribution 38.00 (5.24) (5.00) 239 18.4 1.7 2.4
Qatar Fuel 154.50 1.64 (24.38) 13,049 11.4 2.0 5.8
Widam Food Co. 52.40 (0.76) (13.25) 943 15.4 4.0 4.8
Al Meera Consumer Goods 249.70 (0.76) 24.85 4,994 23.3 3.8 3.6
Consumer Goods and Services 26,635
Qatar Industrial Manufacturing 42.55 0.35 (1.85) 2,022 12.2 1.4 7.1
Qatar National Cement 104.50 1.46 (12.92) 5,644 13.3 2.1 3.5
Industries Qatar 123.60 (1.75) (26.43) 74,778 12.6 2.3 5.7
Qatari Investors Group 44.00 (1.12) 6.28 5,470 23.4 2.4 1.7
Qatar Electricity and Water 212.00 (1.35) 13.07 23,320 14.6 3.5 3.5
Mannai Corp. 98.40 0.51 (9.72) 4,489 9.2 2.1 6.1
Aamal 13.31 (2.70) (8.00) 8,385 13.2 1.2 7.2
Gulf International Services 62.50 5.57 (35.63) 11,615 7.5 3.1 8.8
Mesaieed Petrochemical Holding 20.66 (1.57) -30.0 25,956 20.1 1.9 5.3
Industrials 161,679
Qatar Insurance 94.00 1.29 19.32 17,354 18.4 3.0 2.3
Doha Insurance 24.00 4.35 (17.24) 1,200 13.5 1.1 4.2
Qatar General Insurance & Reinsurance 55.50 0.00 8.18 4,415 4.7 0.8 3.1
Al Khaleej Takaful Insurance 35.00 0.00 (20.77) 893 16.5 1.4 3.7
Qatar Islamic Insurance 74.30 1.78 (5.95) 1,115 14.9 3.6 5.4
Insurance 24,978
United Development 23.10 (0.86) (2.08) 8,179 12.0 0.8 5.4
Barw a Real Estate 42.95 (0.23) 2.51 16,713 2.7 0.9 5.1
Ezdan Real Estate 18.65 1.63 25.00 49,469 33.9 1.7 2.1
Mazaya Qatar Real Estate Development 15.60 (2.50) (14.46) 1,638 9.5 1.2 1.8
Real Estate 75,999
Ooredoo 76.00 1.88 (38.66) 24,344 17.0 1.1 5.3
Vodafone Qatar 13.50 0.15 (17.93) 11,413 N/A 2.2 1.6
Telecoms 35,757
Qatar Navigation (Milaha) 99.00 1.02 (0.50) 11,338 9.5 0.8 5.6
Gulf Warehousing 67.00 (5.50) 18.79 3,187 19.9 3.6 2.2
Qatar Gas Transport (Nakilat) 22.25 (1.11) (3.68) 12,460 13.1 3.1 5.4
Transportation 26,985
Qatar Exchange 602,407
6. Contacts
Saugata Sarkar Sahbi Kasraoui QNB Financial Services SPC
Head of Research Head of HNI Contact Center: (+974) 4476 6666
Tel: (+974) 4476 6534 Tel: (+974) 4476 6544 PO Box 24025
saugata.sarkar@qnbfs.com.qa sahbi.alkasraoui@qnbfs.com.qa Doha, Qatar
Disclaimer and Copyright Notice: This publication has been prepared by QNB Financial Services SPC (“QNBFS”) a wholly-owned subsidiary of QNB SAQ (“QNB”). QNBFS is regulated by the Qatar
Financial Markets Authority and the Qatar Exchange QNB SAQ is regulated by the Qatar Central Bank. This publication expresses the views and opinions of QNBFS at a given time only. It is not an offer,
promotion or recommendation to buy or sell securities or other investments, nor is it intended to constitute legal, tax, accounting, or financial advice. QNBFS accepts no liability whatsoever for any
direct or indirect losses arising from use of this report. Any investment decision should depend on the individual circumstances of the investor and be based on specifically engaged investment advice.
We therefore strongly advise potential investors to seek independent professional advice before making any investment decision. Although the information in this report has been obtained from
sources that QNBFS believes to be reliable, we have not independently verified such information and it may not be accurate or complete. QNBFS does not make any representations or warranties as to
the accuracy and completeness of the information it may contain, and declines any liability in that respect. For reports dealing with Technical Analysis, expressed opinions and/or recommendations
may be different or contrary to the opinions/recommendations of QNBFS Fundamental Research as a result of depending solely on the historical technical data (price and volume). QNBFS reserves the
right to amend the views and opinions expressed in this publication at any time. It may also express viewpoints or make investment decisions that differ significantly from, or even contradict, the views
and opinions included in this report. This report may not be reproduced in whole or in part without permission from QNBFS
COPYRIGHT: No part of this document may be reproduced without the explicit written permission of QNBFS.
Page 6 of 6