QSE Index Falls 1.86% as Trading Value Surges 234
•
0 likes•82 views

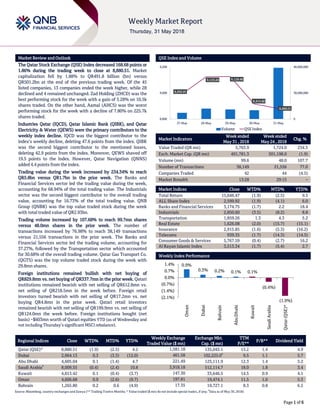
The Qatar Stock Exchange (QSE) Index decreased 168.68 points or 1.86% during the trading week to close at 8,880.51

Recommended
More Related Content
What's hot
What's hot (20)
Similar to QSE Index Falls 1.86% as Trading Value Surges 234
Similar to QSE Index Falls 1.86% as Trading Value Surges 234 (20)
More from QNB Group
More from QNB Group (20)
Recently uploaded
Recently uploaded (20)
QSE Index Falls 1.86% as Trading Value Surges 234
- 1. ` Page 1 of 6 Market Review and Outlook QSE Index and Volume The Qatar Stock Exchange (QSE) Index decreased 168.68 points or 1.86% during the trading week to close at 8,880.51. Market capitalization fell by 1.88% to QR491.8 billion (bn) versus QR501.2bn at the end of the previous trading week. Of the 45 listed companies, 13 companies ended the week higher, while 28 declined and 4 remained unchanged. Zad Holding (ZHCD) was the best performing stock for the week with a gain of 5.28% on 10.5k shares traded. On the other hand, Aamal (AHCS) was the worst performing stock for the week with a decline of 7.80% on 225.7k shares traded. Industries Qatar (IQCD), Qatar Islamic Bank (QIBK), and Qatar Electricity & Water (QEWS) were the primary contributors to the weekly index decline. IQCD was the biggest contributor to the index’s weekly decline, deleting 47.6 points from the index. QIBK was the second biggest contributor to the mentioned losses, deleting 42.9 points from the index. Moreover, QEWS shaved off 19.5 points to the index. However, Qatar Navigation (QNNS) added 4.4 points from the index. Trading value during the week increased by 234.34% to reach QR5.8bn versus QR1.7bn in the prior week. The Banks and Financial Services sector led the trading value during the week, accounting for 68.94% of the total trading value. The Industrials sector was the second biggest contributor to the overall trading value, accounting for 16.73% of the total trading value. QNB Group (QNBK) was the top value traded stock during the week with total traded value of QR2.93bn. Trading volume increased by 107.68% to reach 99.7mn shares versus 48.0mn shares in the prior week. The number of transactions increased by 76.98% to reach 38,149 transactions versus 21,556 transactions in the prior week. The Banks and Financial Services sector led the trading volume, accounting for 37.27%, followed by the Transportation sector which accounted for 30.68% of the overall trading volume. Qatar Gas Transport Co. (QGTS) was the top volume traded stock during the week with 29.8mn shares. Foreign institutions remained bullish with net buying of QR829.8mn vs. net buying of QR337.7mn in the prior week. Qatari institutions remained bearish with net selling of QR612.8mn vs. net selling of QR218.5mn in the week before. Foreign retail investors turned bearish with net selling of QR17.2mn vs. net buying QR4.8mn in the prior week. Qatari retail investors remained bearish with net selling of QR199.9mn vs. net selling of QR124.0mn the week before. Foreign institutions bought (net basis) ~$603mn worth of Qatari equities YTD (as of Wednesday and not including Thursday’s significant MSCI rebalance). Market Indicators Week ended May 31 , 2018 Week ended May 24 , 2018 Chg. % Value Traded (QR mn) 5,763.9 1,724.0 234.3 Exch. Market Cap. (QR mn) 491,781.3 501,198.0 (1.9) Volume (mn) 99.6 48.0 107.7 Number of Transactions 38,149 21,556 77.0 Companies Traded 42 44 (4.5) Market Breadth 13:28 29:15 – Market Indices Close WTD% MTD% YTD% Total Return 15,646.47 (1.9) (2.5) 9.5 ALL Share Index 2,599.92 (1.9) (4.1) 6.0 Banks and Financial Services 3,174.75 (1.7) 2.2 18.4 Industrials 2,850.60 (3.5) (8.2) 8.8 Transportation 1,859.26 1.3 4.3 5.2 Real Estate 1,626.08 (2.0) (15.7) (15.1) Insurance 2,915.85 (1.6) (5.3) (16.2) Telecoms 939.35 (1.7) (14.3) (14.5) Consumer Goods & Services 5,767.59 (0.4) (2.7) 16.2 Al Rayan Islamic Index 3,513.34 (1.7) (5.4) 2.7 Market Indices Weekly Index Performance Regional Indices Close WTD% MTD% YTD% Weekly Exchange Traded Value ($ mn) Exchange Mkt. Cap. ($ mn) TTM P/E** P/B** Dividend Yield Qatar (QSE)* 8,880.51 (1.9) (2.5) 4.2 1,581.18 135,043.1 13.2 1.4 4.9 Dubai 2,964.13 0.3 (3.3) (12.0) 461.58 102,225.0# 9.5 1.1 5.7 Abu Dhabi 4,605.04 0.1 (1.4) 4.7 221.49 125,111.9 12.3 1.4 5.2 Saudi Arabia# 8,009.55 (0.4) (2.4) 10.8 3,918.18 512,114.7 18.0 1.8 3.4 Kuwait 4,813.42 0.1 (0.4) (3.7) 147.30 33,646.5 14.5 0.9 4.1 Oman 4,606.68 0.9 (2.6) (9.7) 197.81 19,474.1 11.5 1.0 5.3 Bahrain 1,265.80 0.2 0.6 (4.9) 17.35 19,727.1 8.3 0.8 6.5 Source: Bloomberg, country exchanges and Zawya (** Trailing Twelve Months; * Value traded ($ mn) do not include special trades, if any; # Data as of May 30, 2018) 8,992.81 9,125.24 9,126.40 8,915.82 8,880.51 0 30,000,000 60,000,000 8,800 9,000 9,200 27-May 28-May 29-May 30-May 31-May Volume QSE Index 0.9% 0.3% 0.2% 0.1% 0.1% (0.4%) (1.9%) (2.1%) (1.4%) (0.7%) 0.0% 0.7% 1.4% Oman Dubai Bahrain AbuDhabi Kuwait SaudiArabia Qatar(QSE)*
- 2. Page 2 of 6 News Economic & Corporate News QInvest posts profit of QR1.7mn on revenues of QR73.1mn in 1Q2018 – QInvest, Qatar’s private investment group reported net profit of QR1.7mn on revenues of QR73.1mn in the first three months of this year. The region’s prominent Islamic financial institution’s global assets stood at QR4.51bn at the end of first quarter ended March 31, 2018. The group’s revenues and net profit fell in line with expectations, while costs have remained stable. The group maintained a strong liquidity position with a healthy capital adequacy ratio of 25.8% as of March 31, 2018. QInvest’s CEO, Tamim Hamad Al Kawari said, “While 1Q2018 saw headwinds in the region, the diversified nature of the group has allowed us to capitalize on more favorable global market conditions.” Its asset management business has had a strong start to the year and has sustained top quartile performance in both local and global markets. During the reporting period, the unit migrated the management of its US growth equity fund from Edgewood Management to Spyglass Capital Management, a spinoff from Edgewood. (Gulf-Times.com) Weekly real estate trading volume exceeds QR448mn – Qatar’s real estate trading volume crossed QR448mn in the period (May 20-24), data released by the Ministry of Justice’s Real Estate Registration Department showed. The department’s weekly report stated the trading included empty lands, towers, residential buildings, multipurpose lands and commercial buildings. Most of the trading took place in Doha, Al Daayen, Al Rayyan, Umm Salal, Al Khor, Al Thakhira, Al Wakrah and Al Shamal. Last week’s (May 13-17) trading volume stood around QR271.43mn. (Qatar Tribune) Qatar’s non-oil exports jump to reach QR2.2bn in April – Qatar recorded 68% MoM jump in non-oil exports to reach QR2.2bn in April 2018, and 71% increase YoY, according to Qatar Chamber. The Chamber’s Research and Studies Department and Member Affairs Department reported that a total of 3,068 certificates of origin were issued in April 2018, including 2,812 general form certificates, 99 unified GCC certificates (industrial), 129 unified Arab certificates of origin, and 28 certificates of origin for preference. Qatar Chamber’s Director General, Saleh Bin Hamad Al Sharqi said the 71% YoY increase in non-oil exports indicates development in the sector, which has been growing at an accelerated pace since the beginning of 2018 due to the efforts and facilities provided to the industrial sector. Al Sharqi noted that the volume of exports in April is a real indicator that confirms the efforts of the state in the development of the industry sector and increasing the capacity and efficiency of its productive institutions despite the surrounding circumstances. (Gulf-Times.com) Qatar’s inflation 0.6% up YoY in the first quarter – Higher expenses towards transportation, health, food and clothing pushed up Qatar’s cost of living, based on consumer price index, by 0.6% YoY in the first quarter of this year. The CPI inflation was up 0.2% compared to 4Q2017, owing to costlier transportation, health, restaurants and clothing, according to the Ministry of Development Planning and Statistics. Transport index, which has 14.59% weightage in the CPI basket, increased 8% and 3.5% YoY and QoQ respectively in 1Q2018. The operation of personal transport became costlier by more than 14% and transport services by 9% YoY. Health index, which carries 1.79% weightage in the CPI basket, expanded 5.3% and 2.2% YoY and QoQ in 1Q2018. The hospital and outpatient services increased 9% and 5% respectively on a yearly basis. (Gulf-Times.com) QIMD acquires foreign partner’s stake in QPPC – Qatar Industrial Manufacturing Company (QIMD) acquired the foreign partner’s stake in Qatar Plastic Products Company (QPPC). With the acquisition of shares in the company, QIMD will now be a majority stakeholder in QPPC. QIMD’s Chairman, Sheikh Abdul Rahman Bin Mohammed Bin Jabor Al Thani signed the contract for the purchase of the foreign partner’s 33.33% share in QPPC of the company’s capital, thus increasing its share capital to 66.66%. QIMD’s CEO, Abdul Rahman Al Ansari said, “We are confident that this acquisition will strengthen our investment portfolio in the industry and that this transaction will have a positive impact on our profits.” (Peninsula Qatar) Move to allow 100% FDI in all sectors seen enhancing Qatar’s global profile – Qatar’s moves to allow 100% foreign capital in all sectors is positive, especially in the banking sector, and is expected to further enhance the country’s position in the global foreign direct investment (FDI) landscape. It rather reflects upon Qatar’s confidence in the international investments amidst the continuing economic blockade. During 3Q2017, Qatar’s total inward foreign investments amounted to QR665bn, of which FDI was QR135.1bn, portfolio investment of QR95.8bn, other investments of QR429.5bn and derivatives of QR4.6bn, according to the Ministry of Development Planning and Statistics. About 90% of inward FDI went into the oil and gas and associated downstream manufacturing and other activities such as transportation and marketing. In terms of the book value of investments, manufacturing activities accounted for 56% of the total value of FDI, followed by mining and quarrying (32%) and financial and insurance activities (6%) at the end of 2016. (Gulf-Times.com) FTSE Global Index semi-annual review increases weights on select Qatari names – FTSE announced in its semi-annual review index weight changes on several companies trading on the QSE. QNB Group (QNBK) along with IQCD, QEWS, GISS, and QIBK will see a weight bump in the index. While most of the increases was in line with our/street expectations, we note that IQCD’s investability weight was increased to 49% (vs. 33% used by MSCI), which should drive higher fund flows into the name than we expected. Changes impacting Qatari names will be effective as of market close on Thursday June 14. (QNBFS Research, QNBFS Sales, FTSE Russell)
- 3. Page 3 of 6 Qatar Stock Exchange Top Gainers Top Decliners Source: Qatar Stock Exchange (QSE) Source: Qatar Stock Exchange (QSE) Most Active Shares by Value (QR Million) Most Active Shares by Volume (Million) Source: Qatar Stock Exchange (QSE) Source: Qatar Stock Exchange (QSE) Investor Trading Percentage to Total Value Traded Net Traded Value by Nationality (QR Million) Source: Qatar Stock Exchange (QSE) Source: Qatar Stock Exchange (QSE) 5.3% 5.0% 4.8% 2.7% 2.5% 0.0% 2.0% 4.0% 6.0% Zad Holding Al Khaleej Takaful Insurance Gulf Warehousing Qatar Industrial Manufacturing MannaiCorp. -7.8% -4.3% -4.2% -4.2% -4.1% -9.0% -6.0% -3.0% 0.0% Aamal QatarIslamicBank National Leasing Qatar& Oman Investment EzdanReal Estate 2,928.3 693.0 443.3 420.4 407.3 0.0 1,000.0 2,000.0 3,000.0 QNB Group Qatar Islamic Bank Qatar Gas Transport (Nakilat) Qatar Electricity and Water Industries Qatar 29.8 18.3 6.9 6.0 5.9 0.0 10.0 20.0 30.0 Qatar Gas Transport (Nakilat) QNB Group Vodafone Qatar Mesaieed Petrochemical Holding Company Qatar Islamic Bank 0% 20% 40% 60% 80% 100% Buy Sell 9.59% 13.06% 9.40% 20.03%2.55% 2.85% 78.46% 64.06% Qatari Individuals Qatari Institutions Non-Qatari Individuals Non-Qatari Institutions 1,095 4,669 1,907 3,856 (813) 813 (2,000) (1,000) - 1,000 2,000 3,000 4,000 5,000 Qatari Non-Qatari Net Investment Total Sold Total Bought
- 4. Page 4 of 6 TECHNICAL ANALYSIS OF THE QSE INDEX Source: Bloomberg The QE General Index closed slightly down (-1.86%) from the week before, and closed at 8,880.51 for Thursday’s close. Indicators remained flat and the Index is trapped between the 8,600 support and the 9,000 resistance levels. DEFINITIONS OF KEY TERMS USED IN TECHNICAL ANALYSIS RSI (Relative Strength Index) indicator – RSI is a momentum oscillator that measures the speed and change of price movements. The RSI oscillates between 0 to 100. The index is deemed to be overbought once the RSI approaches the 70 level, indicating that a correction is likely. On the other hand, if the RSI approaches 30, it is an indication that the index may be getting oversold and therefore likely to bounce back. MACD (Moving Average Convergence Divergence) indicator – The indicator consists of the MACD line and a signal line. The divergence or the convergence of the MACD line with the signal line indicates the strength in the momentum during the uptrend or downtrend, as the case may be. When the MACD crosses the signal line from below and trades above it, it gives a positive indication. The reverse is the situation for a bearish trend. Candlestick chart – A candlestick chart is a price chart that displays the high, low, open, and close for a security. The ‘body’ of the chart is portion between the open and close price, while the high and low intraday movements form the ‘shadow’. The candlestick may represent any time frame. We use a one-day candlestick chart (every candlestick represents one trading day) in our analysis. Doji candlestick pattern – A Doji candlestick is formed when a security's open and close are practically equal. The pattern indicates indecisiveness, and based on preceding price actions and future confirmation, may indicate a bullish or bearish trend reversal. Shooting Star/Inverted Hammer candlestick patterns – These candlestick patterns have a small real body (open price and close price are near to each other), and a long upper shadow (large intraday movement on the upside). The Shooting Star is a bearish reversal pattern that forms after a rally. The Inverted Hammer looks exactly like a Shooting Star, but forms after a downtrend. Inverted Hammers represent a potential bullish trend reversal.
- 5. Page 5 of 6 Source: Bloomberg Company Name Price May 31 % Change WTD % Change YTD Market Cap. QR Million TTM P/E P/B Div. Yield Qatar National Bank 158.62 (0.80) 25.88 146,508 11.6 2.4 3.8 Qatar Islamic Bank 114.79 (4.34) 18.34 27,124 12.2 2.0 4.4 Commercial Bank of Qatar 37.75 (1.97) 30.62 15,278 22.5 1.0 2.6 Doha Bank 26.05 (3.48) (8.60) 8,077 8.4 1.0 11.5 Al Ahli Bank 30.00 (0.03) (19.21) 6,311 9.7 1.3 3.2 Qatar International Islamic Bank 51.75 (2.36) (5.22) 7,833 9.2 1.3 7.7 Masraf Al Rayan 33.47 (1.21) (11.34) 25,103 12.2 2.1 6.0 Al Khalij Commercial Bank 11.00 0.09 (22.54) 3,960 7.9 0.8 6.8 Qatar First Bank 5.41 0.74 (17.15) 1,082 N/A 0.7 N/A National Leasing 9.12 (4.20) (14.85) 451 120.9 0.5 5.5 Dlala Holding 12.84 (0.23) (12.65) 365 39.1 1.6 N/A Qatar & Oman Investment 6.00 (4.15) (24.05) 189 36.5 0.7 8.3 Islamic Holding Group 27.60 (3.16) (26.40) 156 N/A 1.2 N/A Banking and Financial Services 242,438 Zad Holding 79.80 5.28 8.37 1,148 9.7 1.5 7.4 Qatar German Co. for Medical Devices 5.18 (3.18) (19.81) 60 N/A 1.2 N/A Salam International Investment 5.46 0.55 (20.75) 624 N/A 0.4 N/A Medicare Group 56.71 (0.68) (18.81) 1,596 19.3 1.8 3.2 Qatar Cinema & Film Distribution 22.00 0.00 (12.00) 138 18.1 1.0 4.5 Qatar Fuel 135.50 (1.73) 32.77 13,472 12.4 2.1 5.9 Widam Food Co. 60.00 (1.09) (4.00) 1,080 9.7 3.7 7.1 Mannai Corp. 46.09 2.49 (22.54) 2,103 4.1 0.8 8.7 Al Meera Consumer Goods 148.35 1.09 2.38 2,967 15.1 2.4 5.7 Consumer Goods and Services 23,188 Qatar Industrial Manufacturing 41.39 2.70 (5.29) 1,967 10.0 1.3 7.2 Qatar National Cement 55.98 1.78 (11.00) 3,658 11.0 1.3 8.0 Industries Qatar 102.51 (3.75) 5.68 62,019 17.0 1.9 4.9 Qatari Investors Group 30.00 (2.09) (18.03) 3,730 14.8 1.4 2.5 Qatar Electricity and Water 190.00 (3.55) 6.74 20,900 12.6 2.3 4.1 Aamal 9.22 (7.80) 6.22 5,809 11.6 0.7 6.5 Gulf International Services 16.88 (1.23) (4.63) 3,137 39.6 0.9 N/A Mesaieed Petrochemical Holding 15.88 (4.05) 26.13 19,950 16.3 1.4 4.4 Invesment Holding Group 5.41 (3.39) (11.31) 449 10.5 0.5 10.2 Industrials 121,619 Qatar Insurance 32.94 (2.54) (27.17) 10,505 38.7 1.1 4.0 Doha Insurance 13.00 0.00 (7.14) 650 15.2 0.6 5.8 Qatar General Insurance & Reinsurance 50.00 0.00 2.04 4,375 13.7 0.7 4.4 Al Khaleej Takaful Insurance 11.35 5.00 (14.27) 290 43.3 0.6 4.4 Qatar Islamic Insurance 49.25 (0.02) (10.41) 739 11.9 2.3 7.1 Insurance 16,559 United Development 14.50 1.83 0.83 5,134 9.8 0.5 8.6 Barw a Real Estate 34.29 0.15 7.16 13,343 8.2 0.7 7.3 Ezdan Real Estate 8.48 (4.07) (29.80) 22,493 25.9 0.7 N/A Mazaya Qatar Real Estate Development 6.35 (3.05) (29.44) 735 44.9 0.5 N/A Real Estate 41,706 Ooredoo 67.10 (0.28) (26.06) 21,493 11.5 0.9 5.2 Vodafone Qatar 8.20 (3.76) 2.24 6,932 N/A 1.5 N/A Telecoms 28,426 Qatar Navigation (Milaha) 63.00 1.61 12.62 7,215 14.5 0.5 5.6 Gulf Warehousing 42.45 4.79 (3.50) 2,488 11.2 1.6 4.0 Qatar Gas Transport (Nakilat) 14.70 0.00 (8.70) 8,144 9.4 1.4 6.8 Transportation 17,847 Qatar Exchange 491,781
- 6. Contacts Saugata Sarkar, CFA, CAIA Shahan Keushgerian Zaid al-Nafoosi , CMT, CFTe Head of Research Senior Research Analyst Senior Research Analyst Tel: (+974) 4476 6534 Tel: (+974) 4476 6509 Tel: (+974) 4476 6535 saugata.sarkar@qnbfs.com.qa shahan.keushgerian@qnbfs.com.qa zaid.alnafoosi@qnbfs.com.qa Mohamed Abo Daff QNB Financial Services Co. W.L.L. Senior Research Analyst Contact Center: (+974) 4476 6666 Tel: (+974) 4476 6589 PO Box 24025 mohd.abodaff@qnbfs.com.qa Doha, Qatar Disclaimer and Copyright Notice: This publication has been prepared by QNB Financial Services Co. W.L.L. (“QNBFS”) a wholly-owned subsidiary of Qatar National Bank (Q.P.S.C.). QNBFS is regulated by the Qatar Financial Markets Authority and the Qatar Exchange. Qatar National Bank (Q.P.S.C.) is regulated by the Qatar Central Bank. This publication expresses the views and opinions of QNBFS at a given time only. It is not an offer, promotion or recommendation to buy or sell securities or other investments, nor is it intended to constitute legal, tax, accounting, or financial advice. QNBFS accepts no liability whatsoever for any direct or indirect losses arising from use of this report. Any investment decision should depend on the individual circumstances of the investor and be based on specifically engaged investment advice. We therefore strongly advise potential investors to seek independent professional advice before making any investment decision. Although the information in this report has been obtained from sources that QNBFS believes to be reliable, we have not independently verified such information and it may not be accurate or complete. QNBFS does not make any representations or warranties as to the accuracy and completeness of the information it may contain, and declines any liability in that respect. For reports dealing with Technical Analysis, expressed opinions and/or recommendations may be different or contrary to the opinions/recommendations of QNBFS Fundamental Research as a result of depending solely on the historical technical data (price and volume). QNBFS reserves the right to amend the views and opinions expressed in this publication at any time. It may also express viewpoints or make investment decisions that differ significantly from, or even contradict, the views and opinions included in this report. This report may not be reproduced in whole or in part without permission from QNBFS COPYRIGHT: No part of this document may be reproduced without the explicit written permission of QNBFS. Page 6 of 6