Downloaded 128 times
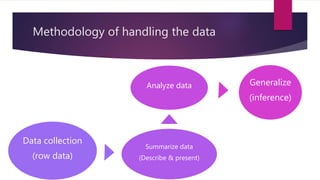
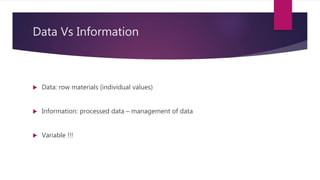
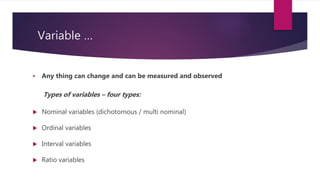
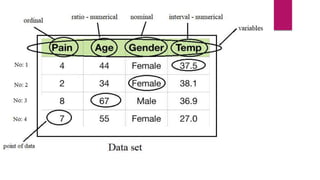
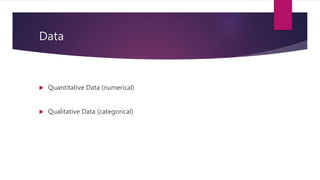
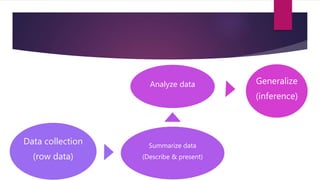
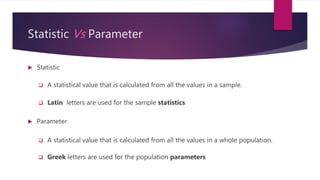

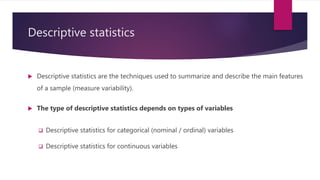


The document provides an overview of basic statistics, covering concepts such as data collection, organization, analysis, and the distinction between statistics and parameters. It outlines the types of variables, descriptive statistics for both categorical and continuous data, as well as measures of central tendency and dispersion. Additionally, it discusses inferential statistics, including confidence intervals, hypothesis testing, and examining associations between variables.


![CTEV [ clubfoot] DR ARUN LAL ,DR MOHAMED ASHRAF travancore medical college k...](https://cdn.slidesharecdn.com/ss_thumbnails/ctevclubfootdrarunlaldrmohamedashraftravancoremedicalcollegekollamkeralaindia-260208063247-18fc466c-thumbnail.jpg?width=640&height=640&fit=bounds)


![PERI-PROSTHETIC FRACTURE NAIL-PLATE CONSTRUCT [NPC].pptx](https://cdn.slidesharecdn.com/ss_thumbnails/drarunkumardrmohamedashrafperiprostheticfrasturenail-plateconstructnpc-260209164459-7e9d15a1-thumbnail.jpg?width=640&height=640&fit=bounds)


