
Recommended
More Related Content
What's hot
What's hot (20)
Viewers also liked
Similar to Equity bazaar 26.12.2016
Similar to Equity bazaar 26.12.2016 (20)
Recently uploaded
Recently uploaded (20)
Equity bazaar 26.12.2016
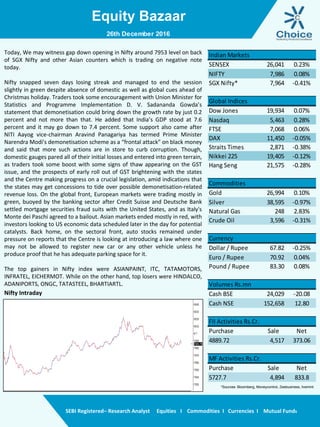
- 1. Equity Bazaar SEBI Registered– Research Analyst Equities I Commodities I Currencies I Mutual Funds Nifty Intraday Today, We may witness gap down opening in Nifty around 7953 level on back of SGX Nifty and other Asian counters which is trading on negative note today. Nifty snapped seven days losing streak and managed to end the session slightly in green despite absence of domestic as well as global cues ahead of Christmas holiday. Traders took some encouragement with Union Minister for Statistics and Programme Implementation D. V. Sadananda Gowda’s statement that demonetisation could bring down the growth rate by just 0.2 percent and not more than that. He added that India’s GDP stood at 7.6 percent and it may go down to 7.4 percent. Some support also came after NITI Aayog vice-chairman Aravind Panagariya has termed Prime Minister Narendra Modi's demonetisation scheme as a “frontal attack” on black money and said that more such actions are in store to curb corruption. Though, domestic gauges pared all of their initial losses and entered into green terrain, as traders took some boost with some signs of thaw appearing on the GST issue, and the prospects of early roll out of GST brightening with the states and the Centre making progress on a crucial legislation, amid indications that the states may get concessions to tide over possible demonetisation-related revenue loss. On the global front, European markets were trading mostly in green, buoyed by the banking sector after Credit Suisse and Deutsche Bank settled mortgage securities fraud suits with the United States, and as Italy's Monte dei Paschi agreed to a bailout. Asian markets ended mostly in red, with investors looking to US economic data scheduled later in the day for potential catalysts. Back home, on the sectoral front, auto stocks remained under pressure on reports that the Centre is looking at introducing a law where one may not be allowed to register new car or any other vehicle unless he produce proof that he has adequate parking space for it. The top gainers in Nifty index were ASIANPAINT, ITC, TATAMOTORS, INFRATEL, EICHERMOT. While on the other hand, top losers were HINDALCO, ADANIPORTS, ONGC, TATASTEEL, BHARTIARTL. 26th December 2016 SENSEX 26,041 0.23% NIFTY 7,986 0.08% SGX Nifty* 7,964 -0.41% Global Indices Dow Jones 19,934 0.07% Nasdaq 5,463 0.28% FTSE 7,068 0.06% DAX 11,450 -0.05% Straits Times 2,871 -0.38% Nikkei 225 19,405 -0.12% Hang Seng 21,575 -0.28% Commodities Gold 26,994 0.10% Silver 38,595 -0.97% Natural Gas 248 2.83% Crude Oil 3,596 -0.31% Currency Dollar / Rupee 67.82 -0.25% Euro / Rupee 70.92 0.04% Pound / Rupee 83.30 0.08% Volumes Rs.mn Cash BSE 24,029 -20.08 Cash NSE 152,658 12.80 FII Activities Rs.Cr. Purchase Sale Net 4889.72 4,517 373.06 MF Activities Rs.Cr. Purchase Sale Net 5727.7 4,894 833.8 Indian Markets *Sources- Bloomberg, Moneycontrol, Zeebusiness, livemint
- 2. Equity Bazaar SEBI Registered– Research Analyst Equities I Commodities I Currencies I Mutual Funds Nifty Outlook Bank Nifty Outlook 26th December 2016 L1 L2 L3 R 8025 8064 8105 S 7944 7903 7864 21 DEMA 8133 50 DEMA 8265 100 DEMA 8327 Moving Averages L1 L2 L3 R 17958 18031 18100 S 17815 17746 17673 21 DEMA 18353 50 DEMA 18700 100 DEMA 18698 Moving Averages On a weekly chart, Nifty has opened with the gap down and closed the week at 7985. Thus the Nifty closed the week with a loss of 154 points. In the intraday session, we have seen high volatility more over Nifty has formed spinning top candles stick pattern whereas on weekly chart Nifty has formed black opening body marubuzo as in continuation of the downtrend. Respectively higher time frame, weekly candlestick patterns indicate a bearish bias in the near term. On the weekly & daily chart, Nifty has been trading all moving averages which point out negative breath for index beside that on a daily chart, Nifty closed below lower band of Bollinger band which generated fresh sell signal. Option data suggest trading range may be 8000 to 8300 in near term. Nifty needs to hold 7900 level. If closed below it will open door for 7600/7200 Going Forward, with above technical structure, we expect negative move in the index up to the level 7900 On a daily chart, Bank Nifty open with gap down and closed near day's low at 17884 with gain of 61 point. Whereas on a weekly chart bank nifty loss of 374 point. Moreover on a weekly chart, Bank Nifty closed below lower band of Bollinger band which is generated fresh sell signal. Besides that, Bank Nifty has been trading below all moving averages in daily chart which point out bearish trend is intact. The current fall is a retracement of the entire rise from 13407 to 20575 and now Bank Nifty has been trading at 38.2% retracement so it may find support in range 17980 - 17720 A momentum indicator RSI reading is at 35 levels with a negative crossover which points out negative breath for the index other indicator also indicates bearish bias in near term. Going Forward, with above technical structure, we expect negative move in the index up to the level 17600
- 3. Equity Bazaar SEBI Registered– Research Analyst Equities I Commodities I Currencies I Mutual Funds 26th December 2016 Symbols CLOSE R3 R2 R1 P S1 S2 S3 Trend Action ACC 1295 1324 1315 1305 1295 1285 1276 1256 Down Sell ADANIPORTS 263 277 273 268 264 259 254 245 Down Sell AMBUJACEM 200 205 204 202 200 198 197 193 Down Sell ASIANPAINT 874 909 897 886 874 862 850 827 Up Buy AUROPHARMA 649 684 676 662 654 641 632 610 Down Sell AXISBANK 436 458 454 445 441 432 427 414 Down Sell BAJAJ-AUTO 2620 2730 2682 2651 2602 2571 2523 2443 Up Buy BANKBARODA 153 159 158 156 154 152 150 147 Down Sell BHARTIARTL 297 305 301 299 295 293 289 283 Up Buy BHEL 119 123 122 121 120 118 117 115 Down Sell BOSCHLTD 19880 20753 20317 20098 19662 19443 19007 18352 Up Buy BPCL 612 625 621 616 612 607 603 594 Down Sell CIPLA 582 634 612 597 574 560 537 500 Up Buy COALINDIA 288 292 291 289 288 286 285 282 Up Buy DRREDDY 2987 3086 3063 3025 3003 2965 2942 2882 Down Sell EICHERMOT 20930 21966 21702 21316 21052 20666 20402 19752 Down Sell GAIL 434 455 445 439 429 423 413 397 Up Buy GRASIM 831 857 844 837 825 818 806 787 Up Buy HCLTECH 797 837 826 812 801 787 776 751 Down Sell HDFC 1224 1259 1246 1235 1222 1211 1197 1173 Up Buy HDFCBANK 1186 1214 1202 1194 1182 1174 1162 1142 Up Buy HEROMOTOCO 3054 3139 3097 3075 3033 3011 2969 2905 Up Buy HINDALCO 159 164 163 161 160 158 157 154 Down Sell HINDUNILVR 790 816 808 799 790 782 773 756 Down Sell ICICIBANK 252 259 257 255 252 250 248 243 Down Sell IDEA 71 73 73 72 71 70 70 68 Down Sell INDUSINDBK 1065 1110 1090 1077 1057 1045 1025 992 Up Buy INFRATEL 337 347 343 340 336 333 329 321 Up Buy INFY 988 1038 1022 1005 989 972 956 923 Down Sell ITC 225 231 229 227 225 223 222 218 Down Sell KOTAKBANK 713 727 720 717 710 707 700 691 Up Buy LT 1340 1393 1368 1354 1328 1314 1289 1249 Up Buy LUPIN 1445 1477 1468 1457 1448 1437 1428 1408 Down Sell M&M 1173 1211 1197 1185 1170 1158 1143 1116 Up Buy MARUTI 5210 5442 5328 5269 5155 5096 4982 4809 Up Buy NTPC 161 167 164 163 160 159 156 152 Up Buy ONGC 193 201 199 196 194 191 190 185 Down Sell POWERGRID 182 187 185 183 181 180 178 174 Up Buy RELIANCE 1060 1086 1077 1069 1060 1052 1043 1026 Down Sell SBIN 249 255 254 251 250 247 246 242 Down Sell SUNPHARMA 623 649 639 631 621 613 603 585 Up Buy TATAMOTORS 468 479 474 471 466 463 457 449 Up Buy TATAMTRDVR 294 302 299 297 293 291 288 282 Up Buy TATAPOWER 74 79 77 76 74 73 71 68 Up Buy TATASTEEL 390 403 400 395 391 386 383 374 Down Sell TCS 2285 2348 2333 2309 2294 2270 2255 2216 Down Sell TECHM 467 487 482 475 470 462 458 446 Down Sell ULTRACEMCO 3107 3245 3202 3154 3111 3064 3021 2930 Down Sell WIPRO 459 474 469 464 460 455 450 441 Down Sell YESBANK 1125 1153 1146 1136 1129 1118 1112 1095 Down Sell ZEEL 442 466 456 449 438 431 421 403 Up Buy
- 4. Equity Bazaar SEBI Registered– Research Analyst Equities I Commodities I Currencies I Mutual Funds Contact Us www.choicebroking.in Kkunal Parar Sr. Research Associate kkunal.parar@choiceindia.com Vikas Chaudhari Research Associate vikas.chaudhari@choiceindia.com www.choicebroking.incustomercare@choiceindia.com Disclaimer This is solely for information of clients of Choice Broking and does not construe to be an investment advice. It is also not intended as an offer or solicitation for the purchase and sale of any financial instruments. Any action taken by you on the basis of the information contained herein is your responsibility alone and Choice Broking its subsidiaries or its employees or associates will not be liable in any manner for the consequences of such action taken by you. We have exercised due diligence in checking the correctness and authenticity of the information contained in this recommendation, but Choice Broking or any of its subsidiaries or associates or employees shall not be in any way responsible for any loss or damage that may arise to any person from any inadvertent error in the information contained in this recommendation or any action taken on basis of this information. Technical analysis studies market psychology, price patterns and volume levels. It is used to forecast future price and market movements. Technical analysis is complementary to fundamental analysis and news sources. The recommendations issued herewith might be contrary to recommendations issued by Choice Broking in the company research undertaken as the recommendations stated in this report is derived purely from technical analysis. Choice Broking has based this document on information obtained from sources it believes to be reliable but which it has not independently verified; Choice Broking makes no guarantee, representation or warranty and accepts no responsibility or liability as to its accuracy or completeness. The opinions contained within the report are based upon publicly available information at the time of publication and are subject to change without notice. The information and any disclosures provided herein are in summary form and have been prepared for informational purposes. The recommendations and suggested price levels are intended purely for trading purposes. The recommendations are valid for the day of the report however trading trends and volumes might vary substantially on an intraday basis and the recommendations may be subject to change. The information and any disclosures provided herein may be considered confidential. Any use, distribution, modification, copying, forwarding or disclosure by any person is strictly prohibited. The information and any disclosures provided herein do not constitute a solicitation or offer to purchase or sell any security or other financial product or instrument. The current performance may be unaudited. Past performance does not guarantee future returns. There can be no assurance that investments will achieve any targeted rates of return, and there is no guarantee against the loss of your entire investment. POTENTIAL CONFLICT OF INTEREST DISCLOSURE (as on date of report) Disclosure of interest statement – • Analyst interest of the stock /Instrument(s): - No. • Firm interest of the stock / Instrument (s): - No. Amit Pathania Research Associate amit.pathania@choiceindia.com 26th December 2016 Kapil Shah Research Associate kapil.shah@choiceindia.com