1. Initiating Coverage | Infrastructure
October 12, 2010
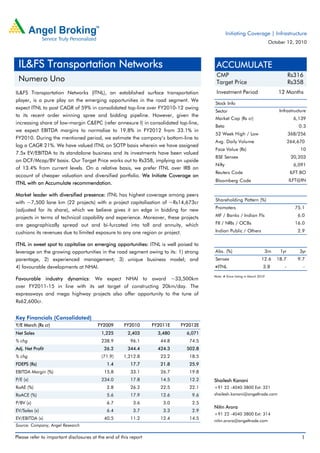
IL&FS Transportation Networks ACCUMULATE
CMP Rs316
Numero Uno Target Price Rs358
IL&FS Transportation Networks (ITNL), an established surface transportation Investment Period 12 Months
player, is a pure play on the emerging opportunities in the road segment. We
Stock Info
expect ITNL to post CAGR of 59% in consolidated top-line over FY2010-12 owing
Sector Infrastructure
to its recent order winning spree and bidding pipeline. However, given the
Market Cap (Rs cr) 6,139
increasing share of low-margin C&EPC (refer annexure I) in consolidated top-line,
Beta 0.3
we expect EBITDA margins to normalise to 19.8% in FY2012 from 33.1% in
52 Week High / Low 368/256
FY2010. During the mentioned period, we estimate the company’s bottom-line to
Avg. Daily Volume 264,670
log a CAGR 21%. We have valued ITNL on SOTP basis wherein we have assigned
Face Value (Rs) 10
7.5x EV/EBITDA to its standalone business and its investments have been valued
BSE Sensex 20,203
on DCF/Mcap/BV basis. Our Target Price works out to Rs358, implying an upside
Nifty 6,091
of 13.4% from current levels. On a relative basis, we prefer ITNL over IRB on
Reuters Code ILFT.BO
account of cheaper valuation and diversified portfolio. We Initiate Coverage on
Bloomberg Code ILFT@IN
ITNL with an Accumulate recommendation.
Market leader with diversified presence: ITNL has highest coverage among peers
Shareholding Pattern (%)
with ~7,500 lane km (22 projects) with a project capitalisation of ~Rs14,673cr
Promoters 75.1
(adjusted for its share), which we believe gives it an edge in bidding for new
projects in terms of technical capability and experience. Moreover, these projects MF / Banks / Indian Fls 6.0
are geographically spread out and bi-furcated into toll and annuity, which FII / NRIs / OCBs 16.0
cushions its revenues due to limited exposure to any one region or project. Indian Public / Others 2.9
ITNL in sweet spot to capitalise on emerging opportunities: ITNL is well poised to
leverage on the growing opportunities in the road segment owing to its: 1) strong Abs. (%) 3m 1yr 3yr
parentage, 2) experienced management; 3) unique business model; and Sensex 12.6 18.7 9.7
4) favourable developments at NHAI. # ITNL 3.8 - -
Note: # Since listing in March 2010
Favourable industry dynamics: We expect NHAI to award ~33,500km
over FY2011-15 in line with its set target of constructing 20km/day. The
expressways and mega highway projects also offer opportunity to the tune of
Rs62,600cr.
Key Financials (Consolidated)
Y/E March (Rs cr) FY2009 FY2010 FY2011E FY2012E
Net Sales 1,225 2,403 3,480 6,071
% chg 238.9 96.1 44.8 74.5
Adj. Net Profit 26.2 344.4 424.3 502.8
% chg (71.9) 1,212.8 23.2 18.5
FDEPS (Rs) 1.4 17.7 21.8 25.9
EBITDA Margin (%) 15.8 33.1 26.7 19.8
P/E (x) 234.0 17.8 14.5 12.2 Shailesh Kanani
RoAE (%) 2.8 26.2 22.5 22.1 +91 22 -4040 3800 Ext: 321
RoACE (%) 5.6 17.9 12.6 9.6 shailesh.kanani@angeltrade.com
P/BV (x) 6.7 3.6 3.0 2.5
Nitin Arora
EV/Sales (x) 6.4 3.7 3.3 2.9
+91 22 -4040 3800 Ext: 314
EV/EBITDA (x) 40.5 11.2 12.4 14.5
nitin.arora@angeltrade.com
Source: Company, Angel Research
Please refer to important disclosures at the end of this report 1
2. Initiating Coverage | Infrastructure
Investment Arguments
Market leader in growing BOT space
ITNL is market leader in the road BOT ITNL is a surface transport player, with an established track record of having
sector and a diversified player in terms successfully bid, developed and operating road BOT projects on a commercial
of geographic presence and mix of basis. ITNL was one of the first movers in road development segment and bagged
projects the Noida toll bridge project in 1998. It has come a long way since then and
currently has a sizeable portfolio. ITNL has a portfolio encompassing over ~7,500
lane km, one of the largest in the country. The company’s experience and technical
capability coupled with a project capitalisation of ~Rs14,673cr gives its an edge
over competition to bid for new projects (refer annexure III)
Exhibit 1: Project Portfolio (lane km)
8,000
7,000
6,000
5,000
4,000
3,000
2,000
1,000
-
IVRCL GMR Infra Reliance Infra L&T IRB ITNL
Total Operational
Source: Company, Angel Research
Exhibit 2: Project capitalisation (Rs cr)
Oper. % to Total Under Develop. % to Total *Total
ITNL 3,562.6 24.3 11,110.7 75.7 14,673.3
IRB Infra 5,684.1 54.1 4,816.0 45.9 10,500.1
Average 4,623.4 36.7 7,963.4 63.3 12,586.7
Sadbhav Eng. 647.4 12.4 4,593.6 87.6 5,241.0
Nagarjuna Const 394.3 37.4 659.2 62.6 1,053.5
IVRCL Assets 1,492.7 16.0 7,854.5 84.0 9,347.2
Madhucon Projects 1,043.2 42.1 1,432.0 57.9 2,475.2
Average 894.4 19.7 3,634.8 80.3 4,529.2
Source: Company, Angel Research, Note: * Includes only those projects for which concession
agreement has been signed
Pan India presence
ITNL has a pan-India presence coupled ITNL has 22 road projects spread across the length and breadth of the country.
with a diversified portfolio of 22 Over the years, India has accelerated investments in the state highways and major
projects and decent exposure to state district roads. State roads represent an investment opportunity of ~Rs1,940bn over
highways the next five years (Source: Crisil). The state governments are also taking measures
to increase private participation in state highways. The private investment
opportunity in the state roads is estimated to be close to Rs485bn (25% of
Rs1,940bn).
October 12, 2010 2
3. Initiating Coverage | Infrastructure
Exhibit 3: Investment trend in state roads (Rs bn)
500
452
450 422
400 373
355
338
350
300
250
200
150
100
50
0
FY2011E FY2012E FY2013E FY2014E FY2015E
Source: Crisil, Angel Research
ITNL has decent exposure to the state highways (41% of the total project
capitalisation), which differentiates it from its peers. Moreover, the one major
advantage that state highway projects enjoy over the national highways is that they
can be bundled with land making the projects viable. Such diversification prevents
fluctuation in its revenue stream due to limited exposure to any one region or
project.
Exhibit 4: ITNL – Present across geographies
Source: Company, Angel Research
Hedged revenue stream
ITNL’s current project mix reduces its We believe that ITNL currently has a hedged road BOT asset portfolio as it is
dependence on traffic related revenue bi-furcated equally into toll and annuity projects in revenue terms, thereby
inflow reducing its dependence on traffic related revenue inflow. Going ahead as well,
we expect the company to continue to have balanced revenues considering the
projects in pipeline.
October 12, 2010 3
4. Initiating Coverage | Infrastructure
Exhibit 5: BOT portfolio depicts a balanced revenue flow (Rs cr)
3,000
2,500
2,000 1,312
1,029
1,500
1,000 537
1,317 1,317
500 354 402
287 655
196 305 355
-
FY10 FY11E FY12E FY13E FY14E FY15E
Annuity Toll
Source: Company, Angel Research
ITNL in sweet spot
ITNL is well poised to leverage on the We believe that ITNL being a market leader is well poised to leverage on the
growing opportunities in the road growing opportunities in the BOT space owing to 1) strong parentage (belongs to
segment owing to its strong parentage, the IL&FS group), 2) experienced management at the helm of affairs, having rich
experienced management, unique experience of >22 years in infrastructure business; 3) unique business model
business model and recent favourable which is present across value chain, and 4) recent favourable developments at the
developments at NHAI level NHAI level.
Strong parentage: ITNL has a strong parent in Infrastructure Leasing &
Financial Services (IL&FS), which has rich experience in project advisory,
project development and debt syndication. We believe that ITNL on account of
having strong parentage would enjoy an edge over competition as it would
leverage this advantage while bidding and qualifying for new projects or
approaching lenders for financing its projects.
Experienced management: ITNL’s Board comprises an experienced and
professional management who have vast experience in the surface
transportation segment. Some of the top personnel have also been associated
with NHAI in the past, which we believe will benefit the company while bidding
for upcoming projects.
Unique business model: ITNL’s in-house engineering capabilities include a
design & development unit, a testing laboratory and a web-based information
management system. The company however does not have a construction arm
on account of which it outsources it to third party contractors.
Favourable developments at NHAI: There has been a sea change in the
functioning of NHAI especially, after Kamal Nath took over as the Minister of
Road Transport and Highways last year. A distinguishing change, apart from
the implementation of the BK Chaturvedi report, has been the increase in the
ticket size of orders awarded by NHAI. Moreover, there has been a constant
uptick in the same, which has been benefiting the larger players especially
given the recent changes in the financial criteria for larger projects.
October 12, 2010 4
5. Initiating Coverage | Infrastructure
Exhibit 6: Transforming NHAI – bigger players to benefit
Net worth criteria (Rs cr)
Total Project Cost (TPC) Calculation Max.
< Rs2,000cr 25% of TPC 500
> Rs2,000cr < Rs3,000cr 500cr+50% in excess of Rs2,000cr 1,000
>Rs3,000cr 1,000cr+100% for TPC above Rs3,000cr NA
Source: NHAI, Angel Research
Increase in road sector outlay to benefit ITNL
Emerging opportunities in road sector; Infrastructure development has a cascading effect on the overall economic
ITNL well placed to capitalise on the progress of a country. Past studies reveal that every rupee spent on creating road
same and ramp up its roads portfolio infrastructure creates seven rupees in terms of economic benefits. Hence, NHAI
has set an aggressive target of constructing 20km/day.
Exhibit 7: Target of 20km/day - seems far
Opening WIP Awarding Total Under Development Est. Completion Closing WIP Run Rate (%) km/day
FY11E 9,030 7,000 16,030 3,000 13,030 18.7 8.2
FY12E 13,030 9,000 22,030 3,750 18,280 17.0 10.3
FY13E 18,280 6,117 24,397 4,688 19,710 19.2 12.8
FY14E 19,710 6,126 25,836 5,859 19,976 22.7 16.1
FY15E 19,976 5,253 25,229 7,324 17,905 29.0 20.1
Source: NHAI, Angel Research
We believe NHAI needs to increase its pace of awarding to achieve its set target of
building 20km/day. Moreover, National Highway Development Programme’s
(NHDP) original deadline of constructing of about ~48,829km by 2017 would in
turn depend on the award activity getting completed by FY2013-14, as the time
lag between the awarding and completion is a minimum of forty-two to forty-eight
months. The target is aggressive - ramping up the road development activity four-
folds – the recent schedule of award activity suggests that it seems achievable only
post FY2014.
NHAI has awarded 2,817km in Exhibit 8: Uptick in order awarding continues (km)
1HFY2011 and we are expecting NHAI
8,000
to end with 7,000km for the year 7,000
7,000
6,000
4,740
5,000
4,000 3,361
3,000
1,734 2,817
2,000 1,305 1,234
1,000 677 643
312
0
FY03 FY04 FY05 FY06 FY07 FY08 FY09 FY10 FY11E
Source: NHAI, Angel Research
October 12, 2010 5
6. Initiating Coverage | Infrastructure
Expressways and mega highways would Also, on the anvil there are plans to build 18,367km of expressways by 2022 in
require an investment of Rs626bn over three phases. Around 1,000km of expressway is expected to be completed over the
the next five years, which would provide next five years representing an opportunity of ~Rs203bn (average capex per km is
an opportunity particularly for the big ~Rs20cr). The government has also identified nine mega projects with length
players with sound financial health ranging between 390km to 700km. In fact, over the next five years, an investment
of ~Rs423bn is expected to flow into mega projects. We believe that these big
ticket size orders would see less competition due to the pre-requisite of sound
financial health and technical expertise, in turn generating high returns for the big
players (read ITNL). We believe that ITNL is in a position to tap these upcoming
opportunities in the road sector to further ramp up its road portfolio.
Order book to further swell
ITNL has a robust order book of ITNL has a robust order book of ~Rs16,000cr (or 8.8x FY2011E revenues), which
~Rs16,000cr (as of June 2010) or 8.8x provides high revenue visibility over the next few years with an average execution
FY2011E revenues providing high period of 30 months. The company is yet to achieve financial closure (FC) for the
revenue visibility recently bagged orders worth ~Rs6,000cr. The company has seen substantial
growth in its order book mainly due to the increase in project awarding by the
NHAI. In 1HFY2011 particularly, the company saw a surge in its order inflow. We
expect the company to continue to see a swell in its order book going ahead as
well.
Exhibit 9: Order book to ramp-up
30,000 18.0
15.5 16.0
25,000
14.0
20,000 11.8 12.0
10.1 10.0
15,000
8.0
10,000 6.1 6.0
4.0
5,000
2.0
- -
FY2009 FY2010 FY2011E FY2012E
Order Inflow (Rs cr, LHS) Order Backlog (Rs cr, LHS)
OB/Sales (x, RHS)
Source: Company, Angel Research
October 12, 2010 6
7. Initiating Coverage | Infrastructure
Financials
Standalone performance
Top-line to post strong CAGR of 126%
We expect standalone top-line to post a Post the change in the company’s awarding policy, the entire EPC contract from
CAGR of 126% over FY2010-12E the SPV now goes to the parent, which in turn subcontracts the civil construction
primarily led by the substantial surge in work to a third party, while the project management is handled by the parent for
revenues of the construction segment, ~10% of the total project cost. Earlier the EPC orders were divided into two
registering a CAGR of 429% over the packages, viz. 1) the civil construction work was directly given to third party
same period subcontractors by the respective SPVs, and 2) project management and supervision
fees were given to the parent being its forte, and the parent used to charge the SPV
around >15% of the TPC for these services. (refer annexure I)
As a result, the standalone business will not be comparable with the previous
period. Importantly, it would also see a significant ramp up in revenues thereby
boosting overall consolidated revenues. Over FY2010-12E, we expect the
company’s standalone top-line to post a robust CAGR of 125.9% to Rs4,315cr
from Rs845cr in FY2010, which would be primarily be led by the ramp up in
revenues from the construction segment, which is expected to register a substantial
surge in revenues registering a CAGR of 428.7% to Rs3,276.7cr over FY2010-12E
from Rs117.2cr.
We expect order book to grow at a CAGR of 23.1% over FY2010-12E on the back
of higher orders expected to be bagged from NHAI and the state governments.
Pertinently, we have assumed that ITNL would maintain its share (~10%) of orders
from NHAI going ahead and bag decent orders from the state government as well.
Exhibit 10: Top-line set to soar Exhibit 11: ITNL to maintain momentum in order inflow
5,000 14,000
12,432
4,500 4,315
12,000
4,000 10,200
3,500 10,000
8,200
3,000 8,000
(Rs cr)
(Rs cr)
2,500
6,000
2,000 1,821
4,200
1,500 4,000
1,000 845
2,000
500 171
- -
FY2009 FY2010 FY2011E FY2012E FY2009 FY2010 FY2011E FY2012E
EPC revenues Order Inflow
Source: Company, Angel Research Source: Company, Angel Research
October 12, 2010 7
8. Initiating Coverage | Infrastructure
EBITDA margins to normalise
We expect EBITDA to post a CAGR of As per the earlier policy, the parent charged fees to the tune of 10-15% of the TPC
19.4% over FY2010-12E with increase to the SPV resulted in high EBITDA margins as the corresponding administrative
in the share of construction revenues (a expenses were minimal. However, now with the change in the policy, the parent
low margin segment) from 13.9% to books EPC revenues at two stages: initially the company books ~10% of the EPC
75.9% over FY2010-12E contract as advisory fees, which results in high EBITDA margins of ~60-65%.
However, in the second phase, it books revenues from the pure construction work,
which fetches low margins of ~5-6%.
We expect EBITDA to post a CAGR of 19.4% over FY2010-12E with increase in the
share of construction revenues (a low margin segment) from 13.9% to 75.9% over
FY2010-12E. Consequently, share of advisory fees is expected to decline.
Therefore, EBITDA margins are expected to normalise going ahead.
Exhibit 12: EBITDA margins to stabilise by FY2012E
3,500 3,277 70.0
64.8
3,000 60.0
2,500 50.0 50.0
2,000 40.0
1,500 1,147 30.0
26.1
1,038
1,000 728 18.1 20.0
674
500 10.0
131 39 117
- -
FY2009 FY2010 FY2011E FY2012E
Fee Income (Rs cr, LHS) Construction Revenue (Rs cr, LHS) EBITDAM (%, RHS)
Source: Company, Angel Research
Gearing to increase
ITNL currently has a debt/equity ratio of As on FY2010, ITNL has a debt/equity ratio of ~1:1. During the year, the
~1:1; going forward we expect gearing company raised funds to the tune of ~Rs590cr via an IPO. ITNL has asset loaded
to increase due to the increase in order business model in which it transfers the BOT assets to controlling SPVs. The SPVs
inflow are normally funded at 70:30 debt/equity ratio. ITNL standalone pumps in entire
equity in the respective SPVs upfront to save on interest costs during the
construction period. The parent also funds the short-term needs of the SPVs. Thus,
over FY2011-12 with the increase in order inflow, the parent would have pump in
~Rs2,500cr into the SPVs in turn increasing its gearing.
October 12, 2010 8
10. Initiating Coverage | Infrastructure
Consolidated performance
Top-line to post 59% CAGR
We expect ITNL to post consolidated We expect ITNL to post 59% CAGR in consolidated top-line primarily driven by the
top-line CAGR of 59% over FY2010-12E standalone numbers. Elsamex is estimated to record flat top-line CAGR during the
period, while revenues from the BOT projects though growing constitutes an
insignificant proportion of consolidated revenues. Going ahead as well, we expect
the company’s overall performance, on a consolidated basis, to be primarily
driven by its standalone business.
Exhibit 16: Increasing contribution of standalone business
7,000 80.0
6,000 71.1 70.0
60.0
5,000
52.3 50.0
4,000
40.0
3,000 35.2
30.0
2,000
20.0
13.9
1,000 10.0
- -
FY2009 FY2010 FY2011E FY2012E
Standalone (Rs cr, LHS) Consolidated (Rs cr, LHS) % to Total (RHS)
Source: Company, Angel Research
EBITDA margins to go standalone way
We expect EBITDA margins to normalise At the EBITDA front, ITNL, like the standalone business, is expected to witness some
from 33.1% in FY2010 to 19.8% by margin pressure given the change in policy and resulting rising share of
FY2012E given the change in policy construction revenues. Thus, we estimate EBITDA margins to normalise from 33.1%
and rising share of construction in FY2010 to 19.8% by FY2012E.
revenues
Exhibit 17: EBITDA margins to subdue
1,400 35.0
33.1 1,200.7
1,200 30.0
26.7
1,000 928.6 25.0
794.2
800 19.8 20.0
600 15.8 15.0
400 10.0
193.4
200 5.0
0 -
FY2009 FY2010 FY2011E FY2012E
EBITDA (Rs cr, LHS) EBITDAM (%, RHS)
Source: Company, Angel Research
October 12, 2010 10
11. Initiating Coverage | Infrastructure
Strong top-line to drive bottom-line
On bottom-line front, we expect ITNL to On the bottom-line front, we expect ITNL to post a CAGR of 21% over
post a CAGR of 21% over FY2010-12E, FY2010-12E, on the back of strong top-line growth. However, PAT margins are
on the back of strong top-line growth expected to dip owing to normalised EBITDA margins and increasing interest costs.
Exhibit 18: Bottom-line on steady growth trajectory
600.0 16.0
14.3
502.8 14.0
500.0 424.3
12.2 12.0
400.0
344.4 10.0
300.0 8.3 8.0
6.0
200.0
4.0
100.0 2.1 2.0
26.2
0.0 -
FY2009 FY2010 FY2011E FY2012E
PAT (Rs cr, LHS) PATM (%, RHS)
Source: Company, Angel Research
Insignificant contribution by Elsamex
ITNL acquired the loss-making Spanish company Elsamex in March 2008. In
FY2010 however the company registered an improvement in its performance. ITNL
management streamlined and reduced Elsamex’s financing costs on standalone
basis. In FY2010, Elsamex contributed a significant ~41% to ITNL’s top-line.
However, going ahead, Elsamex’s top-line is expected to be flat while there would
be a pickup in ITNL’s standalone performance. Thus, we expect Elsamex’s
bottom-line contribution to continue to be insignificant to overall numbers.
Exhibit 19: Revenue contribution from Elsamex to reduce (%)
80.0
70.0 71.1
60.0 61.1
50.0 52.3
42.6
40.0
36.4
30.0 25.9 28.5
21.0 16.3
20.0 19.2
12.9
10.0 12.6
-
FY2009 FY2010 FY2011E FY2012E
Standalone Elsamex BOT
Source: Company, Angel Research
October 12, 2010 11
12. Initiating Coverage | Infrastructure
Concerns
Interest rate risks
ITNL’s business model is vulnerable to The inherent nature of the BOT project requires high leverage. Going by thumb
interest rate fluctuations, and any hike rule, most road BOT projects have a debt-equity blend of 70:30. In case of ITNL, it
in the interest rates could increase its has project capitalisation of ~Rs14,673cr, implying high exposure to debt. Further,
interest costs ITNL does securitisation of its revenues and further leverages its balance sheet.
Therefore, ITNL has one of the highest leveraged portfolios in the industry. Hence,
its business model is vulnerable to interest rate fluctuations, and any hike in the
interest rates could increase its interest costs.
Exhibit 20: Debt set to increase
500.0 470.6 5.0
450.0 4.5 4.5
400.0 4.0
350.0 332.8 3.5
300.0 294.1 3.0
2.6
250.0 2.5
200.0 174.3 2.0
150.0 1.8 1.6 1.5
100.0 1.0
50.0 0.5
- -
FY2009 FY2010 FY2011E FY2012E
Interst Cost (Rs cr, LHS) Net debt to equity (x, RHS)
Source: Company, Angel Research
Nonetheless, management has stated that it targets to maintain leverage below 2x.
This implies that going ahead the company would require equity dilution to
maintain its guidance given the investments lined up over the next couple of years.
However, we await more clarity on the same and have not factored in any dilution
in our numbers
New order inflows hold the key
Any pullback by the NHAI or/and state ITNL’s standalone revenues currently contribute significantly to overall consolidated
governments in award of projects would revenues. Pertinently, the standalone revenues are driven by the advisory fees and
negatively impact the company’s EPC. Hence, order inflow acts as a catalyst for the segment. Therefore, any
performance pullback by the NHAI or/and state governments in award of projects would
negatively impact the company’s performance. Nevertheless, ITNL being the
market leader would be shielded to a large extent in case any let up in order
inflow as the outlay is already substantial.
Dependence on third-party contractors and execution delays
ITNL is dependent on third-party Unlike its peers, ITNL does not have an in-house construction arm and is
contractors to execute its projects thus dependent on third-party contractors to execute its projects. This makes its revenue
exposed to execution risks profile vulnerable as construction constitutes a major chunk of the total project cost
and it does not have direct control over the construction activities. The company is
also exposed to face high execution risks, which could impact its profitability.
October 12, 2010 12
13. Initiating Coverage | Infrastructure
Outlook
There has been strong focus on re-vitalising the road sector particularly since the
re-election of the UPA government in May 2009. The MORTH has set itself the
target of constructing 20km/day as well as introduced policy reforms to encourage
more private participation in the sector. Further, with the liquidity scenario
improving and more realistic risk-sharing system emerging have positively
contributed to the sector. Further, the states have also been tracking the centre’s
initiatives of lending a boost to the sector. Consequently, there has been a spate of
awards, and projects have shown visible movement at the ground level.
We believe that all such changes in the positive direction have encouraged more
participation from the private sector, which has been visible over the last few
months. Such enthusiasm has been witnessed both at the developers and lenders
end alike resulting in overall lending improving in the infrastructure sector. Clearly,
we believe that private participation and the public private partnership (PPP) model
is the way forward.
Exhibit 21: NHDP-Ph. III - Opportunities galore (%) Exhibit 22: NHDP- Ph. V - Awarding on fast track (%)
100.0 100.0
90.0 90.0
80.0 80.0
70.0 70.0
60.0 60.0
50.0 50.0
40.0 40.0
30.0 30.0
20.0 20.0
10.0 10.0
- -
FY2011E FY2012E FY2013E FY2014E FY2015E FY2011E FY2012E FY2013E FY2014E FY2015E
BOT-Toll BOT-Annuity Cash BOT-Toll BOT-Annuity
Source: Crisil, Angel Research Source: Crisil, Angel Research
On the flip side, the sector is still plagued by numerous problems including land
acquisition issues, inefficient or non-existent dispute resolution mechanisms, which
result in inadvertent delays, most state and central agencies lack management
skills to oversee the dozens of concurrent projects. Moreover, skilled labour and
experienced engineers to execute complex construction are scarce in numbers.
Thus, we believe that cost and time overruns are a reality facing the sector.
Nonetheless, we remain positive on the sector in view of the changing dynamics of
the sector, which was evident in the previous decade. The large upcoming
opportunities also instill new found confidence that faster action could be expected
at the ground level going ahead. This we believe would lead to benefits for all the
players in the segment especially for companies like ITNL given its strong hold on
the sector and vast experience to leverage upon. Therefore, we are bullish on the
prospects of the road sector and would like to bet on the market leaders (read
ITNL) to seize the opportunity.
October 12, 2010 13
14. Initiating Coverage | Infrastructure
Valuation
We have valued ITNL on SOTP basis – by assigning 7.5x EV/EBITDA to its
standalone business and valued its investments on DCF/Mcap/BV basis – and
arrived at a target price of Rs358, which implies an upside of 13.4% from current
levels. We initiate coverage on the stock with an Accumulate rating.
Standalone business to contribute Rs159/share
On standalone basis, the company derives its income from advisory fees and
C&EPC work. We are expecting the company to post a CAGR of 125.9% and
19.4% on the top-line and bottom-line front over FY2010-12E. We have valued
this business on EV/EBITDA basis given the balance sheet is loaded with debt and
have applied a similar multiple for its peers like IVRCL, NCC, HCC etc. We thus
arrive at a value of Rs159/share for the standalone business.
BOT projects and other investments to contribute Rs199/share
We have valued the existing BOT projects of ITNL at Rs151/share based on the net
present value (NPV) of the cash flows to equity. We have assumed cost of equity at
14% for all the projects. Other key assumptions include interest cost at ~10-11%
p.a. and traffic and toll growth for toll projects at 5% p.a. It should be noted that
we have valued Noida Toll Bridge on Mcap basis arriving at a value of
Rs6.5/share. We have valued Gurgaon Metro, Vansh Nimay project and Elsamex
on P/BV basis fetching values of Rs1.1/share, Rs0.7/share and Rs24.7/share
respectively.
Exhibit 23: DCF for BOT projects
Project Status Revenue DCF Value ITNL's Stake ITNL's Share Value/Share Implied P/BV
(Rs cr) (%) (Rs cr) (Rs) (x)
North Karnataka Exp. Operational Annuity 39.6 94.0 37.2 1.9 0.7
Thiruvanathapuram Phase 1 & 2 Oper./Under Const. Annuity 55.3 50.0 27.7 1.4 0.4
Andhra Pradesh Exp Operational Annuity (17.1) 100.0 (17.1) (0.9) (1.1)
Gujarat Toll Roads Operational Toll 815.0 84.0 684.6 35.2 6.4
RIDCOR, Rajasthan Phase 1 & 2 Oper./Under Const. Toll 175.3 50.0 87.6 4.5 0.6
West Gujarat Exp Operational Toll 140.9 100.0 140.9 7.3 3.5
Hyderabad Ring Road Operational Annuity 67.3 26.0 17.5 0.9 1.5
Beawar-Gomti Operational Toll 143.3 100.0 143.3 7.4 3.4
Jharkhand Phase 1 & 2 Under Construction Annuity 85.4 100.0 85.4 4.4 0.4
Chhattisgarh Phase -1,2,3 Under Construction Annuity 276.6 74.0 204.7 10.5 1.1
East Hyderabad Exp. Under Construction Annuity 282.4 74.0 209.0 10.8 9.6
Hazaribaug Ranchi Exp. Under Construction Annuity 13.0 74.0 9.6 0.5 0.1
Warora Chandrapur Under Construction Toll 235.3 35.0 82.3 4.2 1.7
Pune Sholapur Under Construction Toll 260.1 100.0 260.1 13.4 1.6
Moradabad Bareilly Under Construction Toll 633.6 100.0 633.6 32.6 4.5
Narketpalli Addanki Under Construction Toll 422.2 50.0 211.1 10.9 3.8
Jorbat Shillong Under Construction Annuity 47.3 50.0 23.6 1.2 0.7
Chenani Nashri Under Construction Annuity 99.2 100.0 99.2 5.1 0.5
3,774.5 2,940.3 151.4
Source: Company, Angel Research
October 12, 2010 14
15. Initiating Coverage | Infrastructure
Exhibit 24: SOTP break-up
Method Multiple (x) Value (Rs cr) Value/ Share (Rs)
Road BOT Projects DCFE - 2,940.3 151.4
Vansh Nimay Investment 1.0 9.0 0.7
Gurgaon Metro Investment 1.0 14.0 1.1
Noida Toll Bridge 20% Disc to Mkt. Cap. - 127.0 6.5
Elsamex Investment 1.5 480.8 24.7
Parent EV/EBITDA 7.5 5,855.8 301.4
Net Debt at parent level (2,773.7) (142.8)
Growth Premium for BOT projects 10% Growth Premium - 294.0 15.1
Fair Value 6,947.2 358
CMP 316
Upside (%) 13.4
Source: Company, Angel Research
Exhibit 25: We prefer ITNL over IRB given relatively better valuations
ITNL IRB
No. of projects 22 16
Projects in more developed states x √
Foreign presence √ x
More diversified Portfolio √ x
Total lane km (stake adjusted) 7,562 5,734
Lane kms under operation – toll 2,142 3,404
Lane kms under operation – annuity 837 -
Lane kms under development 4,583 2,330
Average Weighted Age of Portfolio (years) 1.8 2.1
TPC (stake adjusted) (Rs cr) 16,785 10,500
Equity Commitment (Rs cr) 1,263 1,327
Investments required over next 2 years (Rs cr) 2,500 2,054
Net debt/Equity (FY12E) (x) 4.5 1.9
Estimated Asset value (Rs cr) 3,775 5,510
Implied P/BV (x) 3.0 4.2
Source: Company, Angel Research, Note: Average Weighted Age of Portfolio (years) = Age of
project x Weights, Weights= TPC of SPV/ TPC of All SPVs
Exhibit 26: ITNL v/s IRB
CMP TP Recommendation M.cap Oder Backlog P/E(x) EV/EBITDA(x) P/B(x)
(Rs) (Rs) (Rs cr) (Rs cr) FY2011E FY2012E FY2011E FY2012E FY2011E FY2012E
ITNL 316 359 Accumulate 6,139 16,000 14.5 12.2 12.4 14.5 3.0 2.5
IRB 260 - Neutral 8,737 7,431 21.1 17.9 10.7 9.6 3.6 3.1
Source: Company, Angel Research
October 12, 2010 15
16. Initiating Coverage | Infrastructure
Company Background
ITNL, an established surface ITNL incorporated in 2000 by Infrastructure Leasing and Financial Services (IL&FS),
transportation player, is a pure play on is an established surface transportation infrastructure company and is the largest
emerging opportunities in the road private sector BOT road operator in India. ITNL has been involved in constructing
segment and operating BOT roads in India since 1994.
ITNL is a developer, operator, and facilitator of surface transportation
infrastructure projects, executing projects from the initial stages of
conceptualisation through commissioning to operations and maintenance. The
company has been involved in the development, operation, and maintenance of
national and state highways, flyovers, and bridges with a presence in Andhra
Pradesh, Haryana, Gujarat, Maharashtra, Karnataka, Uttar Pradesh, Kerala,
Jharkhand, Chhattisgarh, J&K, Meghalaya and Rajasthan.
ITNL has a large portfolio with 10 toll road and 12 annuity projects totaling
~7,500 lane km. The company’s road BOT asset portfolio is spilt into annuity
(41%) and toll (59%) in revenue terms. Further, ITNL's associate company "Noida
Toll Bridge Co. Ltd." was also the first toll bridge co. in India to be listed on the
national and international stock exchanges.
ITNL is also developing other transportation infrastructure sub-sectors such as
mass rapid transport systems (MRTS) and urban transportation infrastructure
segment. The consortium of ITNL and DLF is developing a 4.9km track of elevated
metro rail link project in Gurgaon (Haryana). This project has a concession period
of 99 years.
ITNL is also involved in the mobilisation, operation and maintenance of the
Nagpur city bus services on Build Operate Own (BOO) basis. The project, which
commenced in February 2007 is now fully operational (Phase-I 230 buses) with a
concession period of 10 years (renewable for another five years).
October 12, 2010 16
17. Initiating Coverage | Infrastructure
International Foray
ITNL acquired Elsamex to complement In March 2008, ITNL commenced its international operations with the acquisition
its road BOT operations utilising of Elsamex for EUR12.1mn and another EUR40.1mn was invested taking the total
Elsamex's maintenance capabilities and consideration to EUR52.2mn. Elsamex is a provider of maintenance services for
facilitate entry into the international highways and roads in Spain and other countries. ITNL acquired Elsamex to
markets complement its road BOT operations utilising its maintenance capabilities and
facilitate entry into the international markets such as Spain, Portugal and Latin
America.
Elsamex's primary business is the maintenance of roads, buildings and petrol
stations mainly in Spain, with additional operations in Portugal in Europe and
Columbia and Mexico in South America. Elsamex also provides consulting services
for roads and water supply projects in the areas of quality control, safety, health
and environment. Additionally, Elsamex conducts research and development for
road maintenance projects, with particular focus on bitumen technology.
Elsamex has experience of providing operations and maintenance (O&M) services
to over 21,000 lane km of roads across 10 countries in Latin America and the
European region. It is also involved in the maintenance of 3,100 petrol stations in
Europe. The company mainly provides O&M services along with consulting services
for road and water projects. It also does R&D for the road maintenance projects
using the bitumen technology.
Overall, Elsamex not only provides ITNL direct leeway into the international
market, but also imparts its expertise and niche technology in the emerging high-
margin O&M segment, which would be utilised by ITNL in India.
October 12, 2010 17
18. Initiating Coverage | Infrastructure
Annexure - I
Transformation in ITNL’s business model
ITNL
Controlling Stake in SPV
SPV signs concession aggreement
with respective Govt. authority
Advisory Advisory EPC
EPC
Fees Fees contract
contract
ITNL
Third party
ITNL Contractor
EPC contract
Third party
Contractor
Old Policy New Policy
Source: Company, Angel Research
October 12, 2010 18
20. Initiating Coverage | Infrastructure
Annexure – III
Positive changes in roads segment
Old Clause Change in Clause Impact
If the average daily traffic in any accounting This clause has been removed Removal of this clause helps
year exceeds the design capacity and from new MCA achieving financial closure and
Termination Clause continues to exceed three subsequent eliminates the limited upside risk for
accounting years, NHAI may terminate the the developers
agreement
Previously grant was limited to 20% of the total Combined equity and O&M Will improve project viability through
project cost. Excess grant was provided as grant into equity support, better cash flow visibility during the
Viability gap funding operations and maintenance (O&M) grant maximum 40% of the project construction period
after achieving the commercial operations cost
date (COD)
Promoters were earlier required to hold a Exit option allowed for principal Revised clause allows promoters to
minimum of 26% of a SPV’s shareholding at promoters of the road SPVs after infuse capital in other projects and
all times during the concession period two years from COD financial investors are attracted to
Exit Clause
invest in operational projects due to
absence of construction risks in the
operational projects
Threshold limit for common shareholding of Threshold limit has been Increased participation from private
entities in competing applicants resulting in increased from 5% to 25% sector, which was previously getting
Conflict of interest
conflict of interest was 5% disqualified due to lower threshold
limit
Threshold technical capability to be eligible for Threshold technical capability More players are able to participate
project experience was 10-20% of the has been reduced to 5-10% from due to lowering of technical criteria
Technical capability estimated project cost and threshold technical 10-20% and threshold technical
and experience score experience score for prequalification was twice experience score should be
the estimated project cost equal to the estimated project
cost
Source: NHAI, Angel Research
October 12, 2010 20
21. Initiating Coverage | Infrastructure
Annexure – IV
Exhibit 27: Policies across states
Maharashtra Gujarat M.P. Rajasthan Karnataka NHAI
Model Concession
Agreement
Grant Max 40% - 50% Max 40% Max 40% Max 40% - Max 40% - Max 40% -
during
100% payment 100% payment 100% payment
construction
and 50% as during during
during construction
O&M construction construction
support period period period
Land Acquisition 100% of land Min 50% of - 100% of land - Min 80% of land
acquisition with in land acquisition acquisition with in acquisition till LOA
30 days from 90 days from
till financial
LOA LOA
closure
Tolling Policy
Revision of rates Base rate * 6% Base rate*3% + Base rate* Base rate* 10% Base rate* Base rate*3% +
100% change
(40% change in 100% change in (40% change in
in
WPI) WPI WPI WPI)
Once in 3 years Every year Every year Once in 2 years Every year Every year
Bidding Process
Financial capacity - Min. net worth Min. net worth Min. net worth Min. net worth Min. net worth
should be 25% should be 26%
should be 25% of should be 15% of should be 25% of
of of
project cost project cost project cost project cost project cost
More than Equivalent to
Technical Capacity - 100% More than 100% 100%
100% project
of project cost of project cost of project cost of project cost cost
Short listing 3 pre-qualified No cap on No cap on 7 pre-qualified No cap on No cap on
bidders are short listing short listing bidders are short listing short listing
shortlisted shortlisted
Source: Crisil, Angel Research
October 12, 2010 21