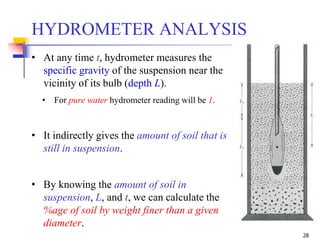
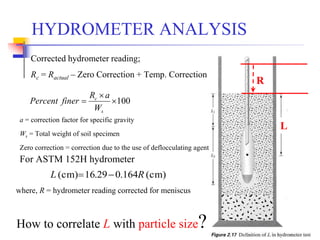
This document provides an overview of sieve analysis and grain size distribution in geotechnical engineering, including standard sieve sizes and procedures for both dry and wet sieving techniques. It details the calculation methods for cumulative percentages retained and passing through each sieve, as well as classifications of soil gradation. Additionally, it covers hydrometer analysis principles, including Stoke's Law and how to determine soil particle sizes in suspension.
![1
Geotechnical Engineering–I [CE-221]
BSc Civil Engineering – 4th Semester
by
Dr. Muhammad Irfan
Assistant Professor
Civil Engg. Dept. – UET Lahore
Email: mirfan1@msn.com
Lecture Handouts: https://groups.google.com/forum/#!forum/geotech-i
Lecture # 7
14-Feb-2017](https://image.slidesharecdn.com/7-180923180808/85/Geotechnical-Engineering-I-Lec-7-Sieve-Analysis-2-1-320.jpg)
![6
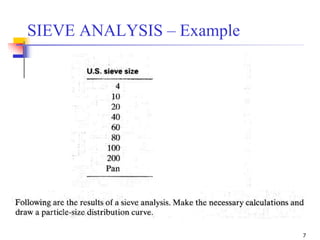
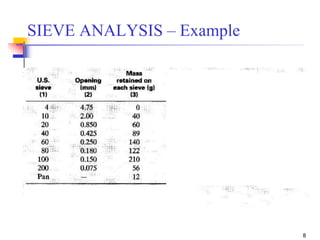
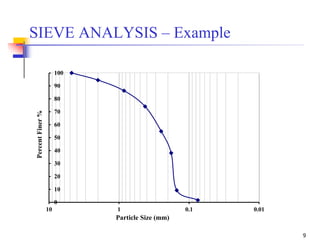
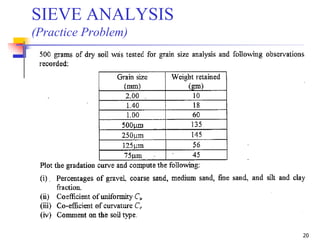
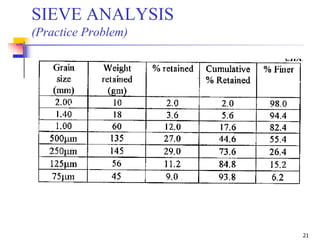
SIEVE ANALYSIS – Calculations
Sieve
No.
Diameter
(mm)
Wt. of soil
retained
(gm)
Cumulative
soil weight
retained on
each sieve
(gm)
Cumulative
percentage
retained (%)
Cumulative
percentage
passing (%)
(Col. 1) (Col. 2) (Col. 3) (Col. 4) (Col. 5) (Col. 6)
(Col. 4) = (Col. 3) + (Col. 4) of previous line
(Col. 5) = [(Col. 4)/Total wt.] x 100
(Col. 6) = 100 – (Col. 5)](https://image.slidesharecdn.com/7-180923180808/85/Geotechnical-Engineering-I-Lec-7-Sieve-Analysis-2-6-320.jpg)
![19
SIEVE ANALYSIS – Calculations
Sieve
No.
Diameter
(mm)
Wt. of soil
retained
(gm)
Cumulative
soil weight
retained on
each sieve
(gm)
Cumulative
percentage
retained (%)
Cumulative
percentage
passing (%)
(Col. 1) (Col. 2) (Col. 3) (Col. 4) (Col. 5) (Col. 6)
(Col. 4) = (Col. 3) + (Col. 4) of previous line
(Col. 5) = [(Col. 4)/Total wt.] x 100
(Col. 6) = 100 – (Col. 5)](https://image.slidesharecdn.com/7-180923180808/85/Geotechnical-Engineering-I-Lec-7-Sieve-Analysis-2-19-320.jpg)

![Geotechnical Engineering-I [Lec #13: Soil Compaction]](https://cdn.slidesharecdn.com/ss_thumbnails/13-180923184035-thumbnail.jpg?width=640&height=640&fit=bounds)
![Geotechnical Engineering-I [Lec #8: Hydrometer Analysis]](https://cdn.slidesharecdn.com/ss_thumbnails/8-180923180849-thumbnail.jpg?width=640&height=640&fit=bounds)

![Geotechnical Engineering-I [Lec #10: USCS]](https://cdn.slidesharecdn.com/ss_thumbnails/10-180923183613-thumbnail.jpg?width=640&height=640&fit=bounds)
![Geotechnical Engineering-I [Lec #11: USCS & AASHTO]](https://cdn.slidesharecdn.com/ss_thumbnails/11-180923183816-thumbnail.jpg?width=640&height=640&fit=bounds)
![Geotechnical Engineering-I [Lec #19: Consolidation-III]](https://cdn.slidesharecdn.com/ss_thumbnails/19-180924141035-thumbnail.jpg?width=640&height=640&fit=bounds)
![Geotechnical Engineering-I [Lec #12: AASHTO Soil Classification]](https://cdn.slidesharecdn.com/ss_thumbnails/12-180923183952-thumbnail.jpg?width=640&height=640&fit=bounds)


![Geotechnical Engineering-I [Lec #23: Soil Permeability]](https://cdn.slidesharecdn.com/ss_thumbnails/23-180924141141-thumbnail.jpg?width=640&height=640&fit=bounds)

![Geotechnical Engineering-I [Lec #9: Atterberg limits]](https://cdn.slidesharecdn.com/ss_thumbnails/9-180923180923-thumbnail.jpg?width=640&height=640&fit=bounds)
![Geotechnical Engineering-II [Lec #13: Elastic Settlements]](https://cdn.slidesharecdn.com/ss_thumbnails/13-181020124852-thumbnail.jpg?width=640&height=640&fit=bounds)
![Geotechnical Engineering-I [Lec #27: Flow Nets]](https://cdn.slidesharecdn.com/ss_thumbnails/27-180924141458-thumbnail.jpg?width=640&height=640&fit=bounds)

![Geotechnical Engineering-I [Lec #17: Consolidation]](https://cdn.slidesharecdn.com/ss_thumbnails/17-180924140731-thumbnail.jpg?width=640&height=640&fit=bounds)
![Geotechnical Engineering-II [Lec #11: Settlement Computation]](https://cdn.slidesharecdn.com/ss_thumbnails/11-181020124840-thumbnail.jpg?width=640&height=640&fit=bounds)

![Geotechnical Engineering-I [Lec #21: Consolidation Problems]](https://cdn.slidesharecdn.com/ss_thumbnails/21-180924141121-thumbnail.jpg?width=640&height=640&fit=bounds)


![Geotechnical Engineering-II [Lec #27: Infinite Slope Stability Analysis]](https://cdn.slidesharecdn.com/ss_thumbnails/27-181125070251-thumbnail.jpg?width=640&height=640&fit=bounds)


![Geotechnical Engineering-I [Lec #6: Sieve Analysis]](https://cdn.slidesharecdn.com/ss_thumbnails/6-180923180330-thumbnail.jpg?width=640&height=640&fit=bounds)


![Geotechnical Engineering-II [Lec #26: Slope Stability]](https://cdn.slidesharecdn.com/ss_thumbnails/26-181125070353-thumbnail.jpg?width=640&height=640&fit=bounds)
![Geotechnical Engineering-II [Lec #5: Triaxial Compression Test]](https://cdn.slidesharecdn.com/ss_thumbnails/5-180930132716-thumbnail.jpg?width=640&height=640&fit=bounds)
![Geotechnical Engineering-II [Lec #28: Finite Slope Stability Analysis]](https://cdn.slidesharecdn.com/ss_thumbnails/28-181125070402-thumbnail.jpg?width=640&height=640&fit=bounds)
![Geotechnical Engineering-II [Lec #18: Terzaghi Bearing Capacity Equation]](https://cdn.slidesharecdn.com/ss_thumbnails/18-181123045854-thumbnail.jpg?width=640&height=640&fit=bounds)
![Geotechnical Engineering-II [Lec #6: Stress Distribution in Soil]](https://cdn.slidesharecdn.com/ss_thumbnails/6-180930132732-thumbnail.jpg?width=640&height=640&fit=bounds)
![Geotechnical Engineering-II [Lec #23: Rankine Earth Pressure Theory]](https://cdn.slidesharecdn.com/ss_thumbnails/23-181123050516-thumbnail.jpg?width=640&height=640&fit=bounds)
![Geotechnical Engineering-II [Lec #7A: Boussinesq Method]](https://cdn.slidesharecdn.com/ss_thumbnails/7a-181020124807-thumbnail.jpg?width=640&height=640&fit=bounds)
![Geotechnical Engineering-II [Lec #12: Consolidation Settlement Computation]](https://cdn.slidesharecdn.com/ss_thumbnails/12-181020124845-thumbnail.jpg?width=640&height=640&fit=bounds)
![Geotechnical Engineering-II [Lec #19: General Bearing Capacity Equation]](https://cdn.slidesharecdn.com/ss_thumbnails/19-181123045917-thumbnail.jpg?width=640&height=640&fit=bounds)

![Geotechnical Engineering-II [Lec #7: Soil Stresses due to External Load]](https://cdn.slidesharecdn.com/ss_thumbnails/7-180930132739-thumbnail.jpg?width=640&height=640&fit=bounds)
![Geotechnical Engineering-II [Lec #17: Bearing Capacity of Soil]](https://cdn.slidesharecdn.com/ss_thumbnails/17-181123045836-thumbnail.jpg?width=640&height=640&fit=bounds)

![Geotechnical Engineering-II [Lec #9+10: Westergaard Theory]](https://cdn.slidesharecdn.com/ss_thumbnails/9-181020124827-thumbnail.jpg?width=640&height=640&fit=bounds)
![Geotechnical Engineering-II [Lec #15 & 16: Schmertmann Method]](https://cdn.slidesharecdn.com/ss_thumbnails/15-181020124920-thumbnail.jpg?width=640&height=640&fit=bounds)
![Geotechnical Engineering-II [Lec #24: Coulomb EP Theory]](https://cdn.slidesharecdn.com/ss_thumbnails/24-181123050536-thumbnail.jpg?width=640&height=640&fit=bounds)
![Geotechnical Engineering-II [Lec #25: Coulomb EP Theory - Numericals]](https://cdn.slidesharecdn.com/ss_thumbnails/25-181123050611-thumbnail.jpg?width=640&height=640&fit=bounds)
![Geotechnical Engineering-II [Lec #14: Timoshenko & Goodier Method]](https://cdn.slidesharecdn.com/ss_thumbnails/14-181020124917-thumbnail.jpg?width=640&height=640&fit=bounds)
![Geotechnical Engineering-II [Lec #22: Earth Pressure at Rest]](https://cdn.slidesharecdn.com/ss_thumbnails/22-181123050434-thumbnail.jpg?width=640&height=640&fit=bounds)
![Geotechnical Engineering-II [Lec #8: Boussinesq Method - Rectangular Areas]](https://cdn.slidesharecdn.com/ss_thumbnails/8-181020124822-thumbnail.jpg?width=640&height=640&fit=bounds)


