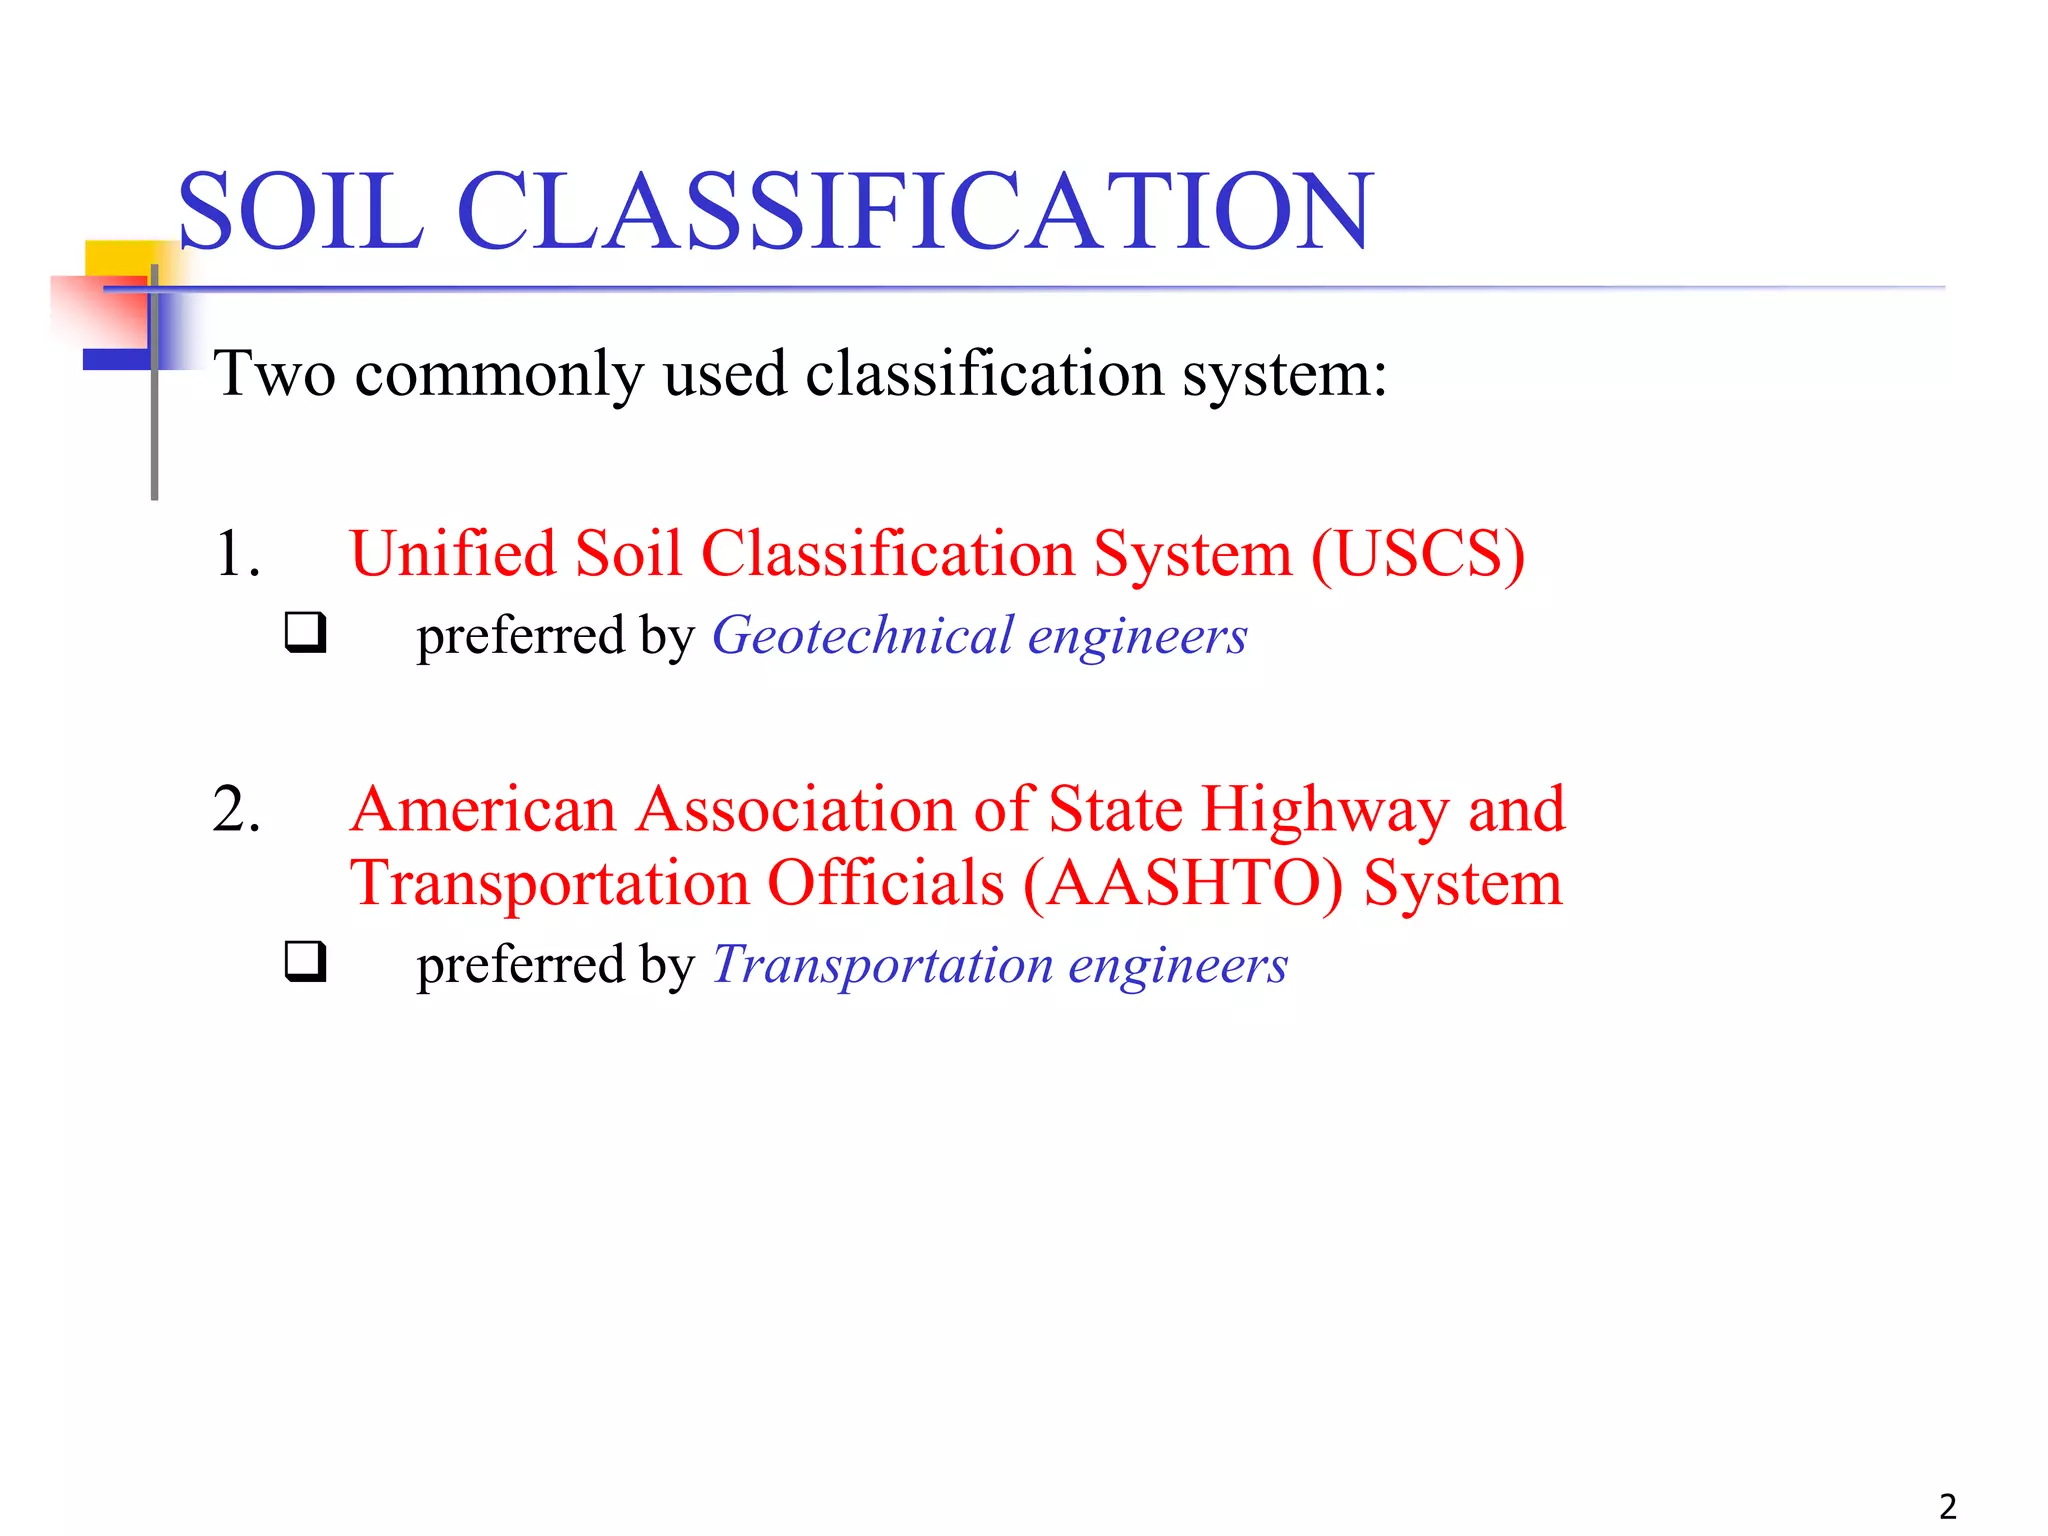
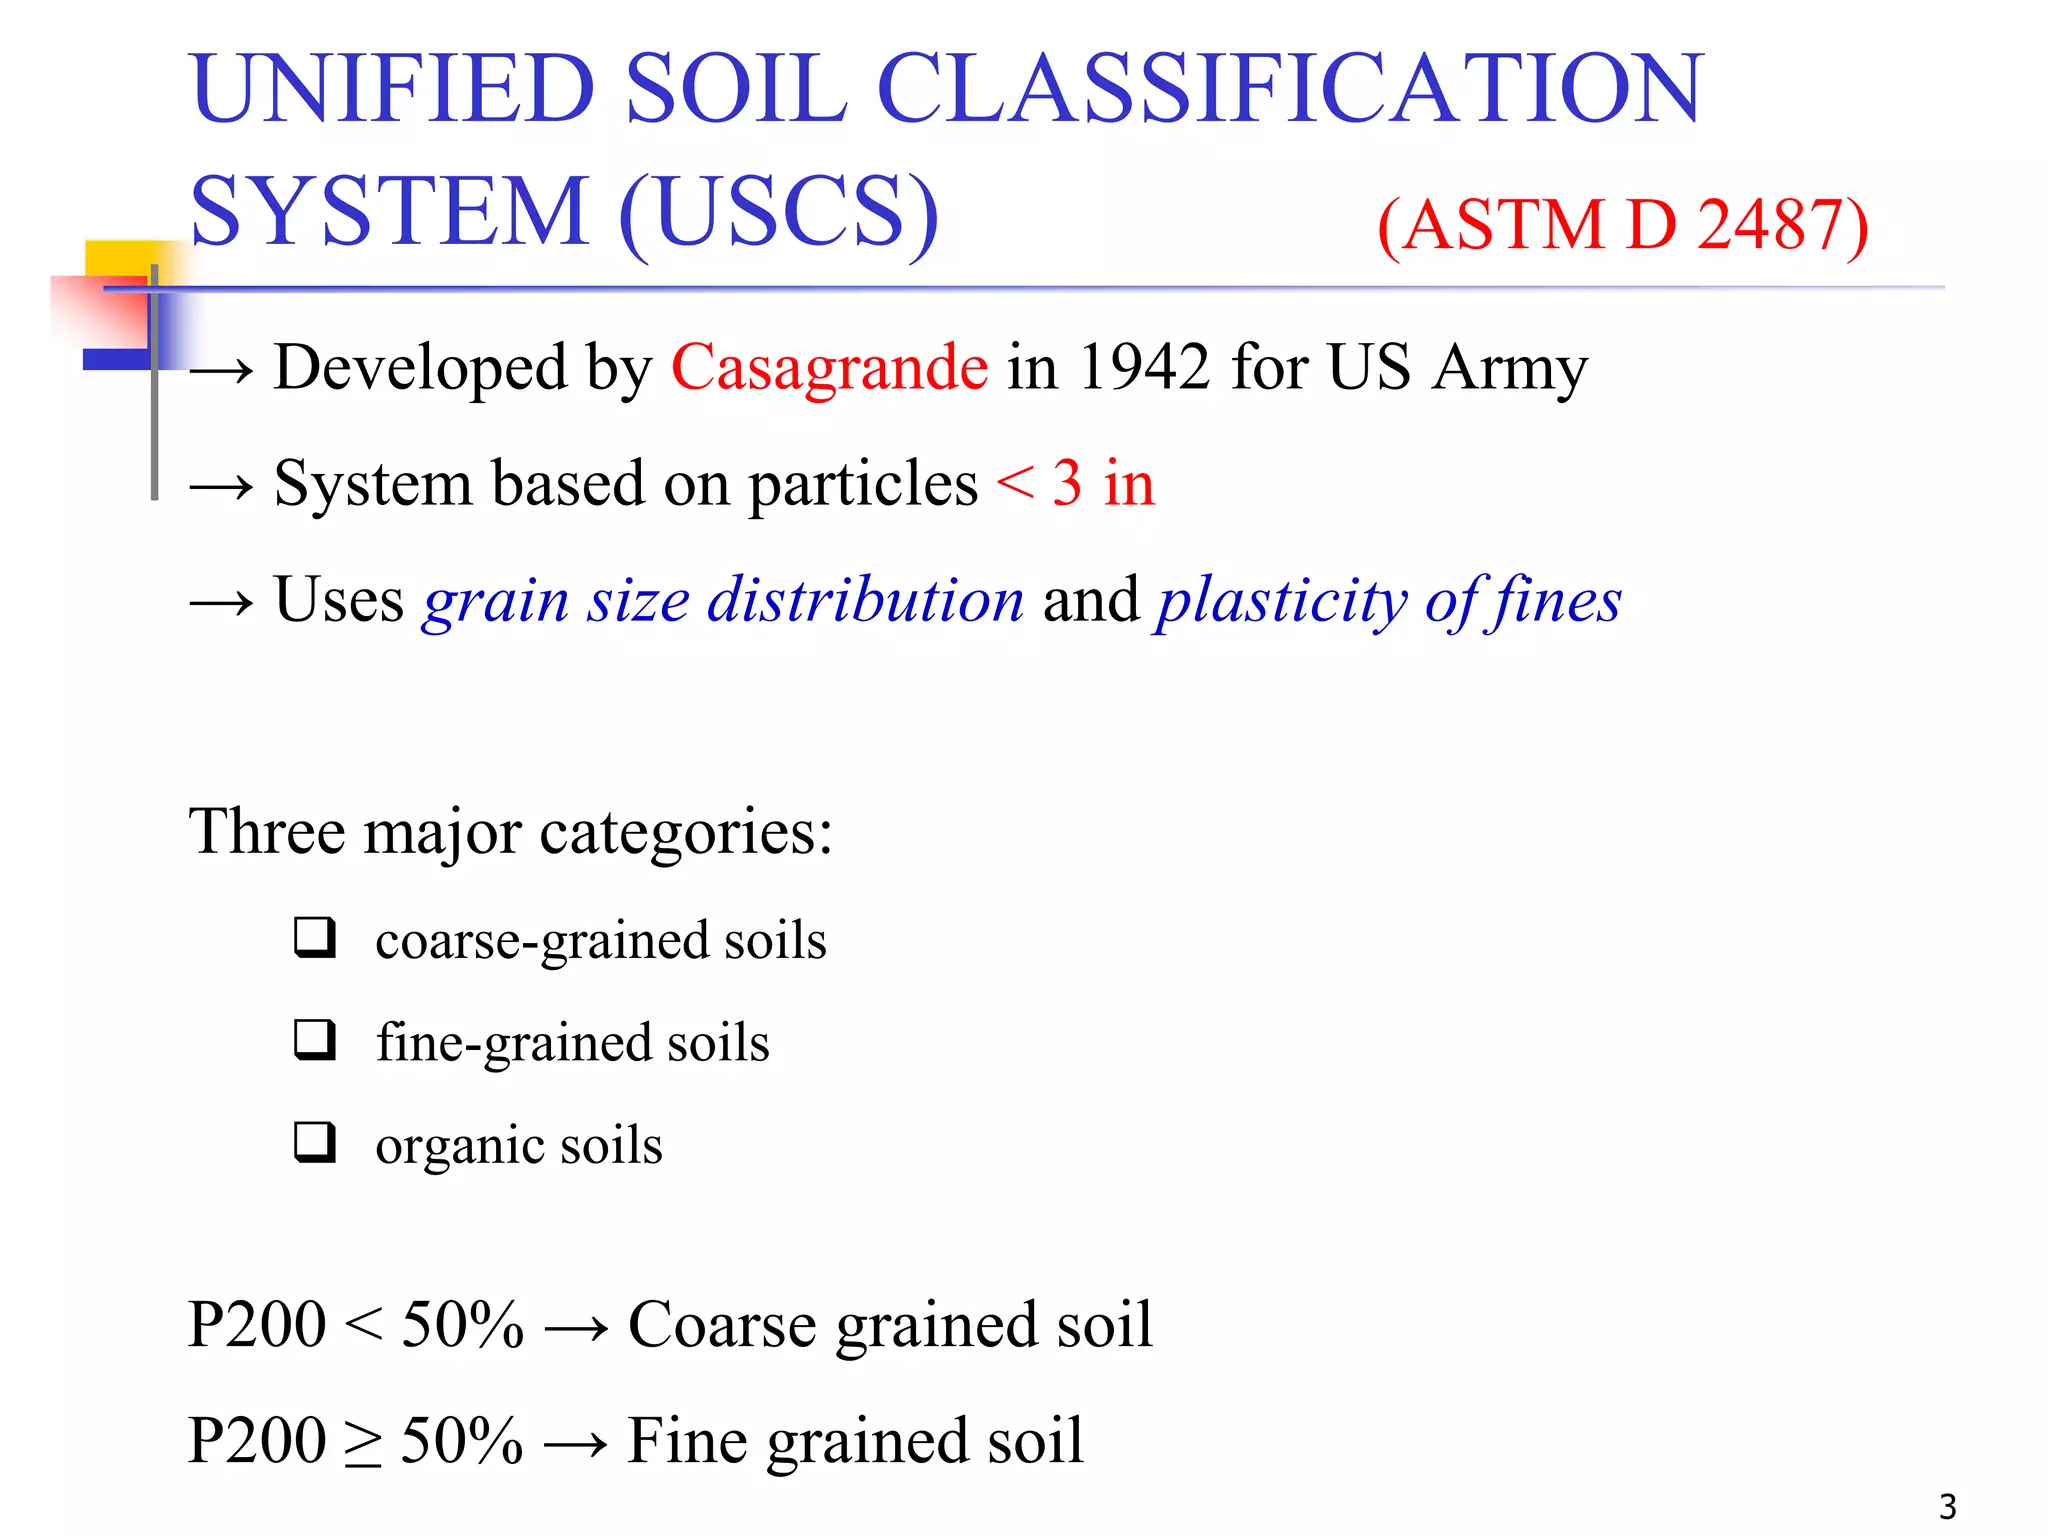
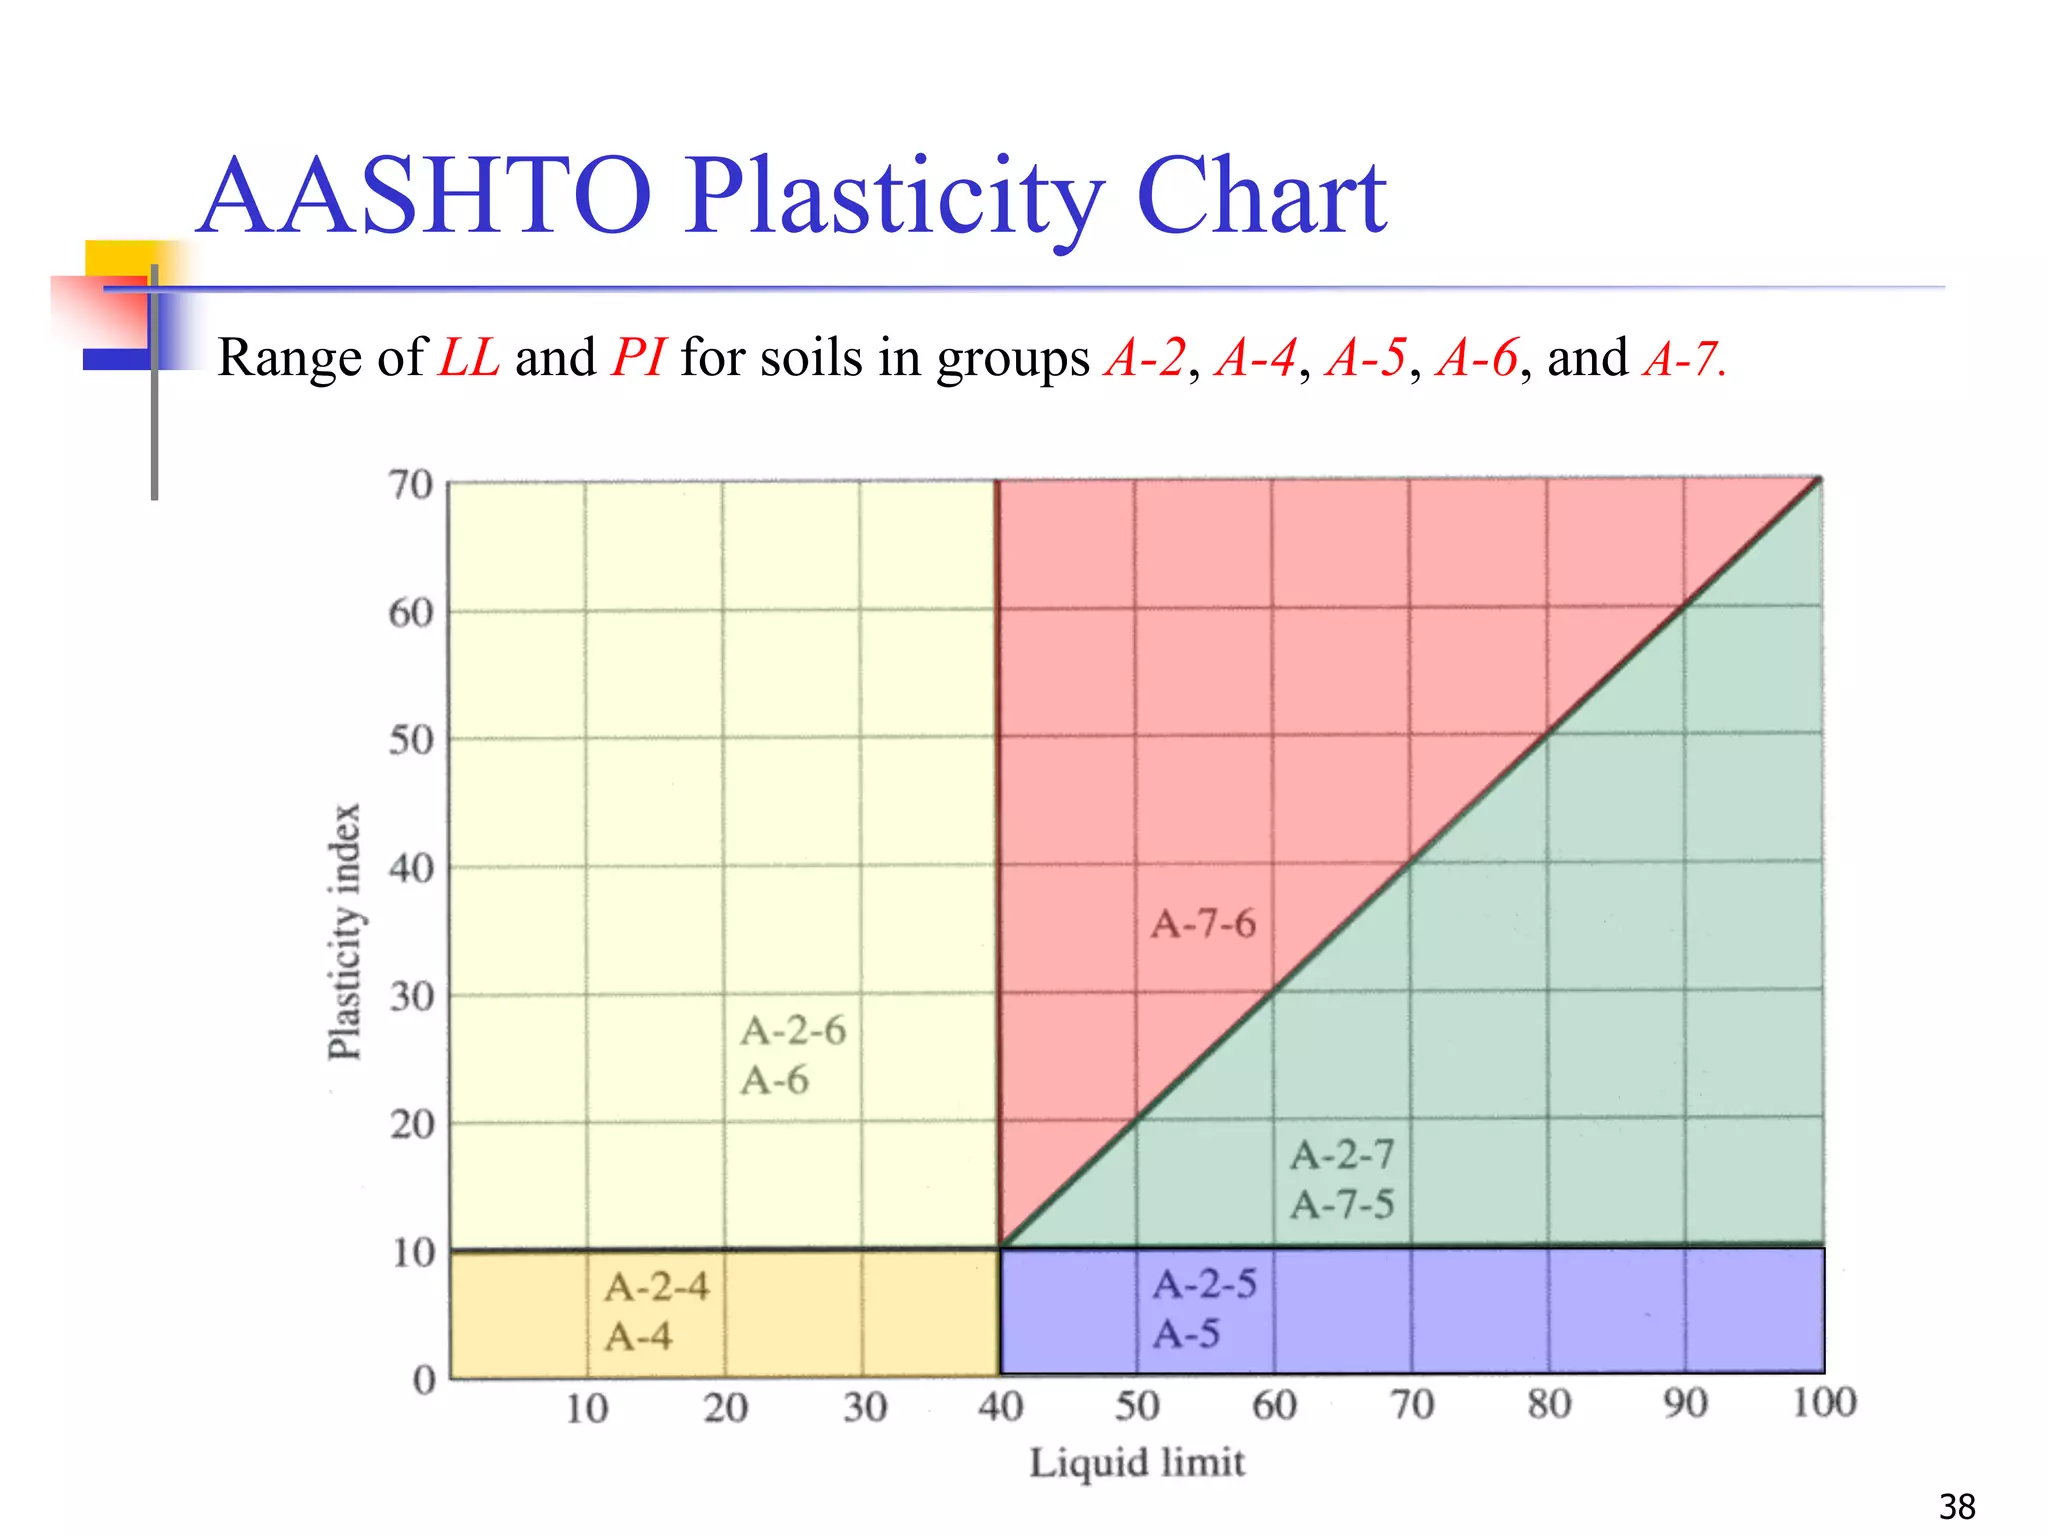
The document provides lecture notes on geotechnical engineering, focusing on two primary soil classification systems: the Unified Soil Classification System (USCS) and the AASHTO system. It details the categories of soils based on grain size and plasticity, along with flow charts and practice problems for classifying soils. The content emphasizes the importance of these systems in categorizing soils for engineering applications.
![1
Geotechnical Engineering–I [CE-221]
BSc Civil Engineering – 4th Semester
by
Dr. Muhammad Irfan
Assistant Professor
Civil Engg. Dept. – UET Lahore
Email: mirfan1@msn.com
Lecture Handouts: https://groups.google.com/d/forum/2016session-geotech-i
Lecture # 11
27-Feb-2018](https://image.slidesharecdn.com/11-180923183816/75/Geotechnical-Engineering-I-Lec-11-USCS-AASHTO-1-2048.jpg)
![24
24
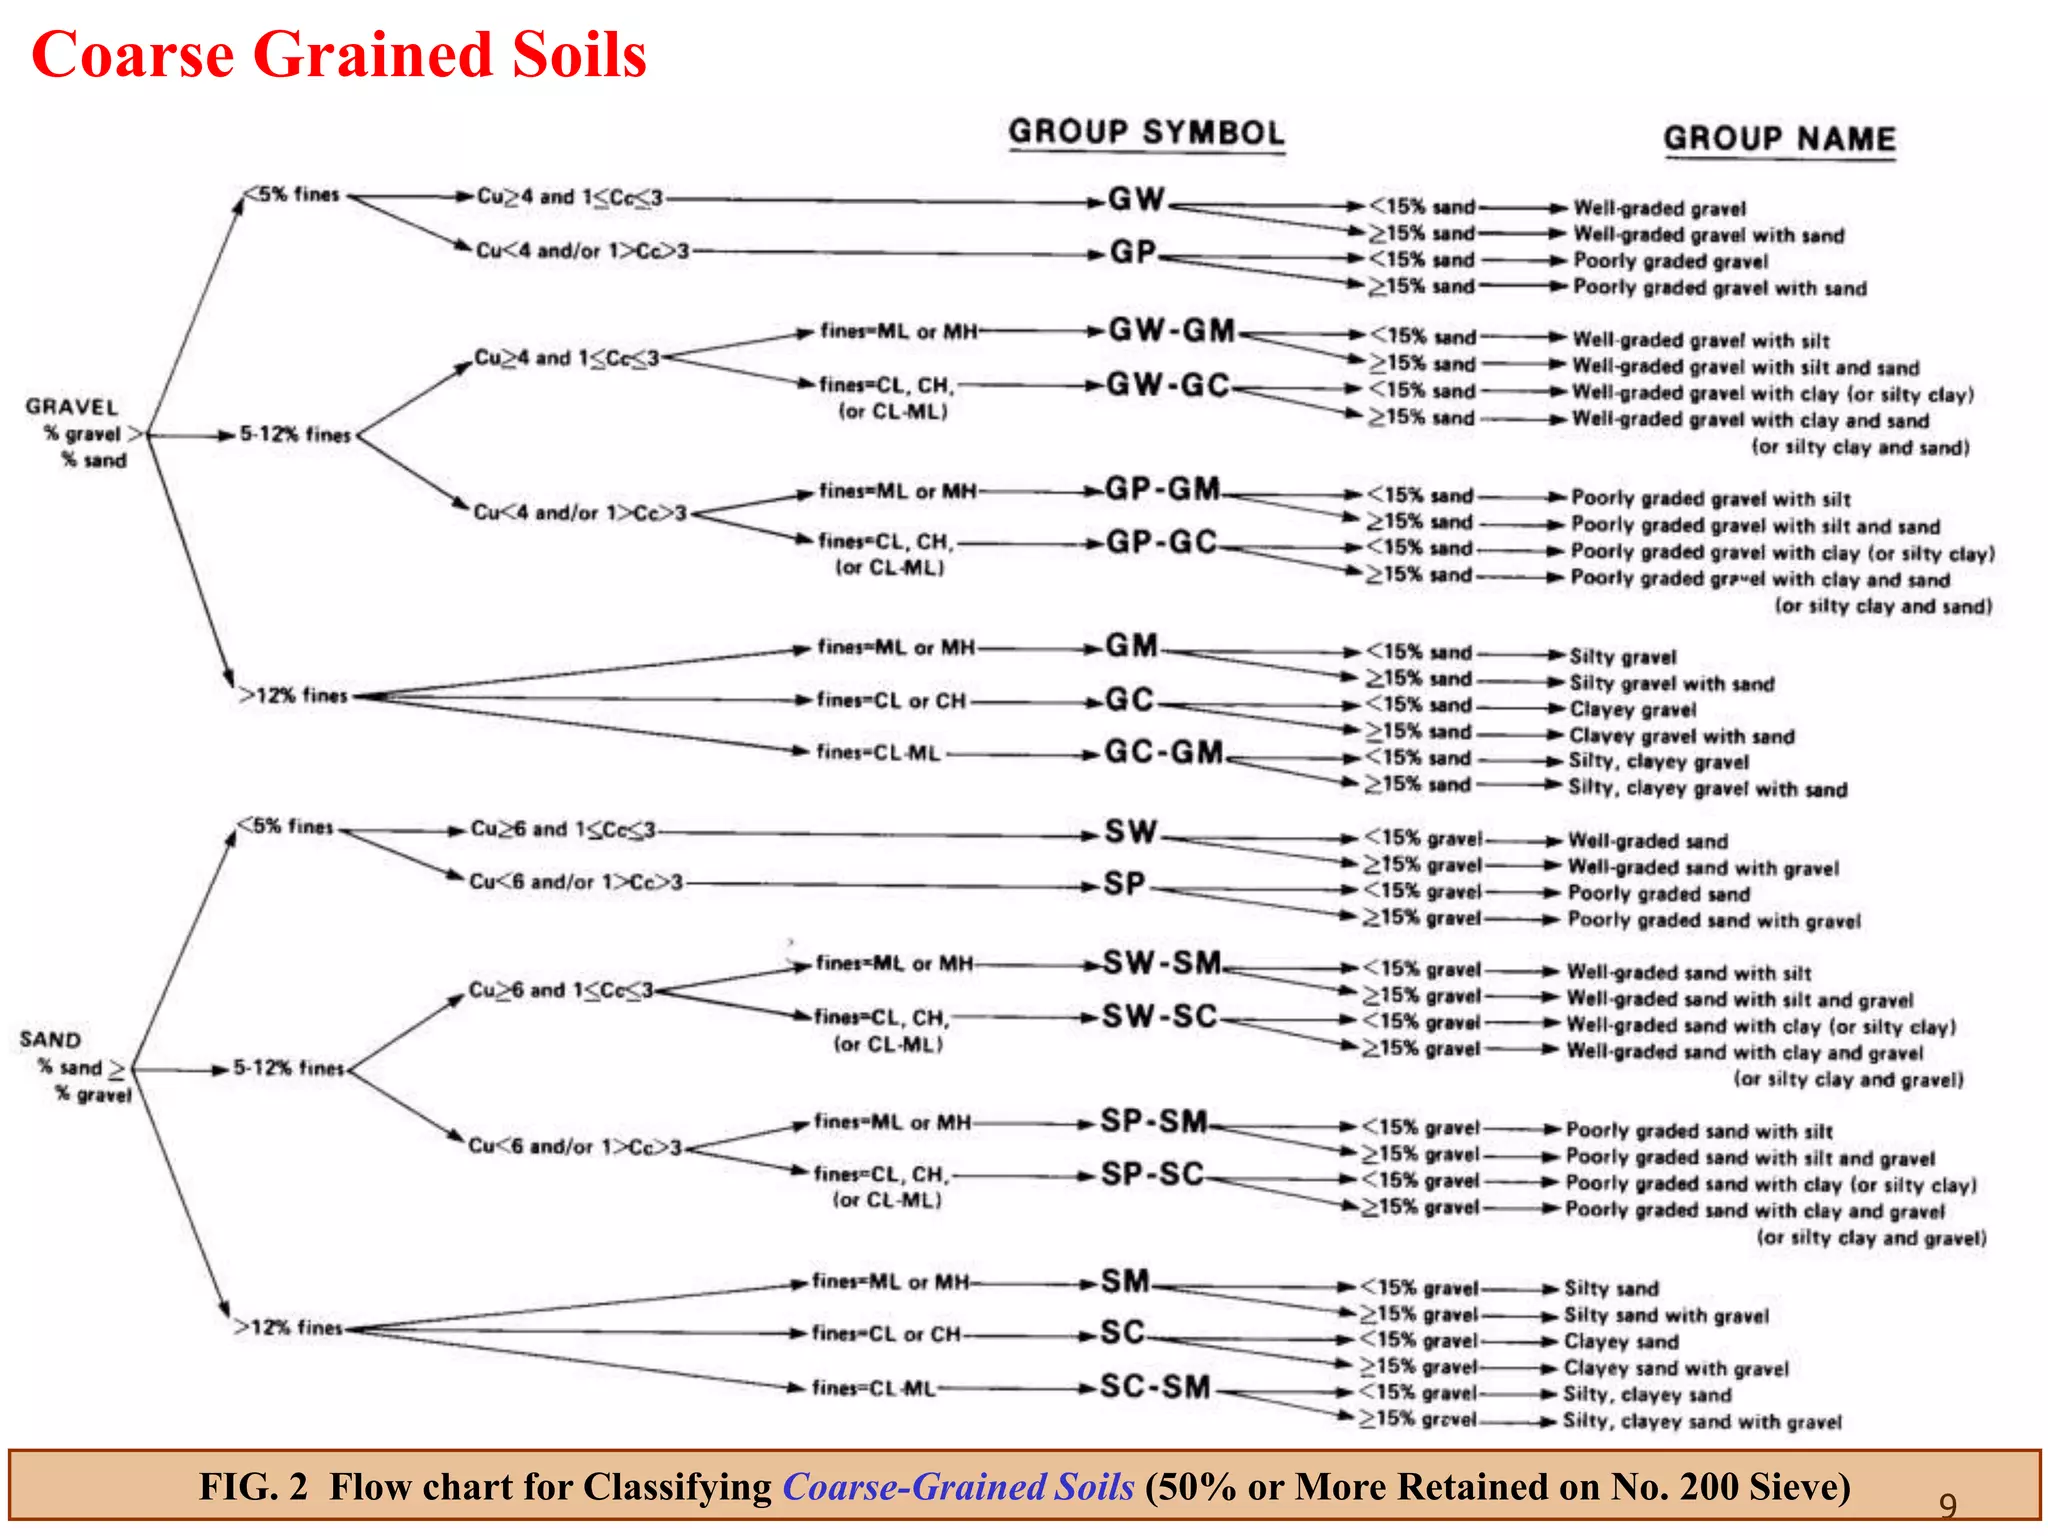
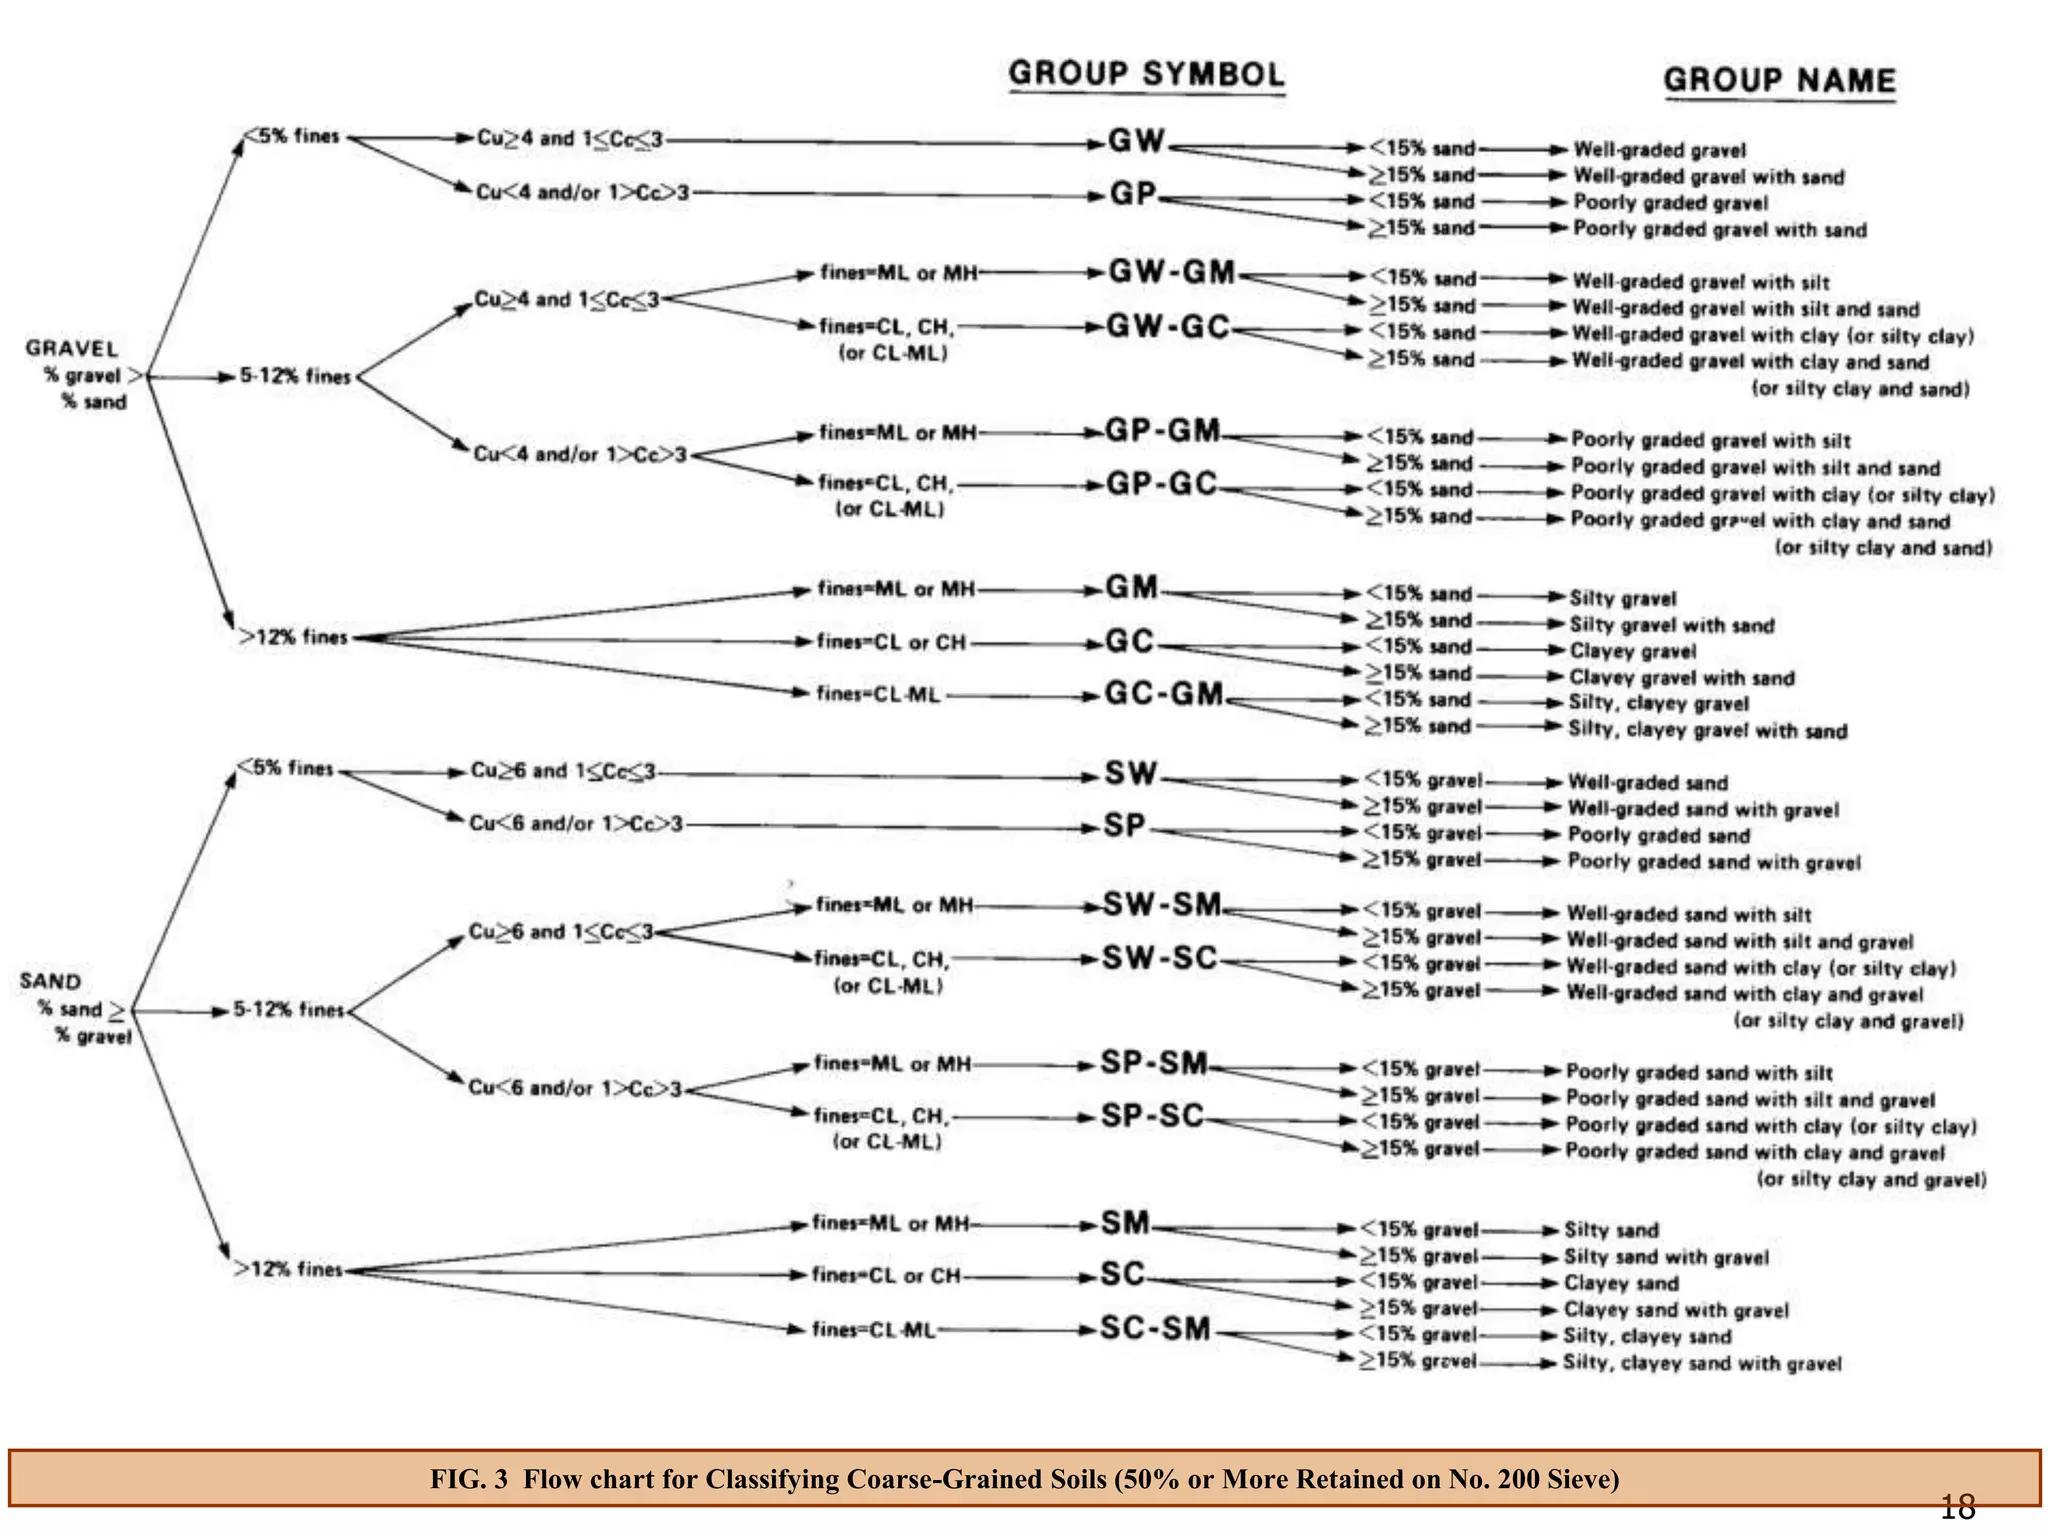
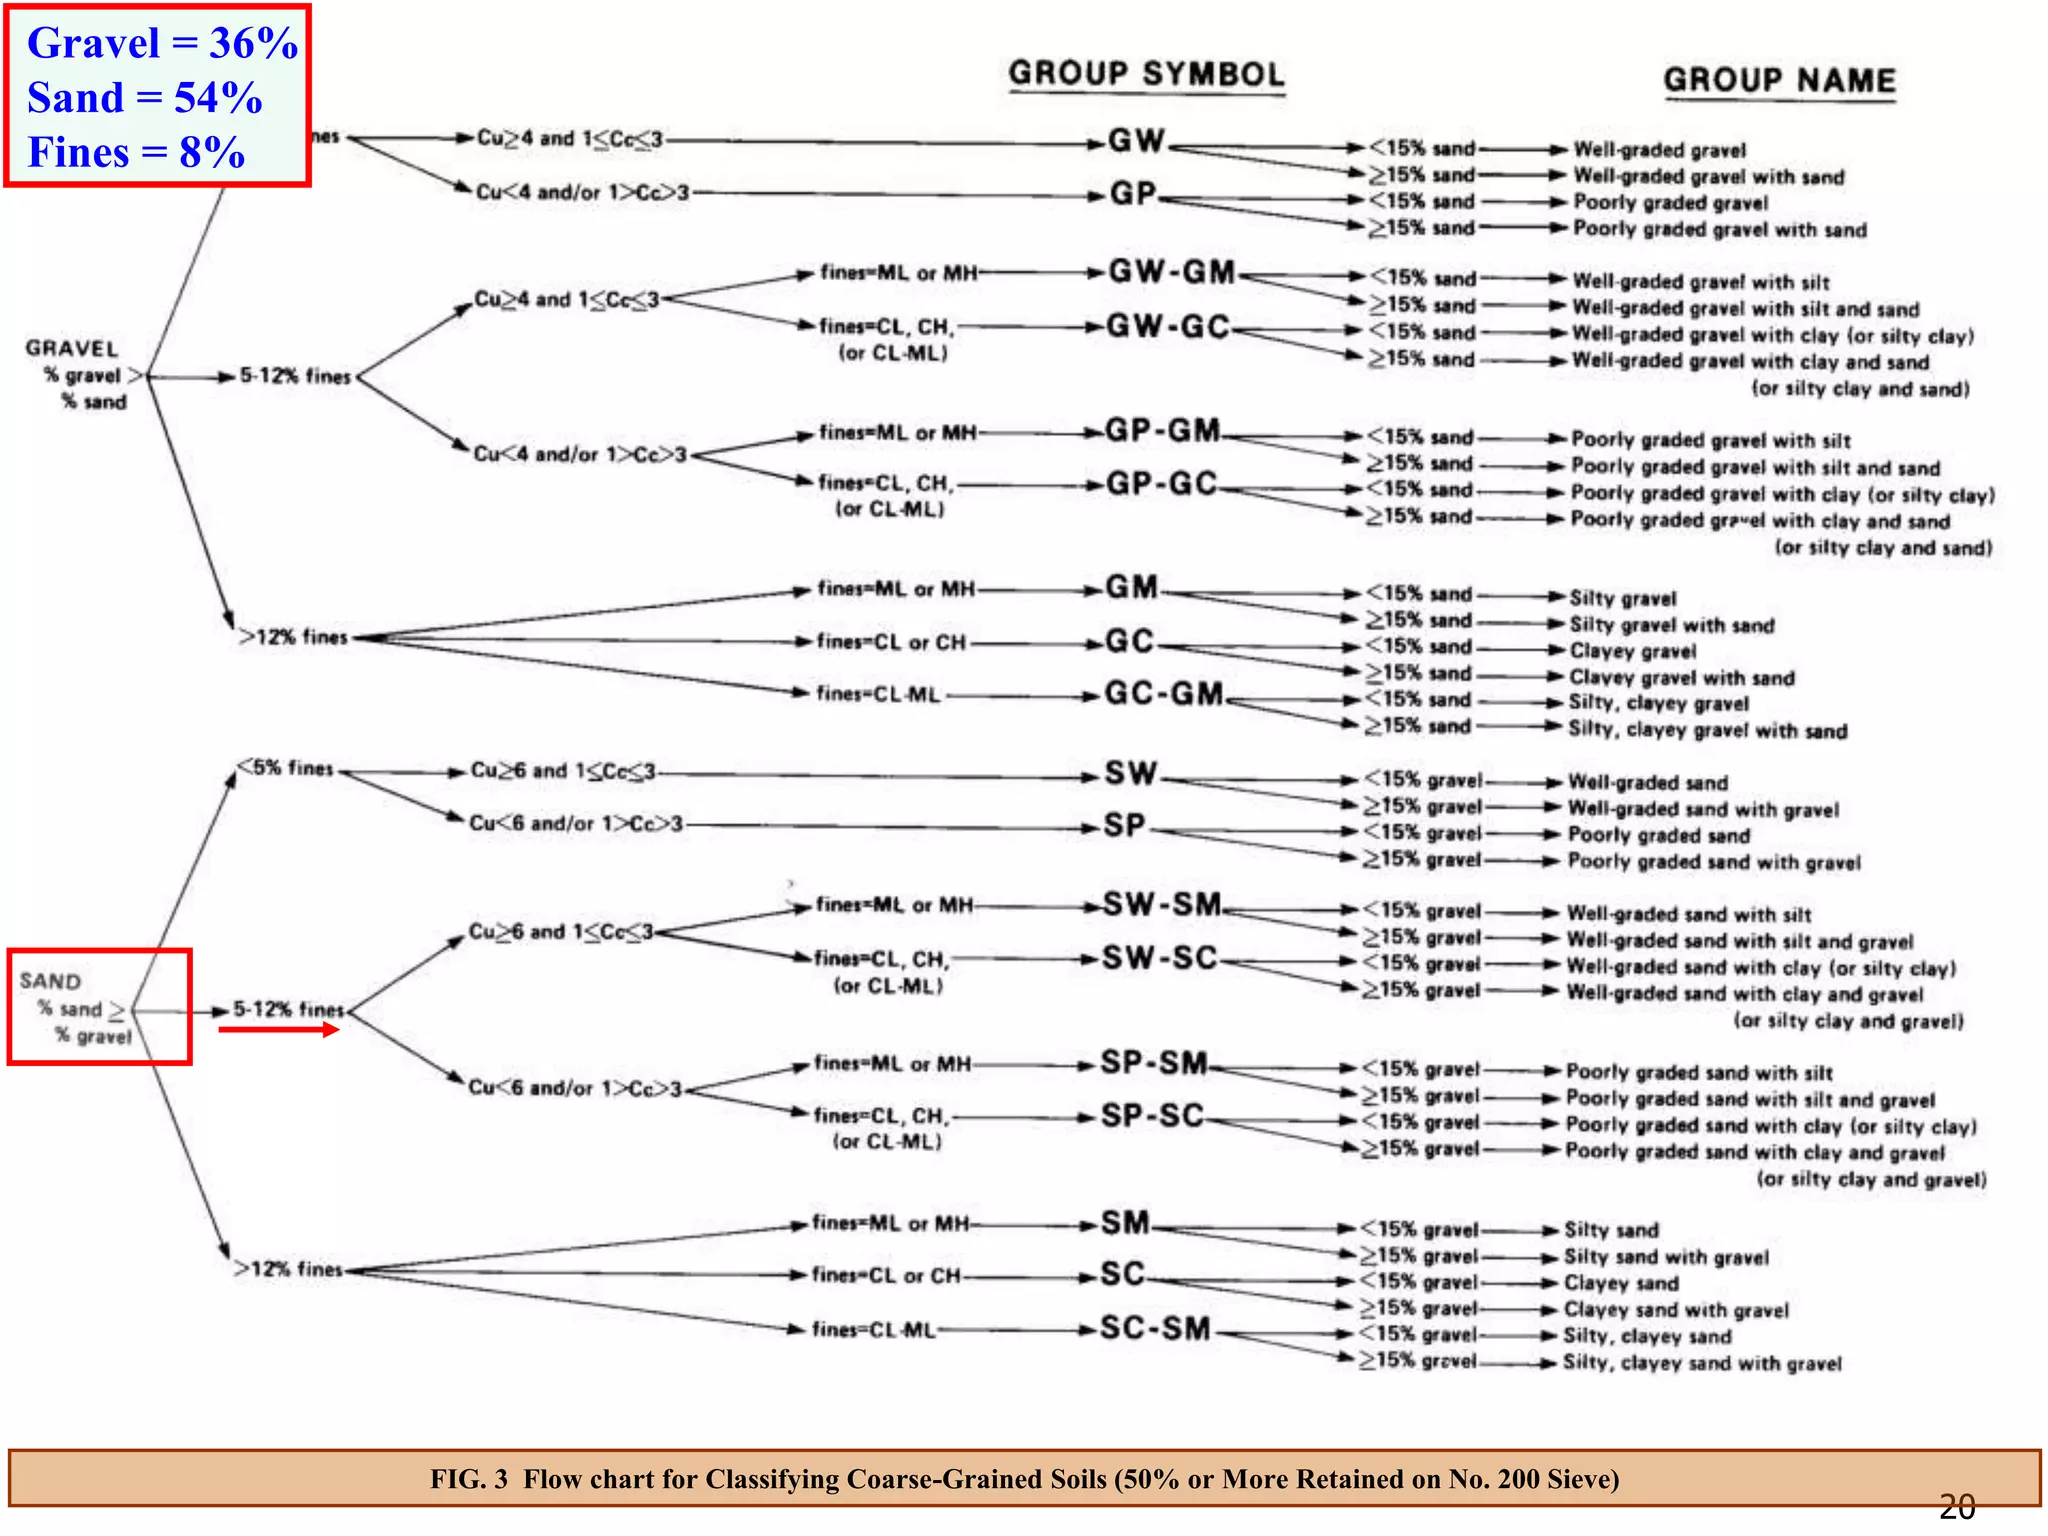
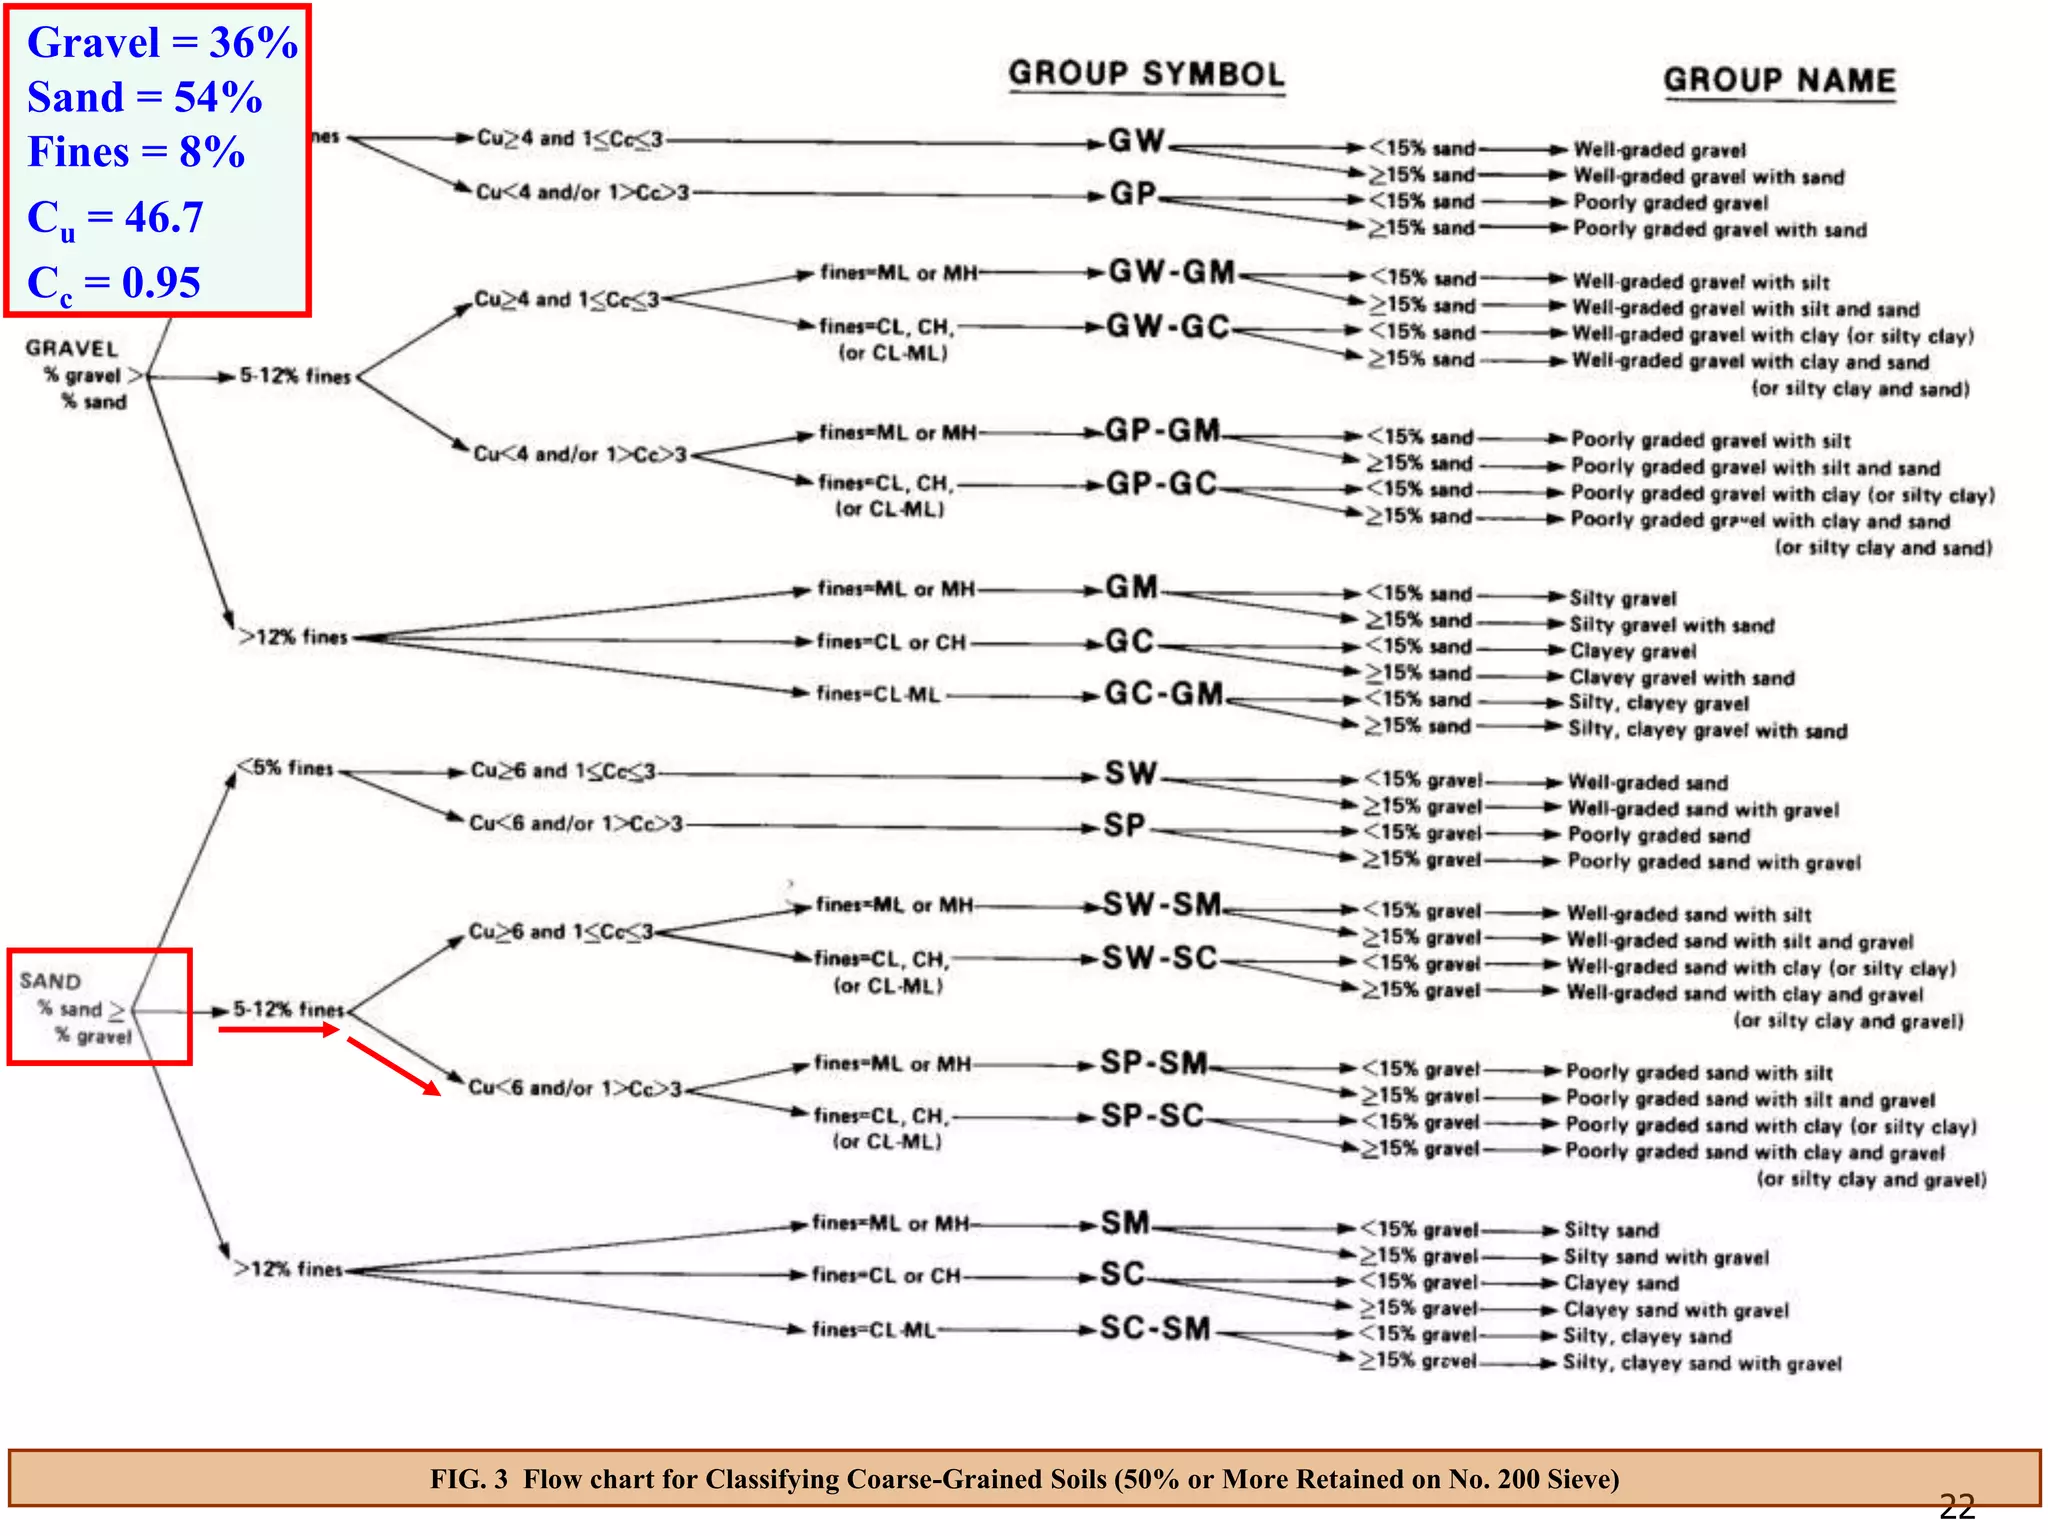
FIG. 3 Flow chart for Classifying Coarse-Grained Soils (50% or More Retained on No. 200 Sieve)
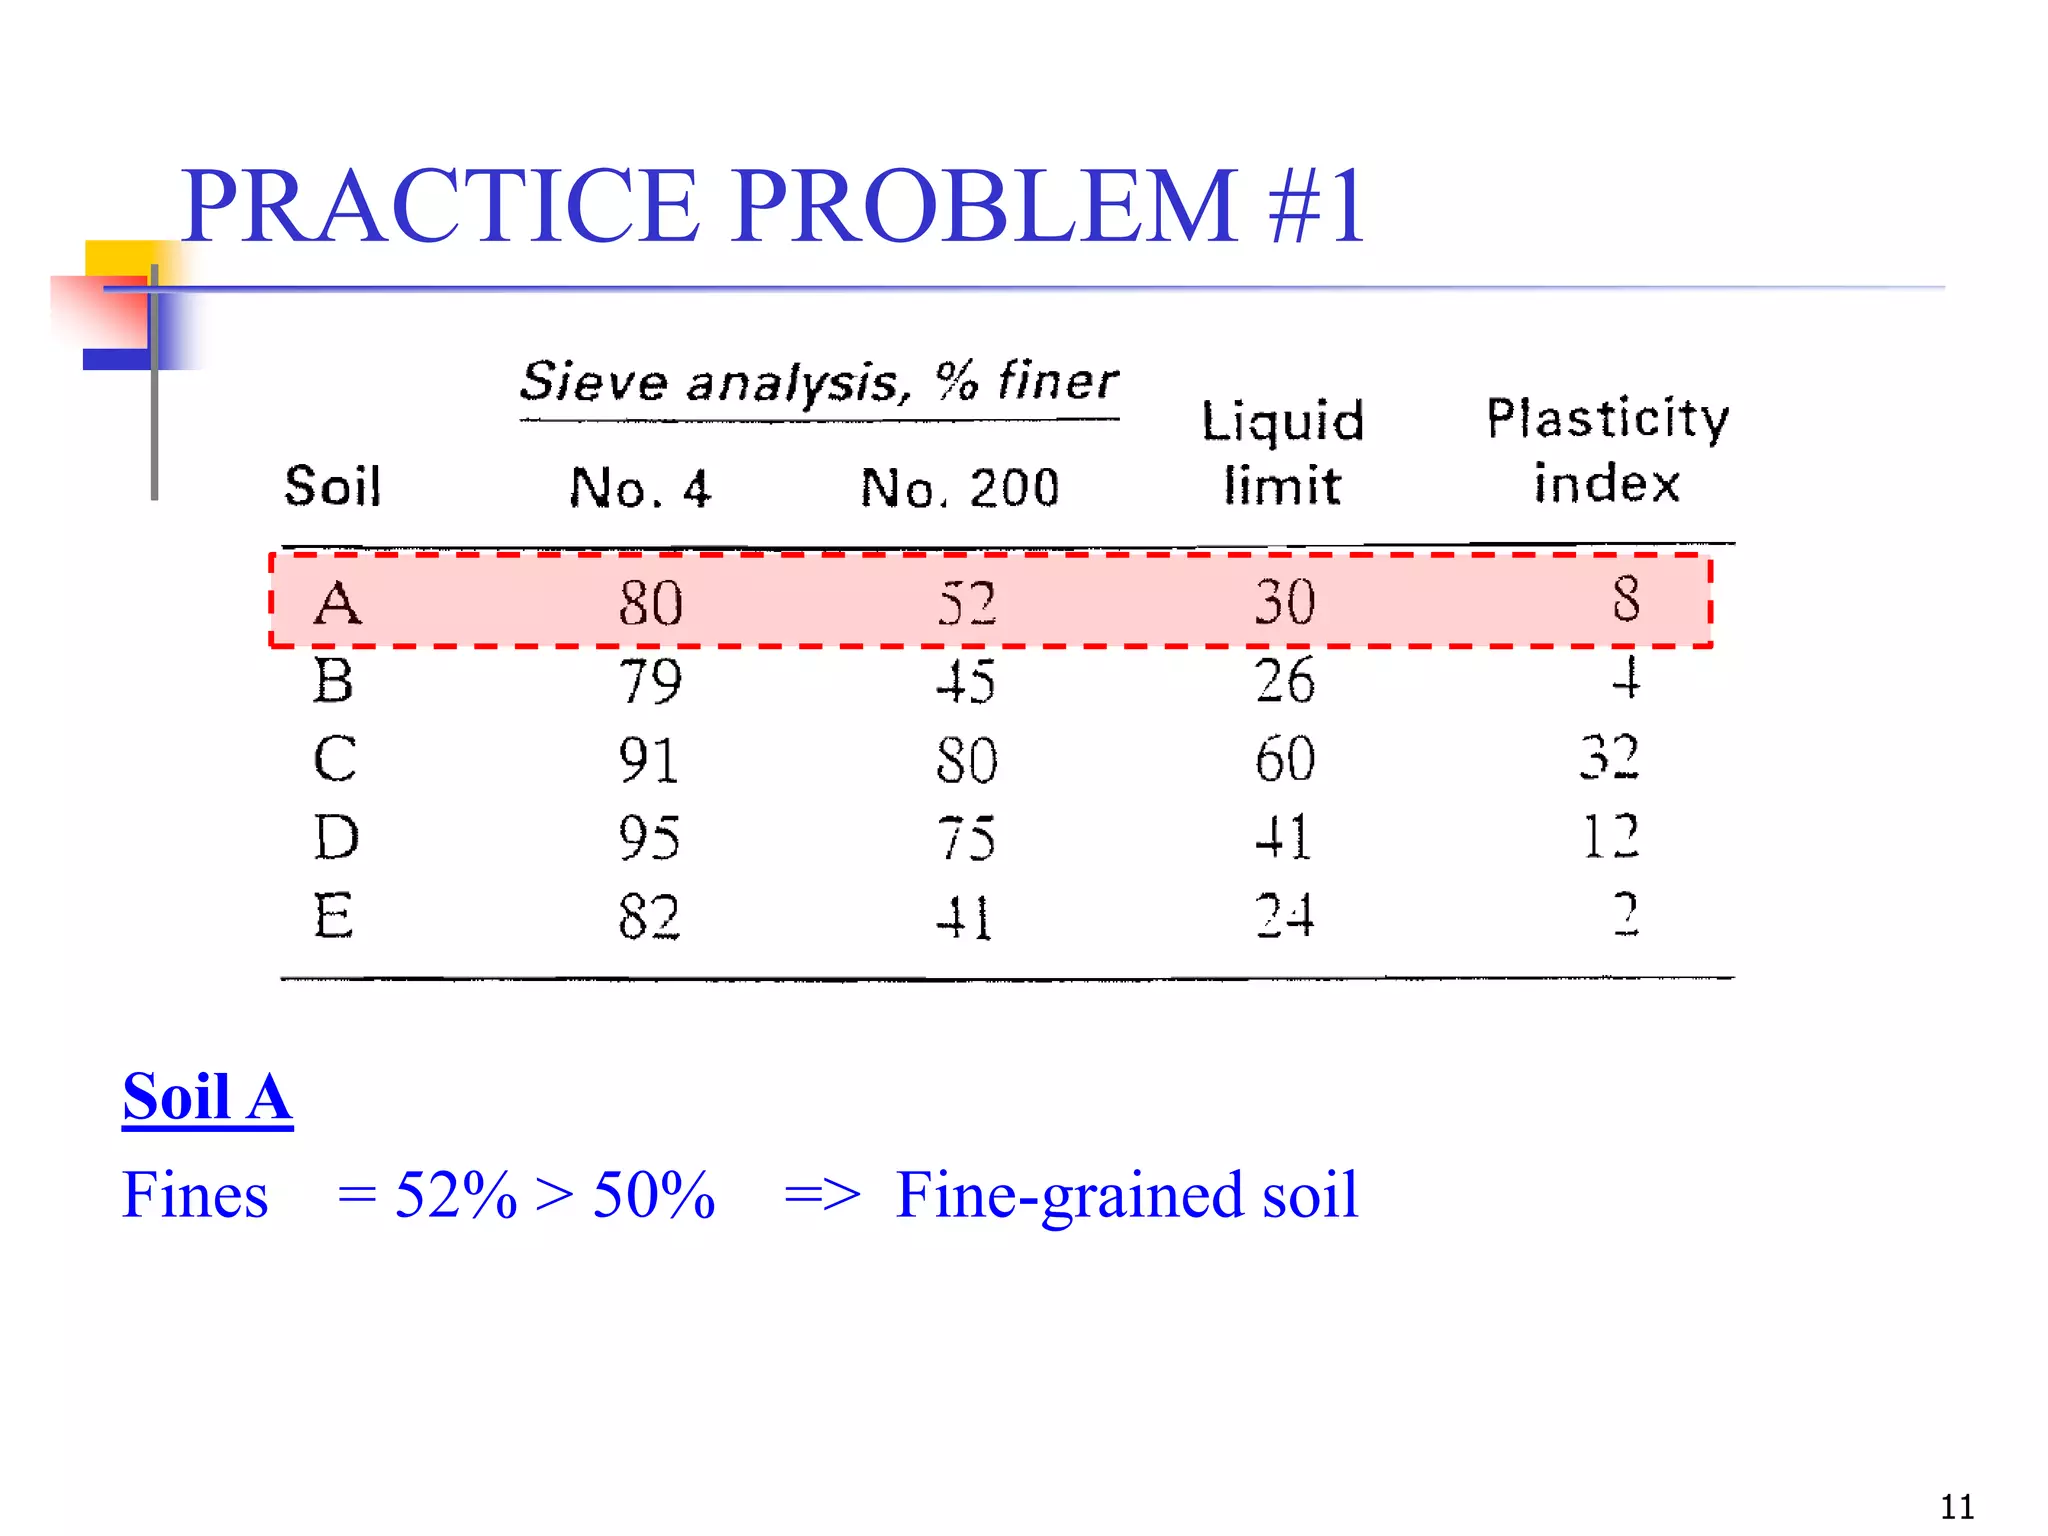
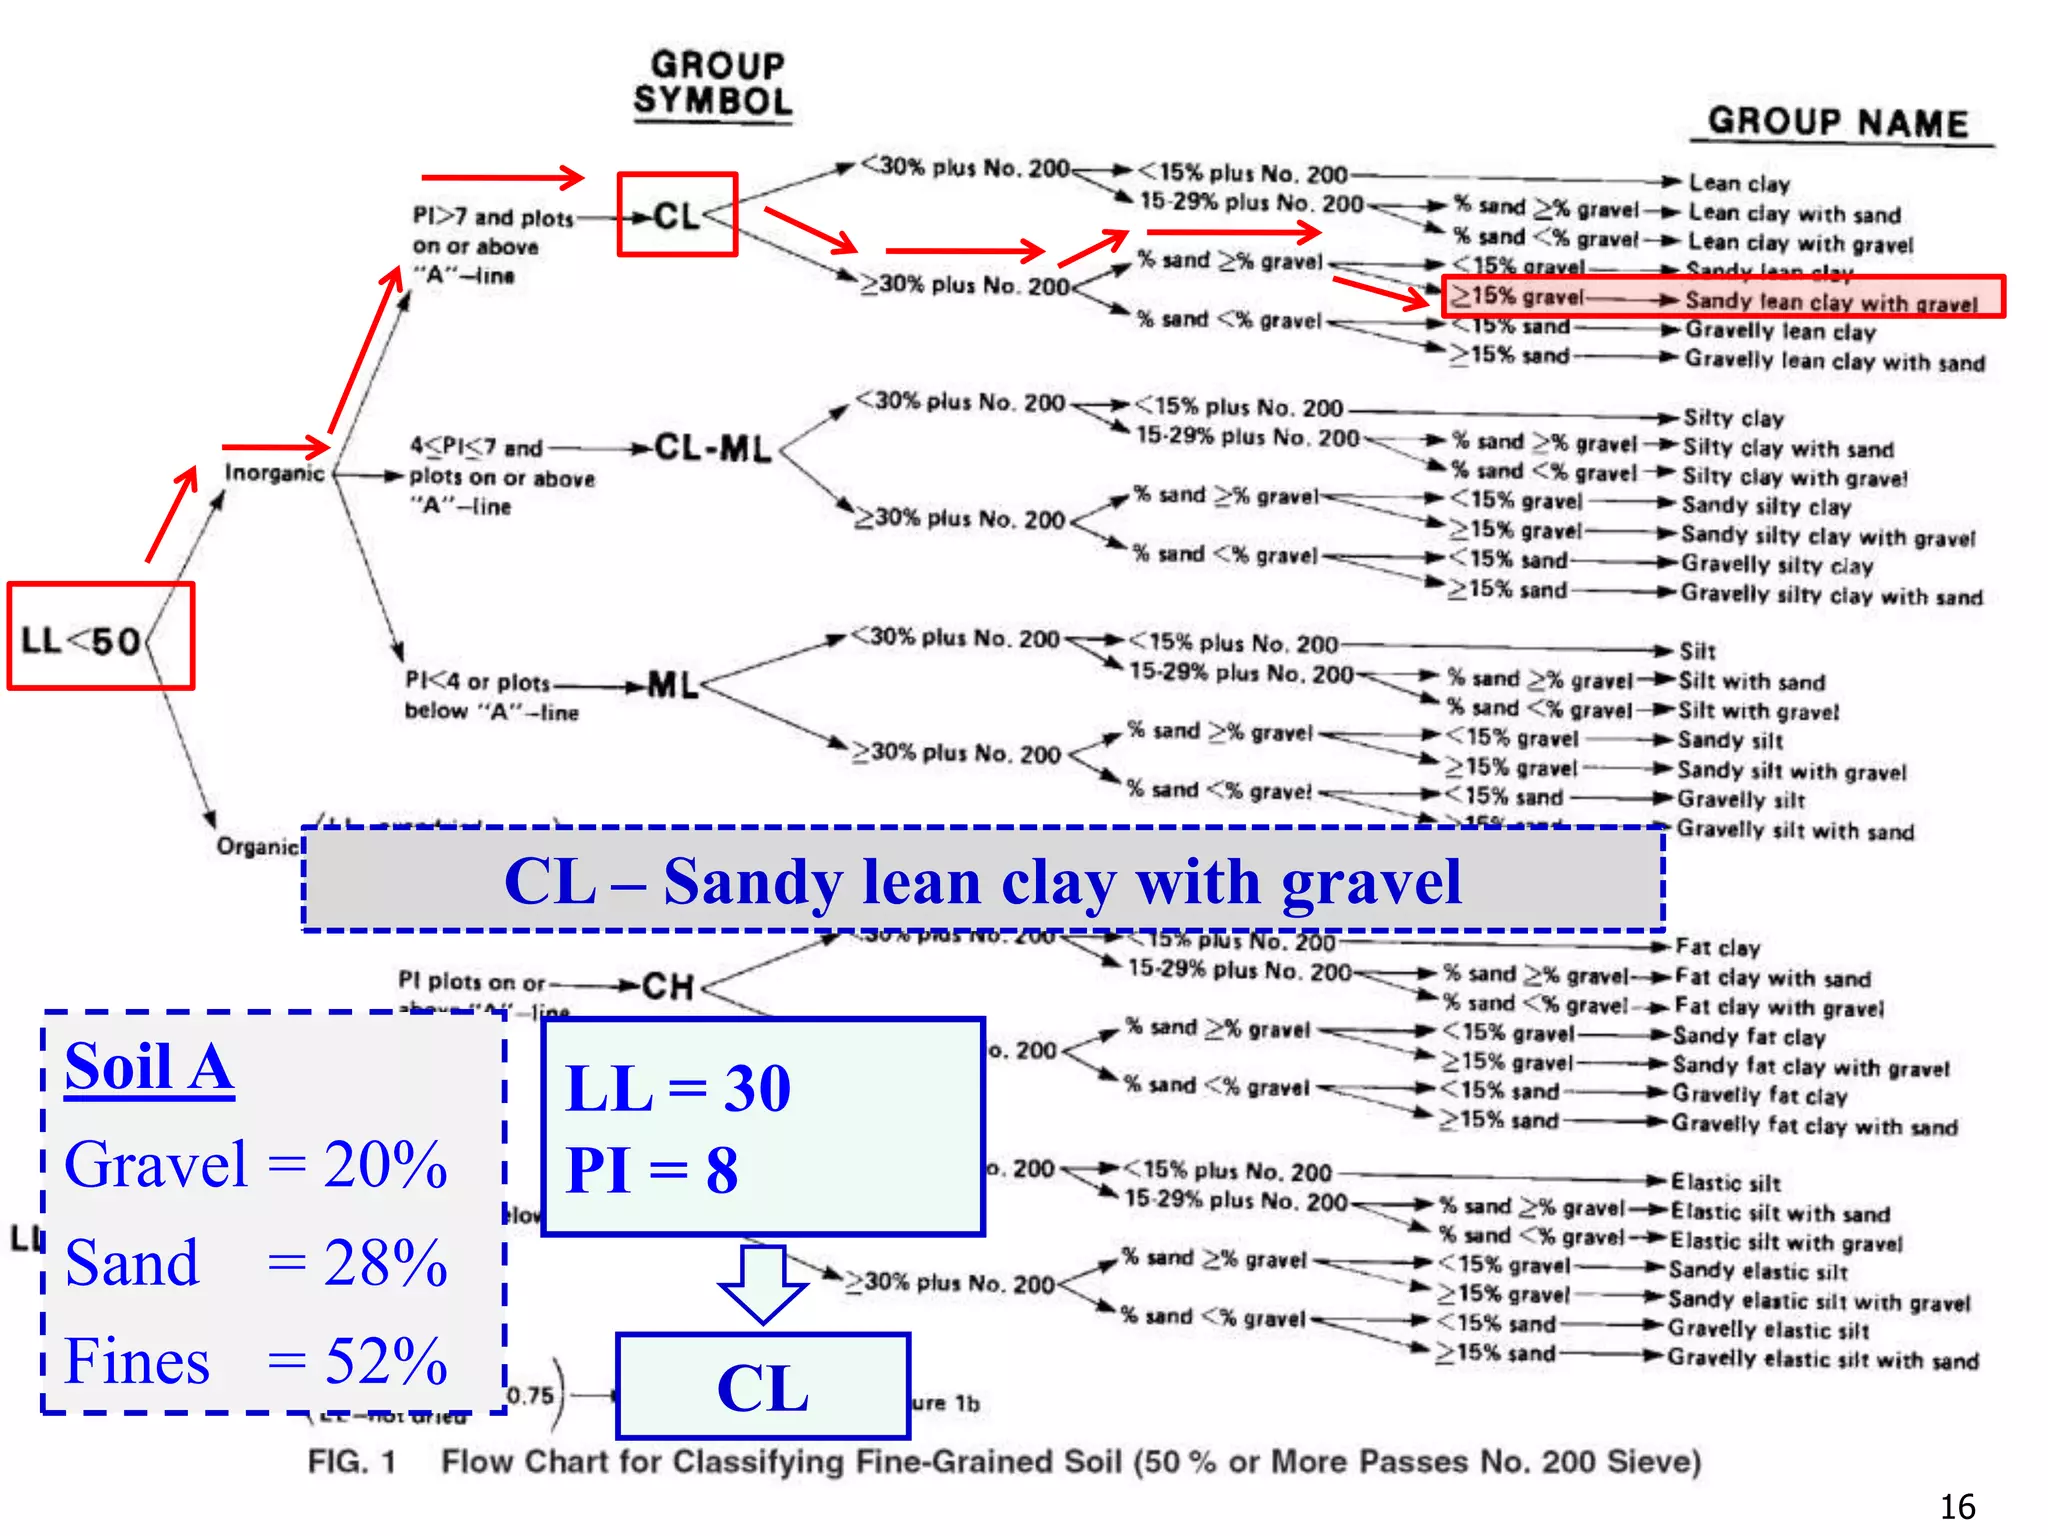
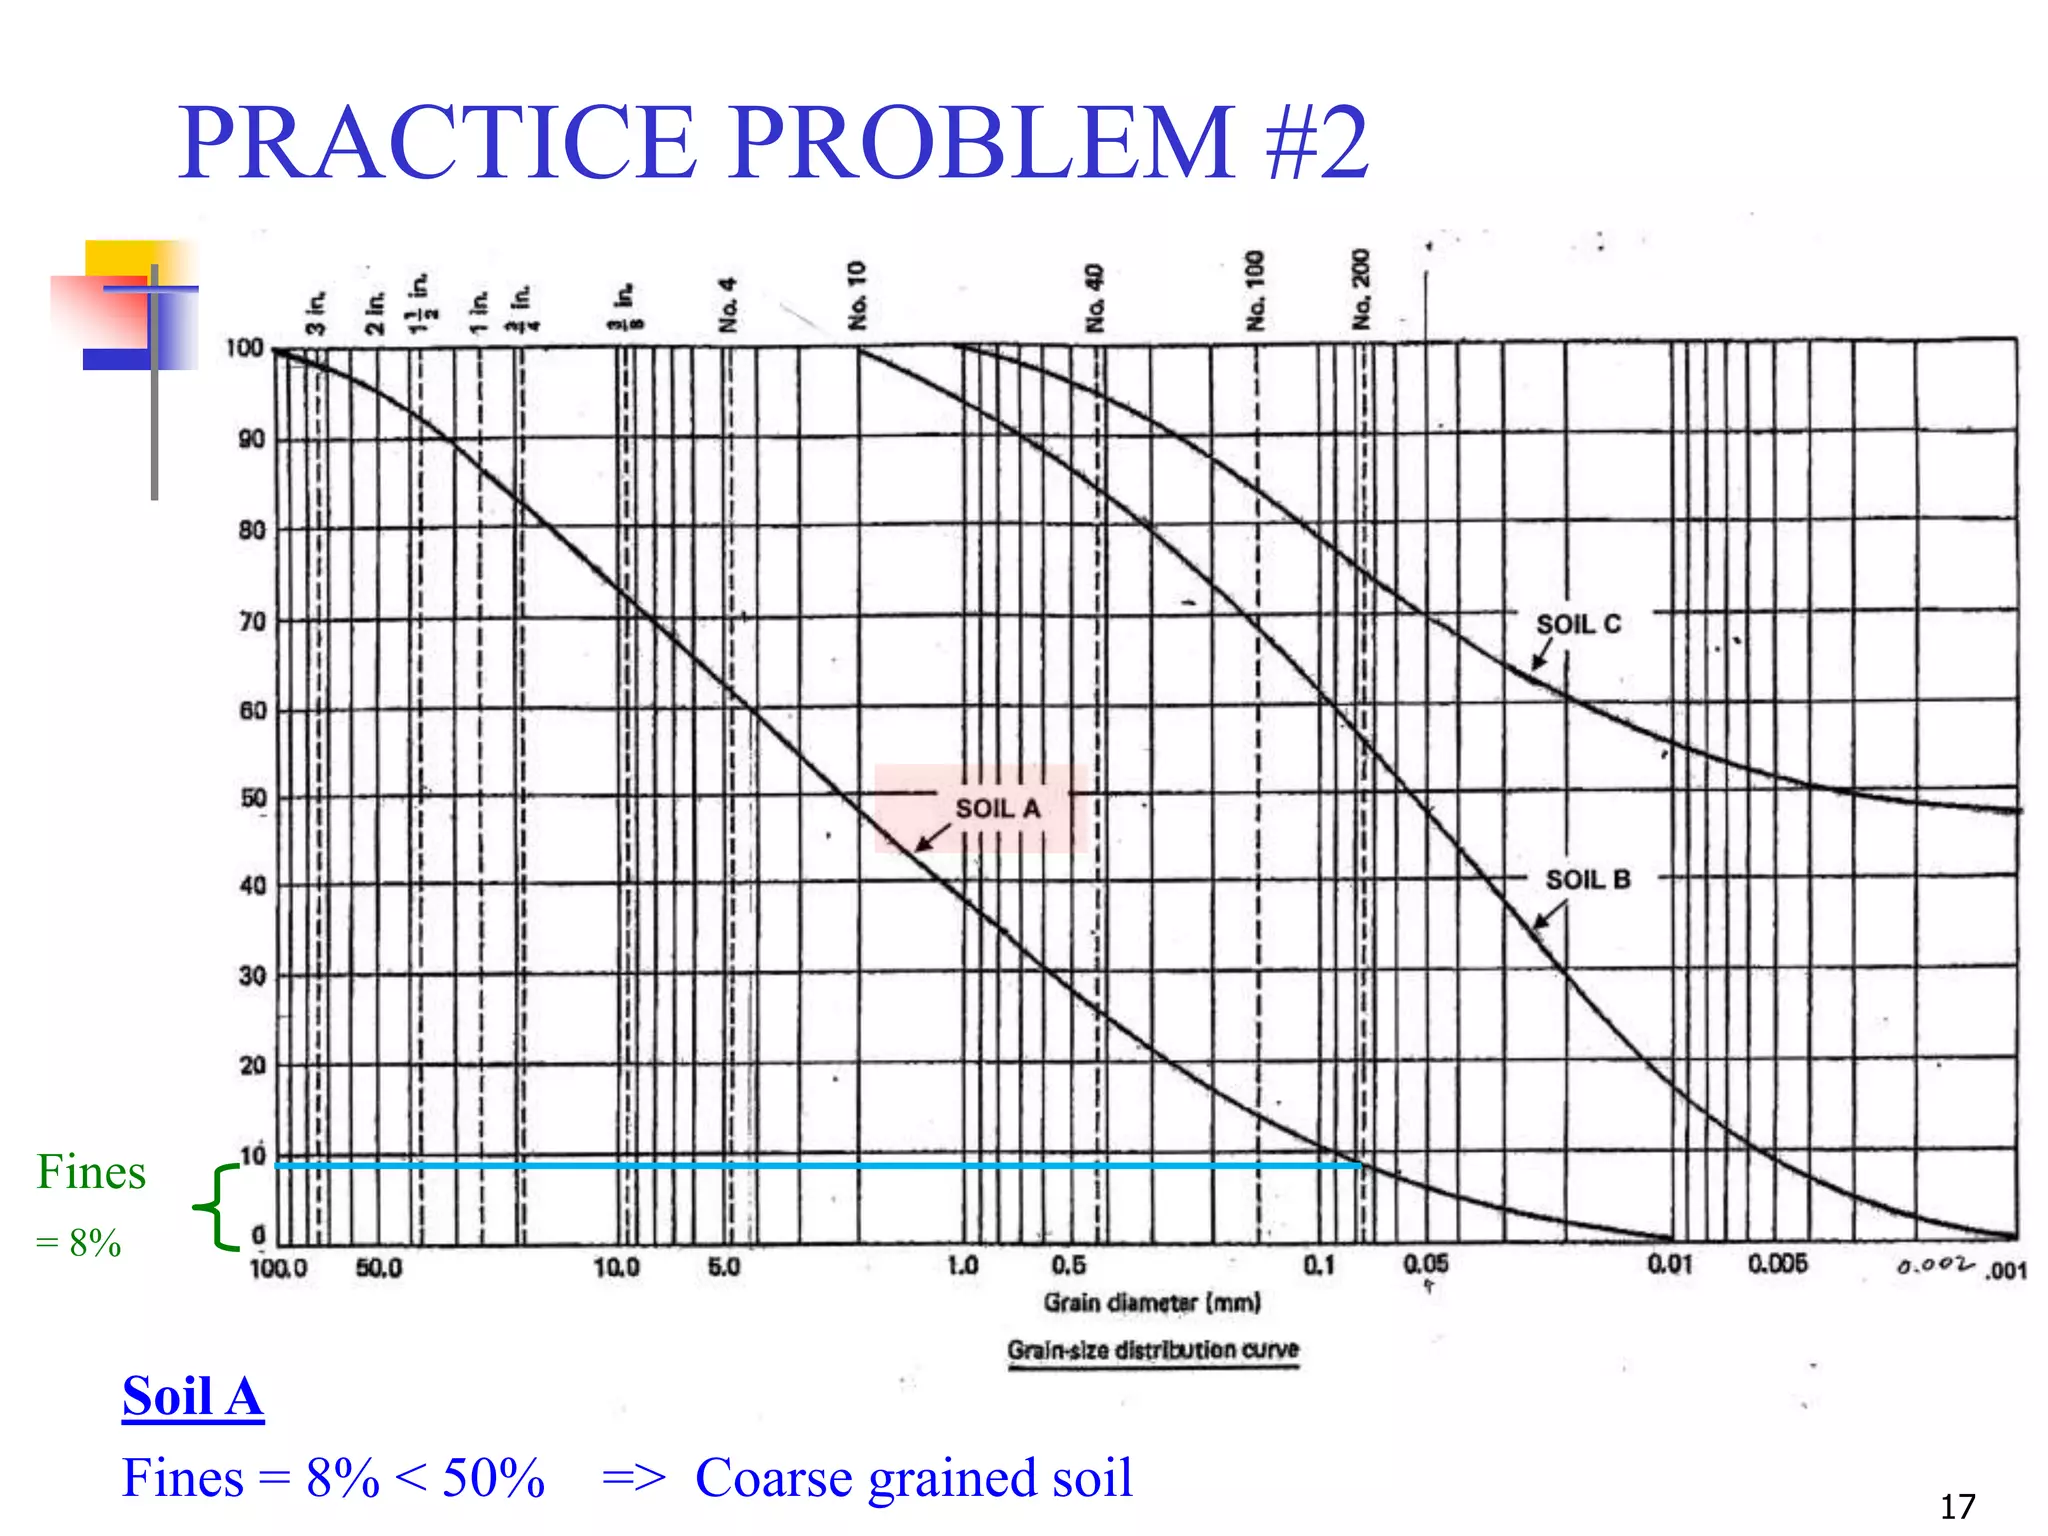
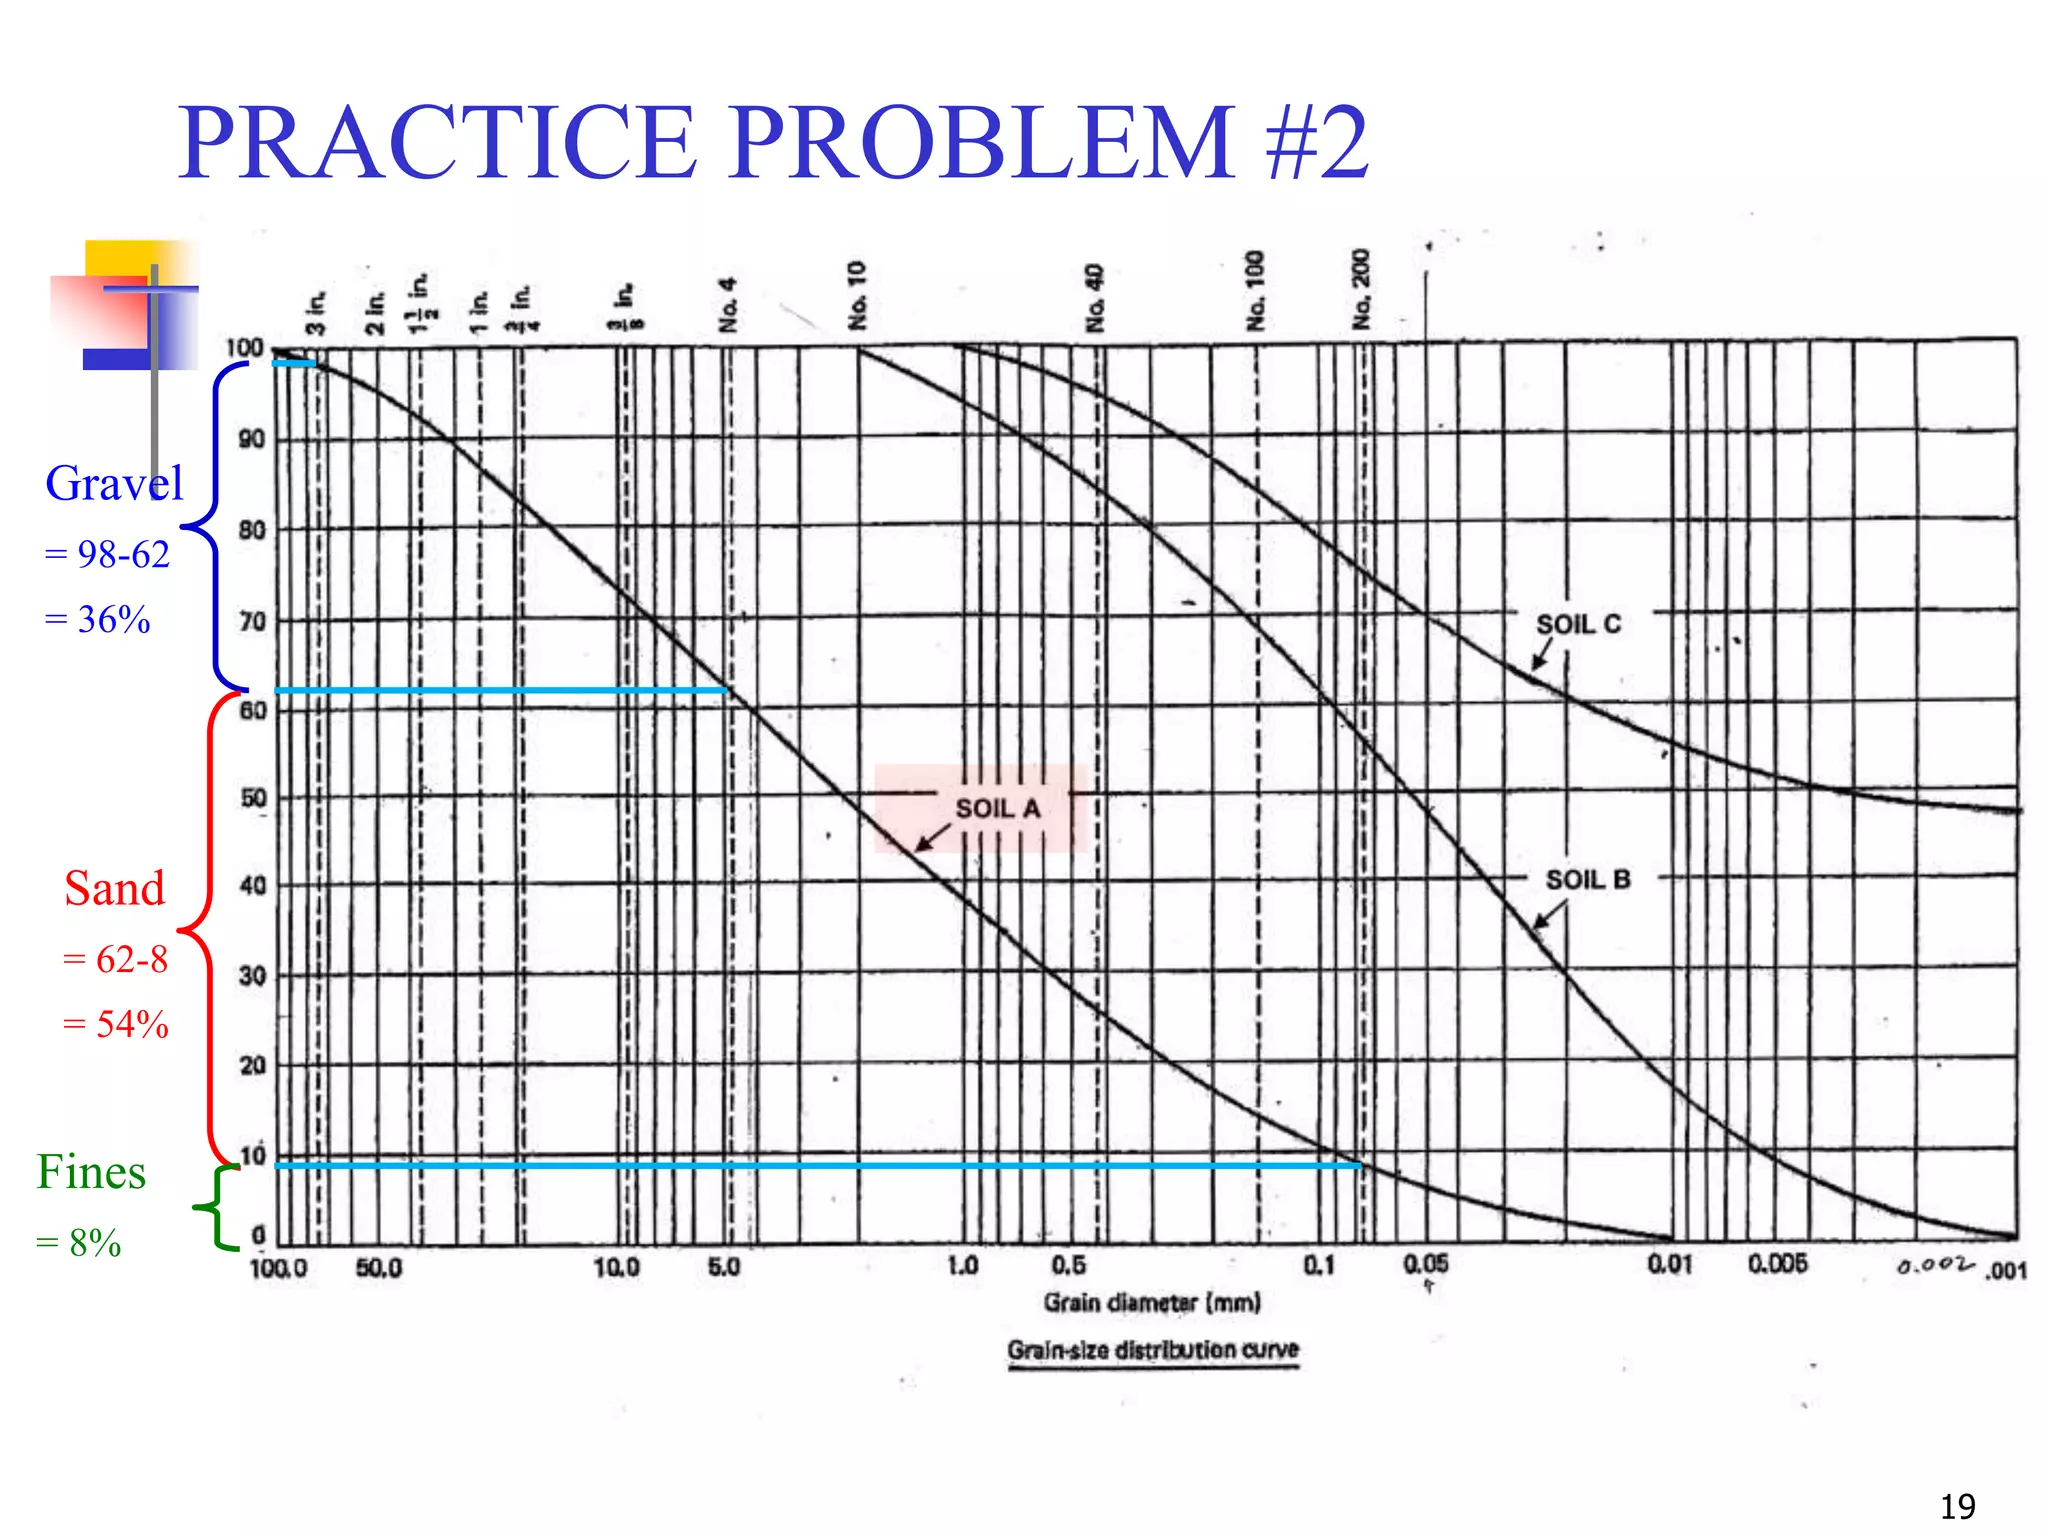
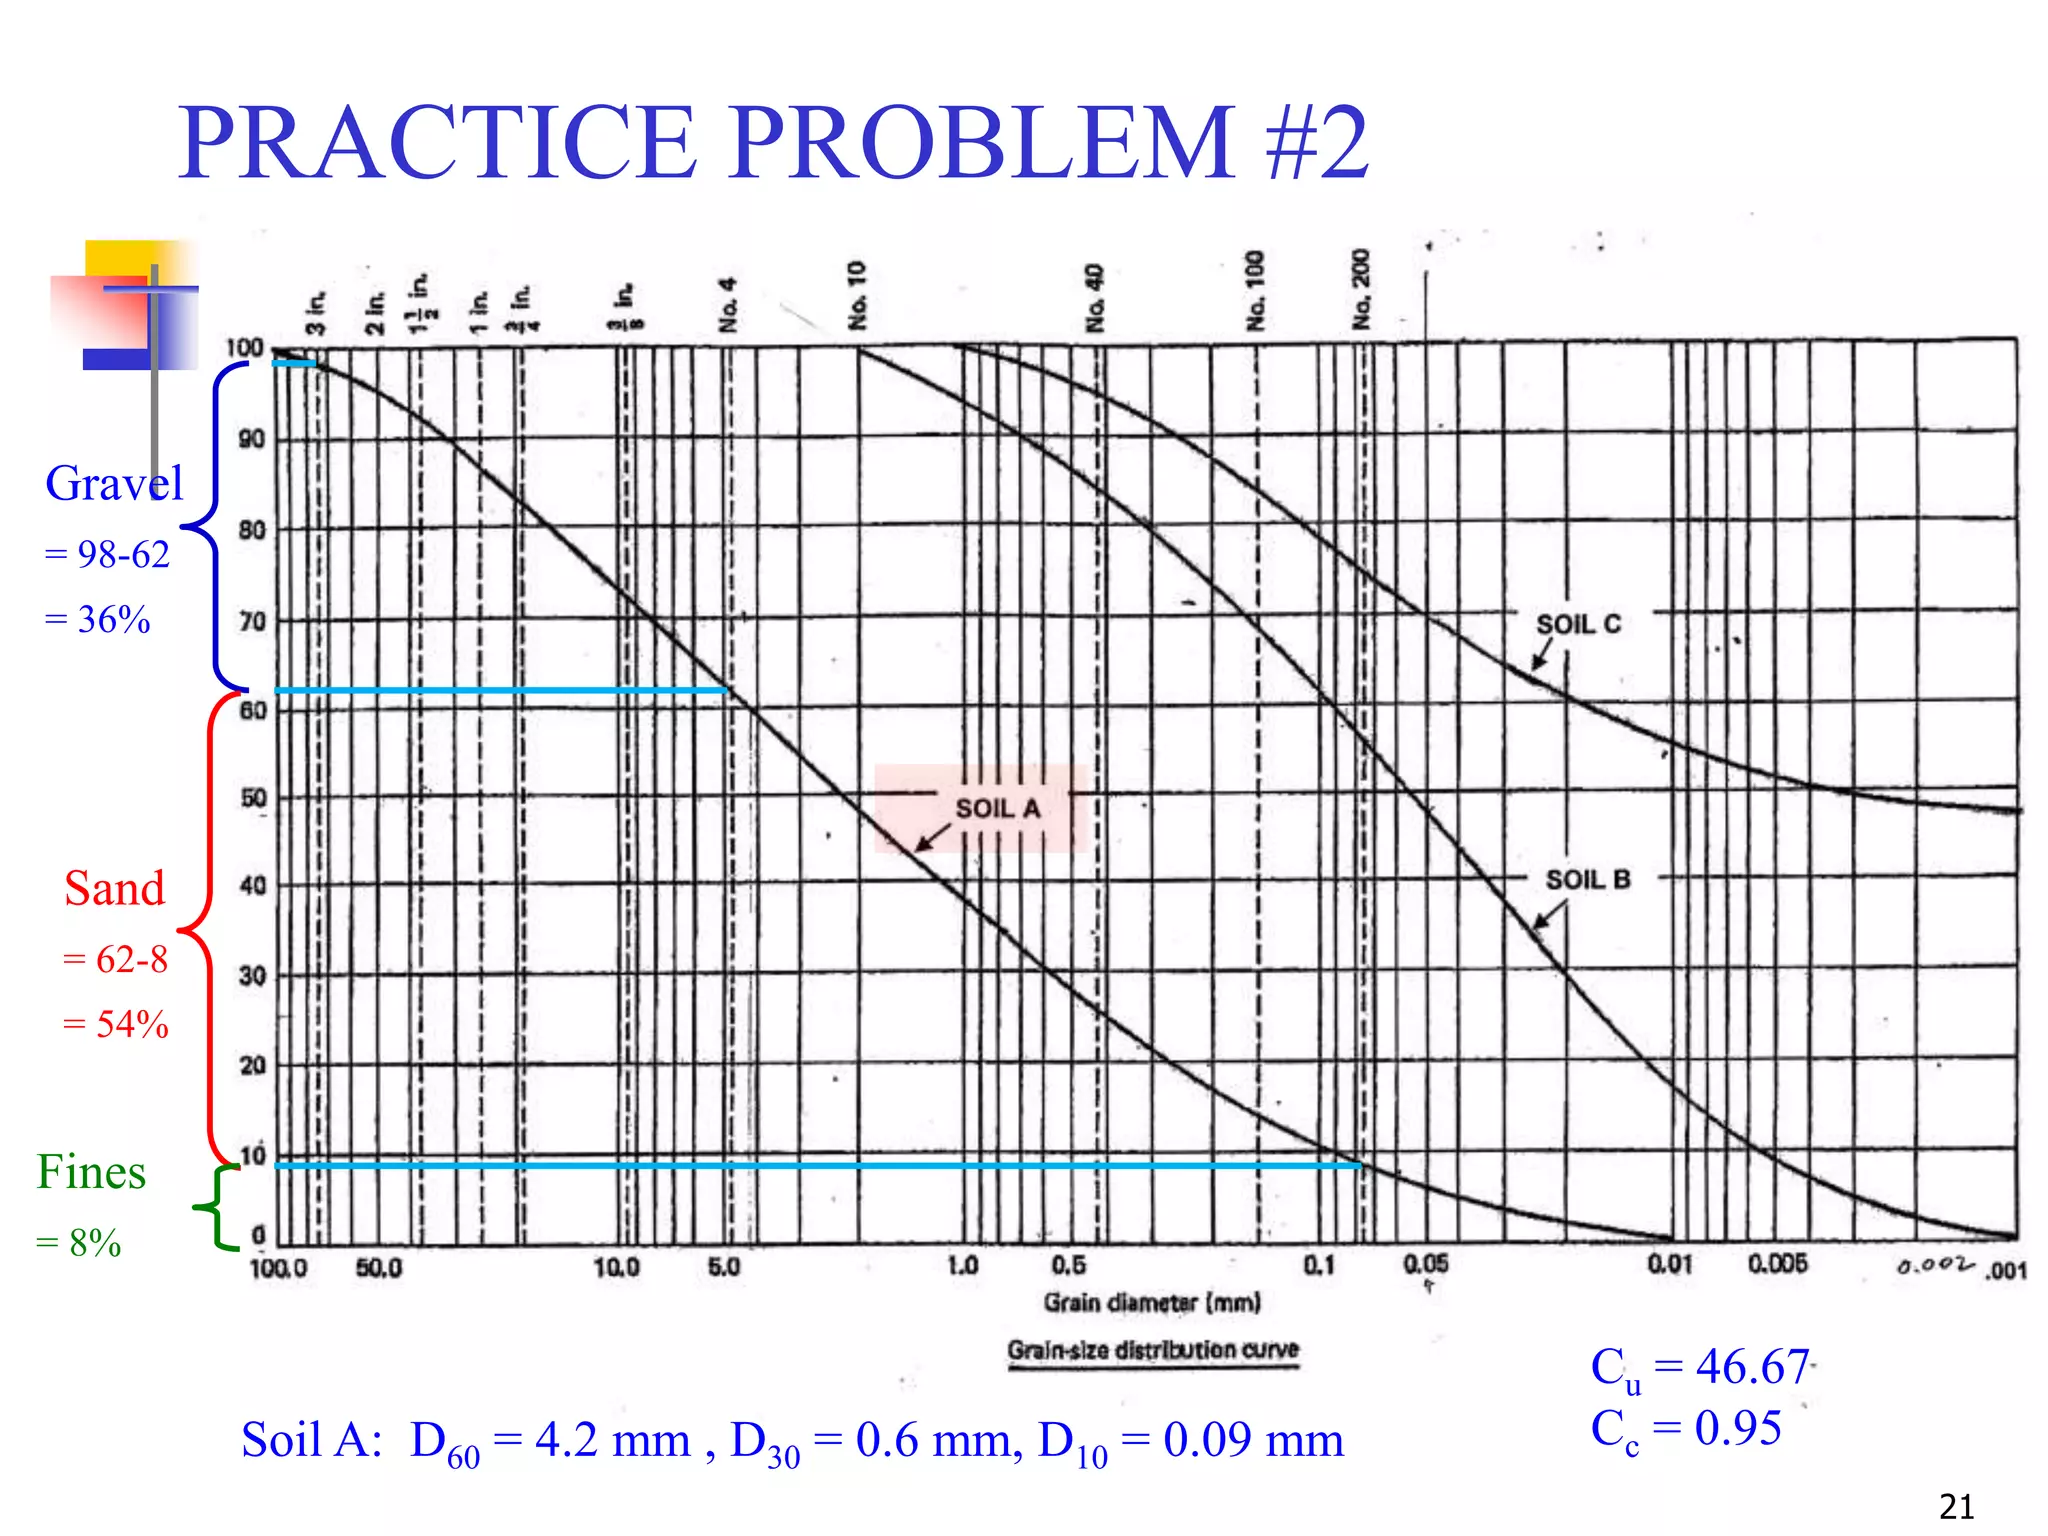
Gravel = 36%
Sand = 54%
Fines = 8%
Cu = 46.7
Cc = 0.95
Soil A is classified as [SP-SM: Poorly-graded sand with silt and gravel]
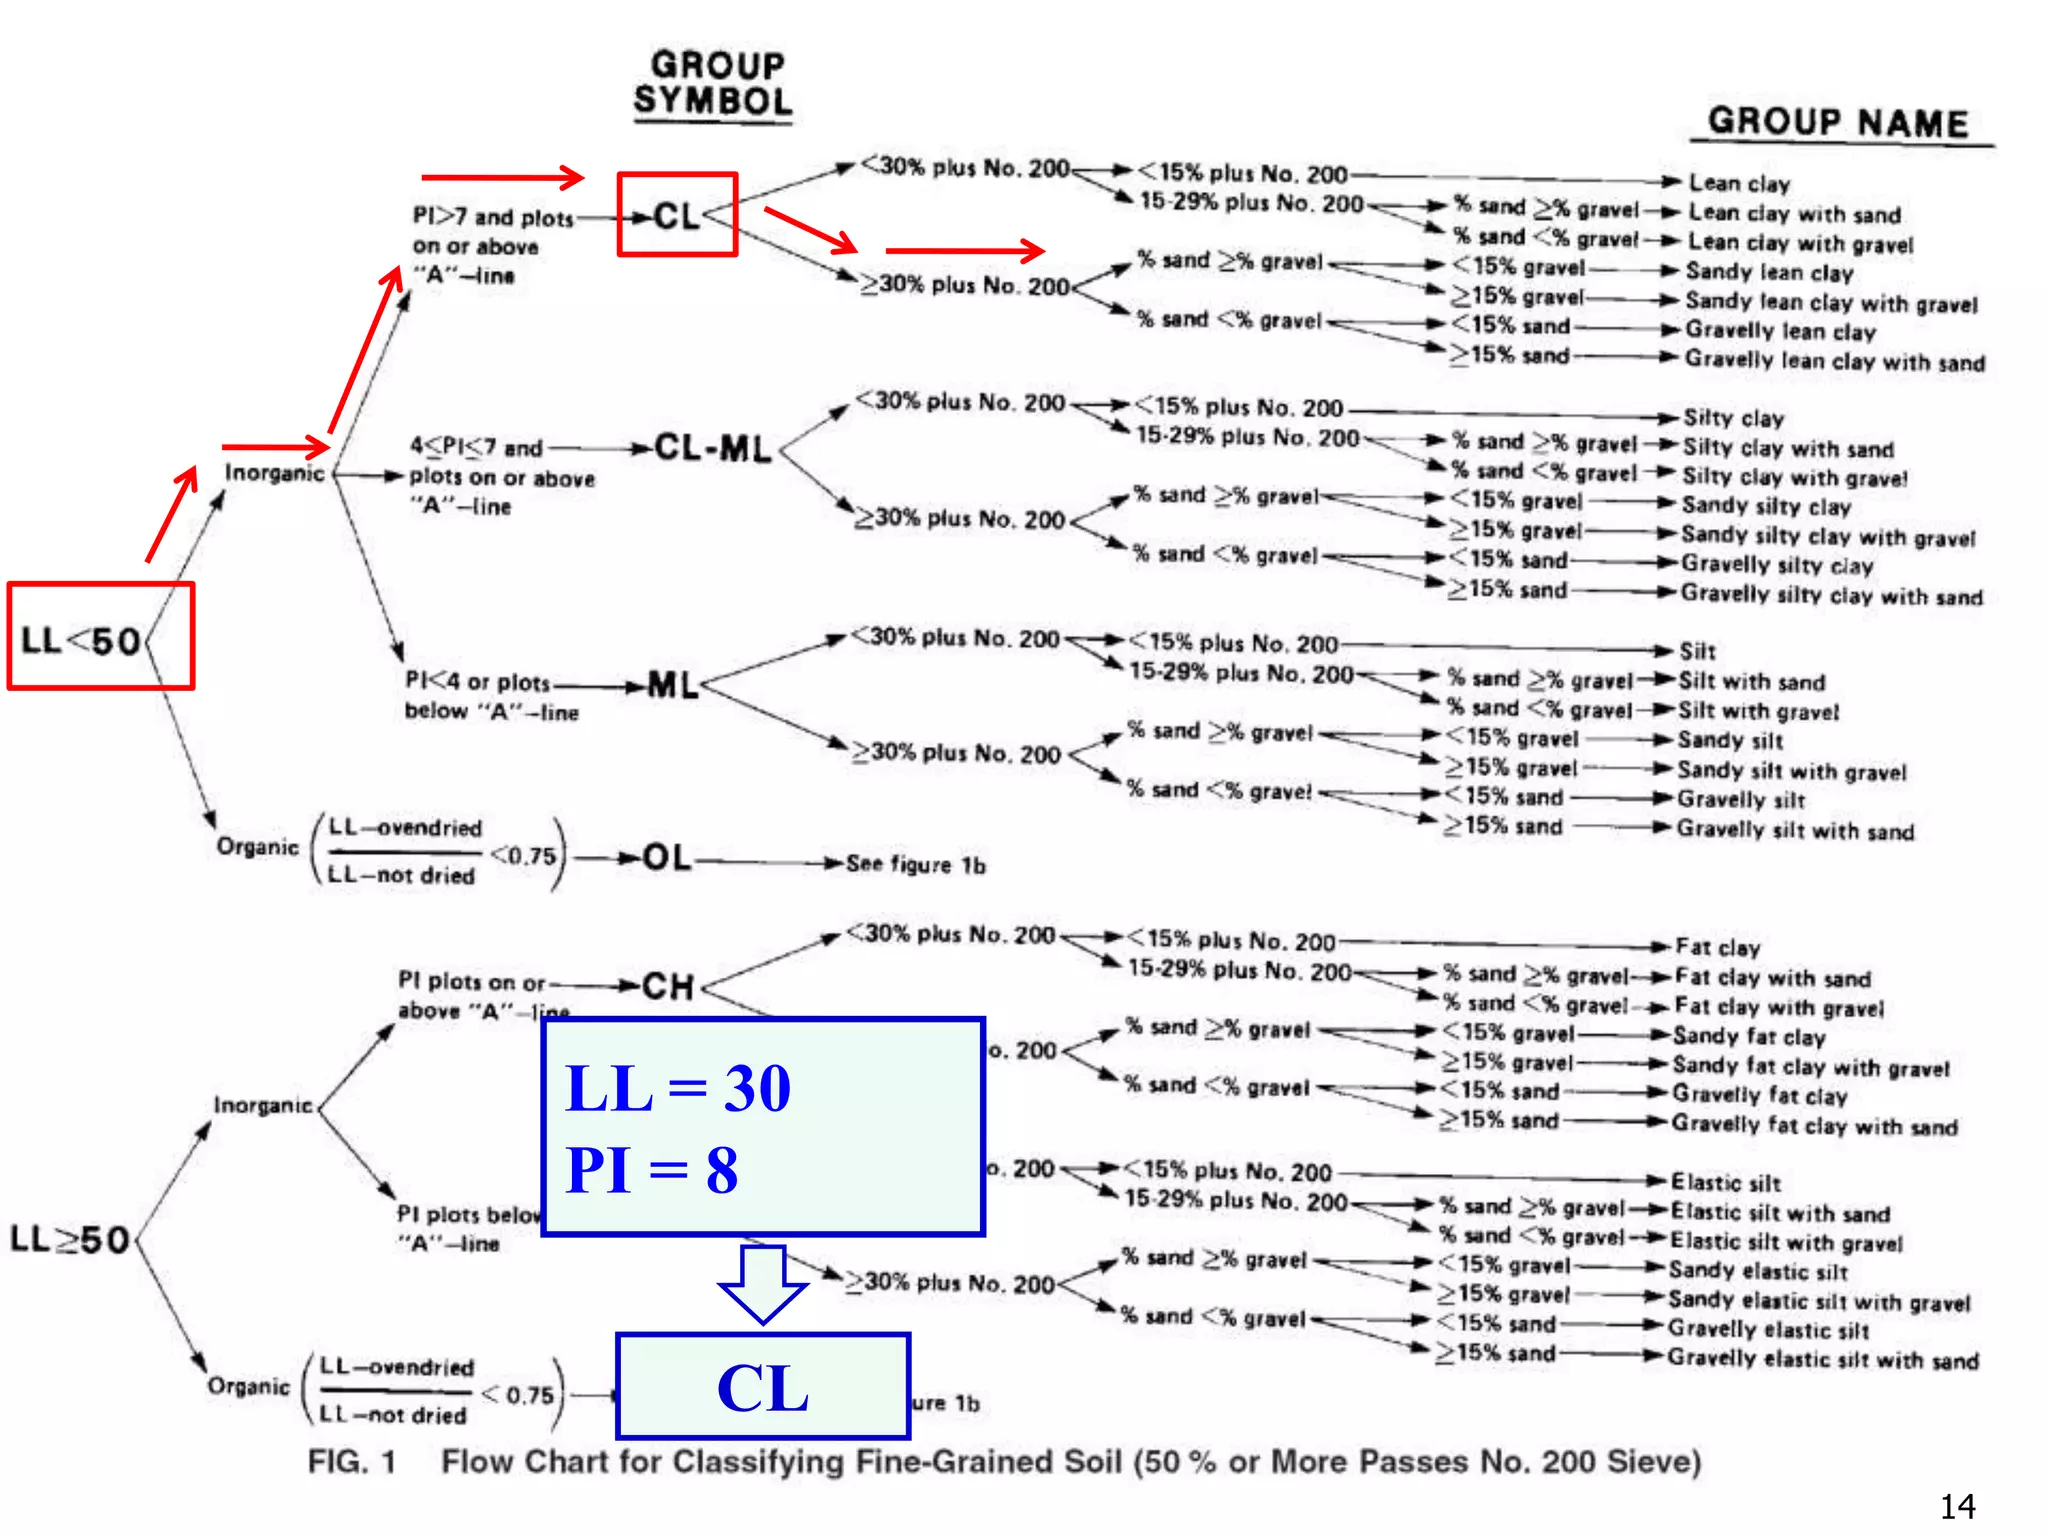
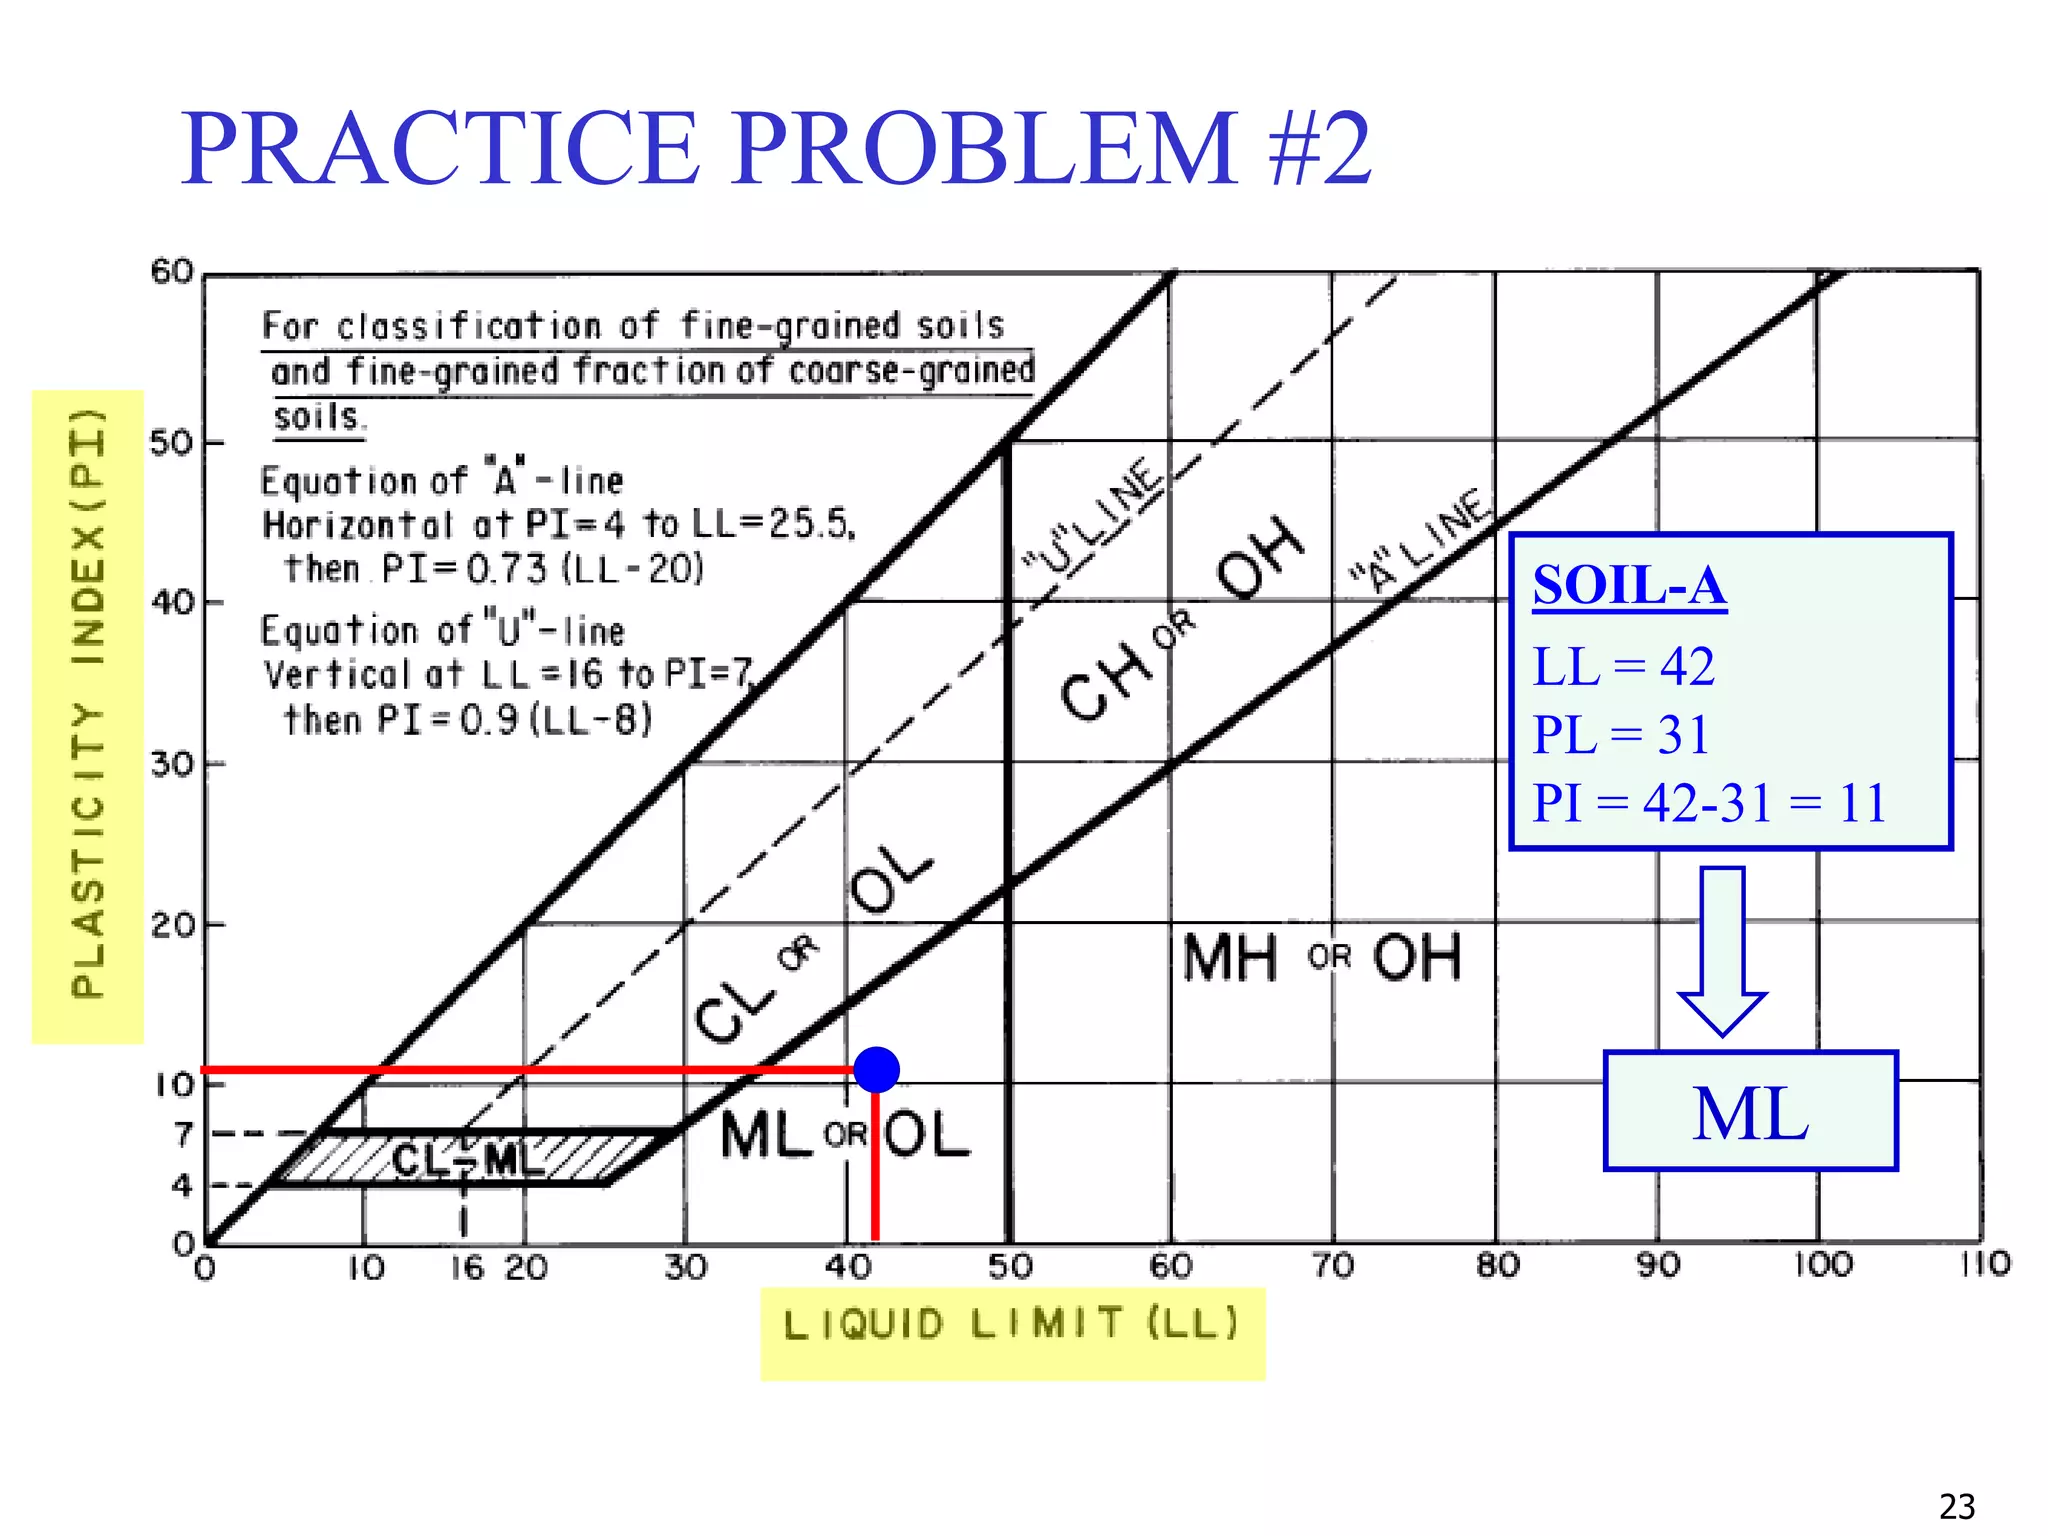
LL = 42
PL = 31
PI = 42-31 = 11
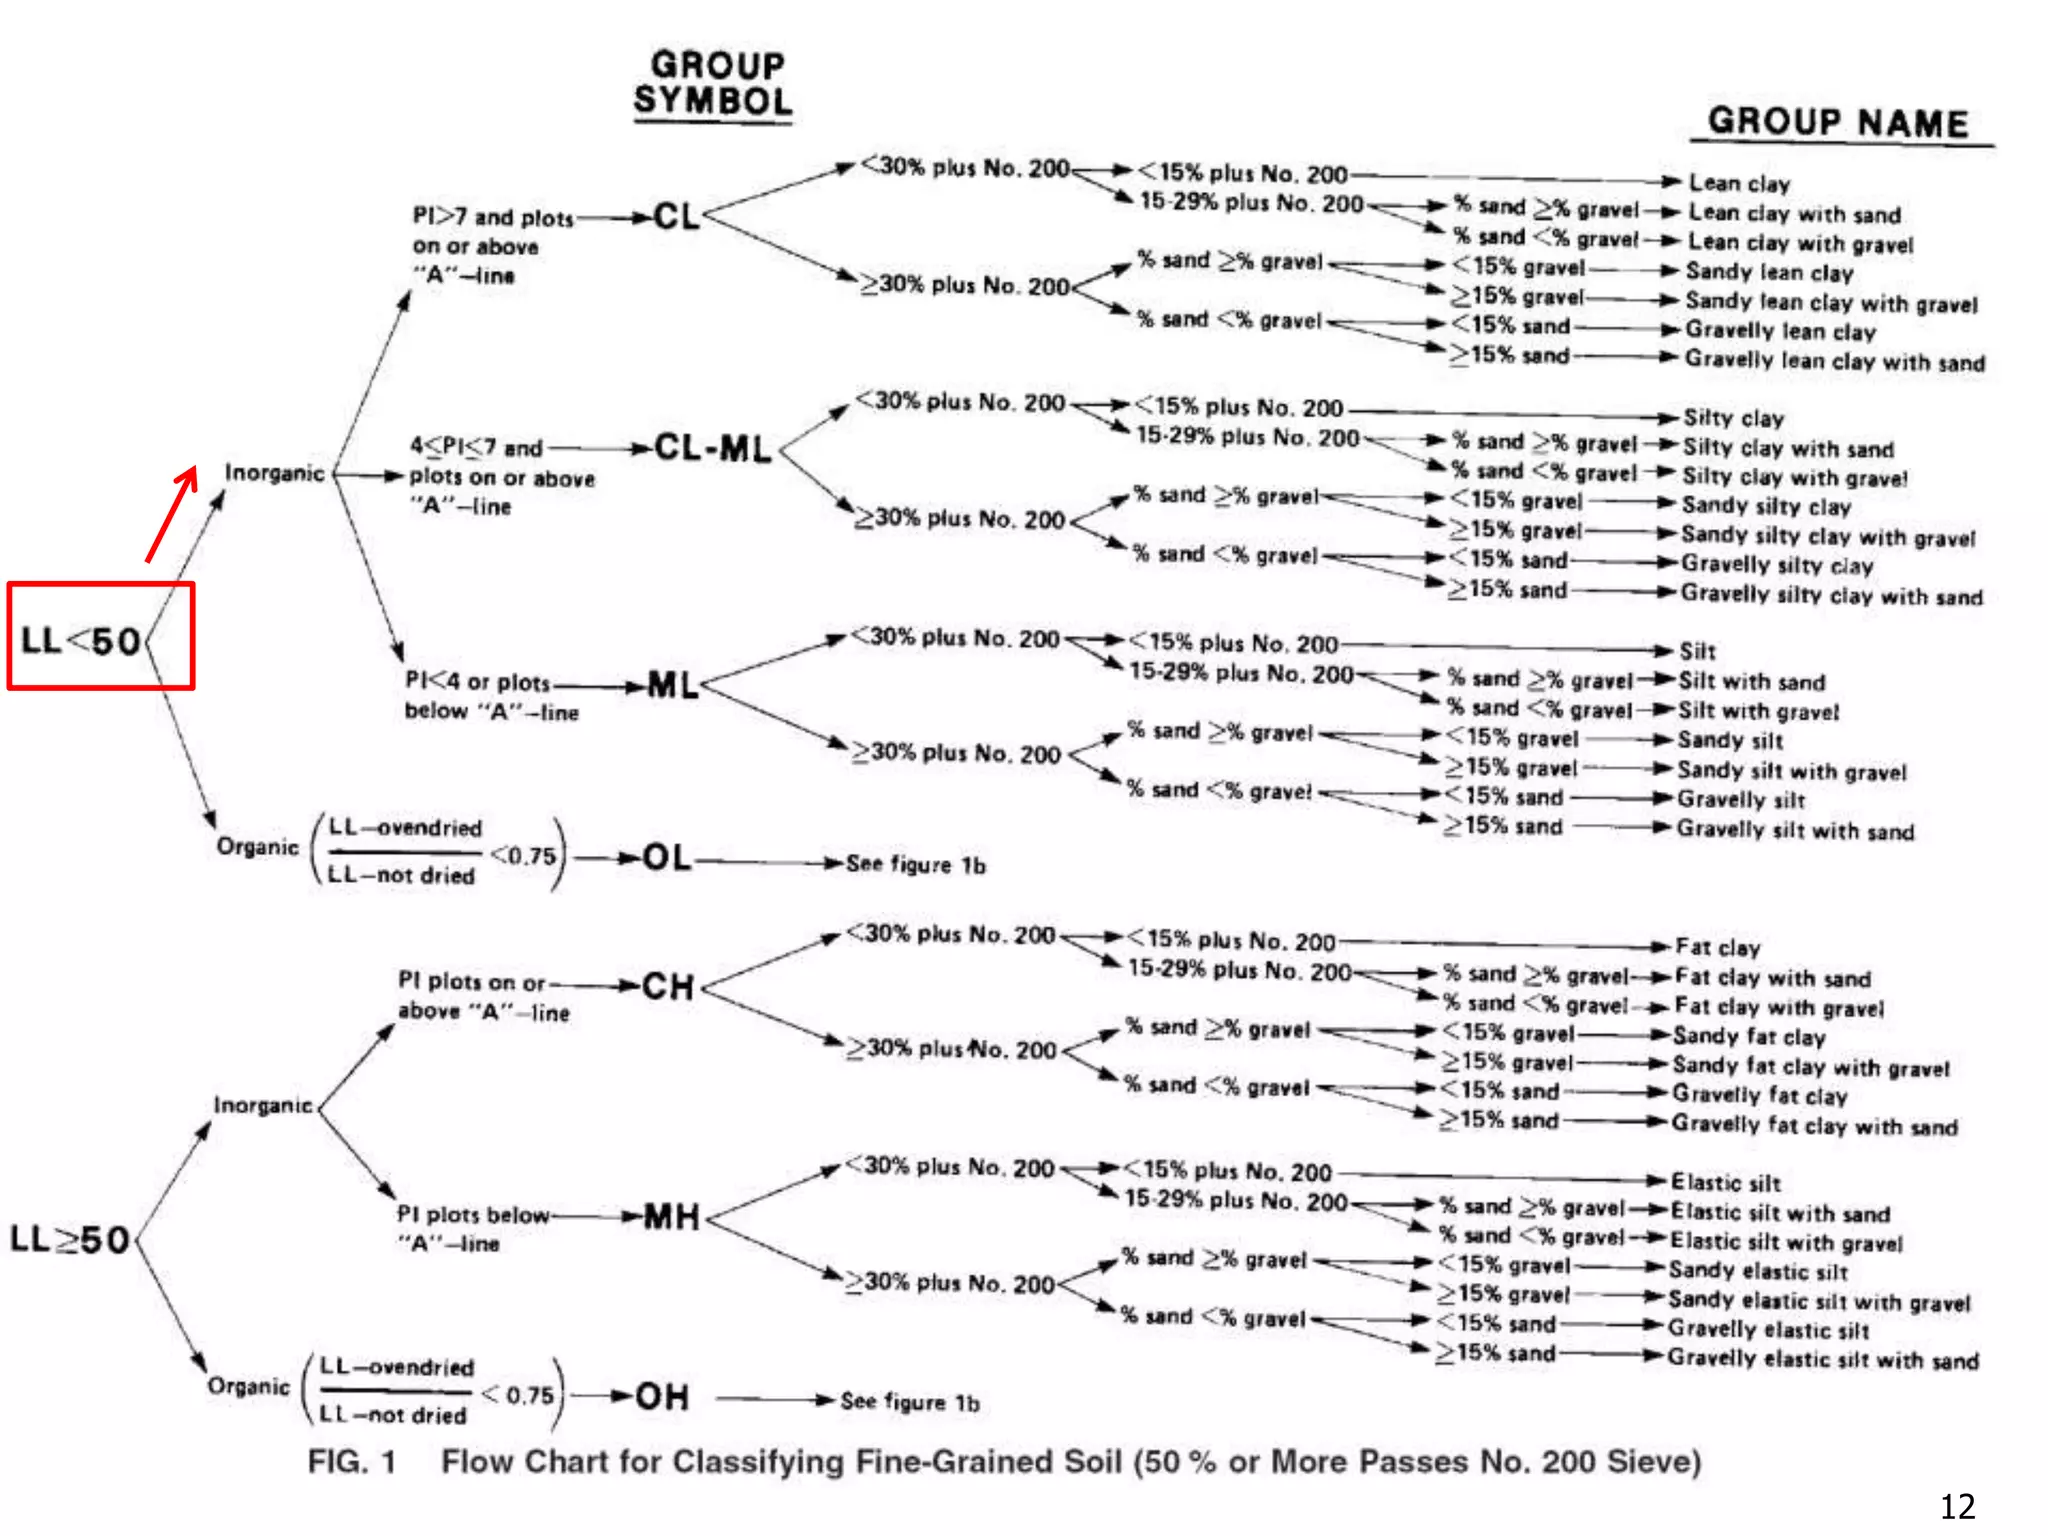
ML](https://image.slidesharecdn.com/11-180923183816/75/Geotechnical-Engineering-I-Lec-11-USCS-AASHTO-24-2048.jpg)


![Geotechnical Engineering-I [Lec #21: Consolidation Problems]](https://cdn.slidesharecdn.com/ss_thumbnails/21-180924141121-thumbnail.jpg?width=640&height=640&fit=bounds)

![Geotechnical Engineering-I [Lec #7: Sieve Analysis-2]](https://cdn.slidesharecdn.com/ss_thumbnails/7-180923180808-thumbnail.jpg?width=640&height=640&fit=bounds)
![Geotechnical Engineering-I [Lec #9: Atterberg limits]](https://cdn.slidesharecdn.com/ss_thumbnails/9-180923180923-thumbnail.jpg?width=640&height=640&fit=bounds)
![Geotechnical Engineering-I [Lec #12: AASHTO Soil Classification]](https://cdn.slidesharecdn.com/ss_thumbnails/12-180923183952-thumbnail.jpg?width=640&height=640&fit=bounds)
![Geotechnical Engineering-I [Lec #19: Consolidation-III]](https://cdn.slidesharecdn.com/ss_thumbnails/19-180924141035-thumbnail.jpg?width=640&height=640&fit=bounds)

![Geotechnical Engineering-I [Lec #8: Hydrometer Analysis]](https://cdn.slidesharecdn.com/ss_thumbnails/8-180923180849-thumbnail.jpg?width=640&height=640&fit=bounds)

![Geotechnical Engineering-I [Lec #27: Flow Nets]](https://cdn.slidesharecdn.com/ss_thumbnails/27-180924141458-thumbnail.jpg?width=640&height=640&fit=bounds)


![Geotechnical Engineering-I [Lec #24: Soil Permeability - II]](https://cdn.slidesharecdn.com/ss_thumbnails/24-180924141149-thumbnail.jpg?width=640&height=640&fit=bounds)


![Geotechnical Engineering-I [Lec #3: Phase Relationships]](https://cdn.slidesharecdn.com/ss_thumbnails/3-180923175732-thumbnail.jpg?width=640&height=640&fit=bounds)


![Geotechnical Engineering-II [Lec #27: Infinite Slope Stability Analysis]](https://cdn.slidesharecdn.com/ss_thumbnails/27-181125070251-thumbnail.jpg?width=640&height=640&fit=bounds)
![Geotechnical Engineering-I [Lec #18: Consolidation-II]](https://cdn.slidesharecdn.com/ss_thumbnails/18-180924140946-thumbnail.jpg?width=640&height=640&fit=bounds)


![Geotechnical Engineering-I [Lec #10: USCS]](https://cdn.slidesharecdn.com/ss_thumbnails/10-180923183613-thumbnail.jpg?width=640&height=640&fit=bounds)


![Geotechnical Engineering-II [Lec #28: Finite Slope Stability Analysis]](https://cdn.slidesharecdn.com/ss_thumbnails/28-181125070402-thumbnail.jpg?width=640&height=640&fit=bounds)
![Geotechnical Engineering-II [Lec #26: Slope Stability]](https://cdn.slidesharecdn.com/ss_thumbnails/26-181125070353-thumbnail.jpg?width=640&height=640&fit=bounds)
![Geotechnical Engineering-II [Lec #25: Coulomb EP Theory - Numericals]](https://cdn.slidesharecdn.com/ss_thumbnails/25-181123050611-thumbnail.jpg?width=640&height=640&fit=bounds)
![Geotechnical Engineering-II [Lec #24: Coulomb EP Theory]](https://cdn.slidesharecdn.com/ss_thumbnails/24-181123050536-thumbnail.jpg?width=640&height=640&fit=bounds)
![Geotechnical Engineering-II [Lec #23: Rankine Earth Pressure Theory]](https://cdn.slidesharecdn.com/ss_thumbnails/23-181123050516-thumbnail.jpg?width=640&height=640&fit=bounds)
![Geotechnical Engineering-II [Lec #22: Earth Pressure at Rest]](https://cdn.slidesharecdn.com/ss_thumbnails/22-181123050434-thumbnail.jpg?width=640&height=640&fit=bounds)


![Geotechnical Engineering-II [Lec #19: General Bearing Capacity Equation]](https://cdn.slidesharecdn.com/ss_thumbnails/19-181123045917-thumbnail.jpg?width=640&height=640&fit=bounds)
![Geotechnical Engineering-II [Lec #18: Terzaghi Bearing Capacity Equation]](https://cdn.slidesharecdn.com/ss_thumbnails/18-181123045854-thumbnail.jpg?width=640&height=640&fit=bounds)
![Geotechnical Engineering-II [Lec #17: Bearing Capacity of Soil]](https://cdn.slidesharecdn.com/ss_thumbnails/17-181123045836-thumbnail.jpg?width=640&height=640&fit=bounds)
![Geotechnical Engineering-II [Lec #15 & 16: Schmertmann Method]](https://cdn.slidesharecdn.com/ss_thumbnails/15-181020124920-thumbnail.jpg?width=640&height=640&fit=bounds)
![Geotechnical Engineering-II [Lec #14: Timoshenko & Goodier Method]](https://cdn.slidesharecdn.com/ss_thumbnails/14-181020124917-thumbnail.jpg?width=640&height=640&fit=bounds)
![Geotechnical Engineering-II [Lec #13: Elastic Settlements]](https://cdn.slidesharecdn.com/ss_thumbnails/13-181020124852-thumbnail.jpg?width=640&height=640&fit=bounds)
![Geotechnical Engineering-II [Lec #12: Consolidation Settlement Computation]](https://cdn.slidesharecdn.com/ss_thumbnails/12-181020124845-thumbnail.jpg?width=640&height=640&fit=bounds)
![Geotechnical Engineering-II [Lec #11: Settlement Computation]](https://cdn.slidesharecdn.com/ss_thumbnails/11-181020124840-thumbnail.jpg?width=640&height=640&fit=bounds)
![Geotechnical Engineering-II [Lec #9+10: Westergaard Theory]](https://cdn.slidesharecdn.com/ss_thumbnails/9-181020124827-thumbnail.jpg?width=640&height=640&fit=bounds)
![Geotechnical Engineering-II [Lec #8: Boussinesq Method - Rectangular Areas]](https://cdn.slidesharecdn.com/ss_thumbnails/8-181020124822-thumbnail.jpg?width=640&height=640&fit=bounds)
![Geotechnical Engineering-II [Lec #7A: Boussinesq Method]](https://cdn.slidesharecdn.com/ss_thumbnails/7a-181020124807-thumbnail.jpg?width=640&height=640&fit=bounds)
![Geotechnical Engineering-II [Lec #7: Soil Stresses due to External Load]](https://cdn.slidesharecdn.com/ss_thumbnails/7-180930132739-thumbnail.jpg?width=640&height=640&fit=bounds)


